
Trade Surveillance System Market

Trade Surveillance System Market by Application (Surveillance & Analytics, Risk & Compliance, Reports & Monitoring, Case Management) and End User (Financial Institutions, Capital Market, Digital Asset Exchange) - Global Forecast to 2030


OVERVIEW

Source: Secondary Research, Interviews with Experts, MarketsandMarkets Analysis
The trade surveillance system market is expected to grow substantially, rising from USD 3.00 billion in 2025 to USD 5.90 billion by 2030, reflecting a CAGR of 14.5%. Trade surveillance systems oversee trading activity across multiple asset classes and venues, helping firms detect irregularities, enforce compliance, and maintain market transparency. The market for these systems is expanding rapidly due to stricter global regulations, growing trading complexity, and the increasing need for financial institutions, capital markets, and digital asset exchanges to strengthen operational efficiency and mitigate financial and reputational risks.
Market Size and Forecast:
- Market Size Value in 2024: USD 2.49 Billion
- Market Size Value in 2025: USD 3.00 Billion
- Revenue Forecast in 2030: USD 5.90 Billion
- Growth Rate: CAGR of 14.5 % from 2025 to 2030
- Data available from 2020 to 2030
- Base year: 2024
- Forecast period: 2025-2030
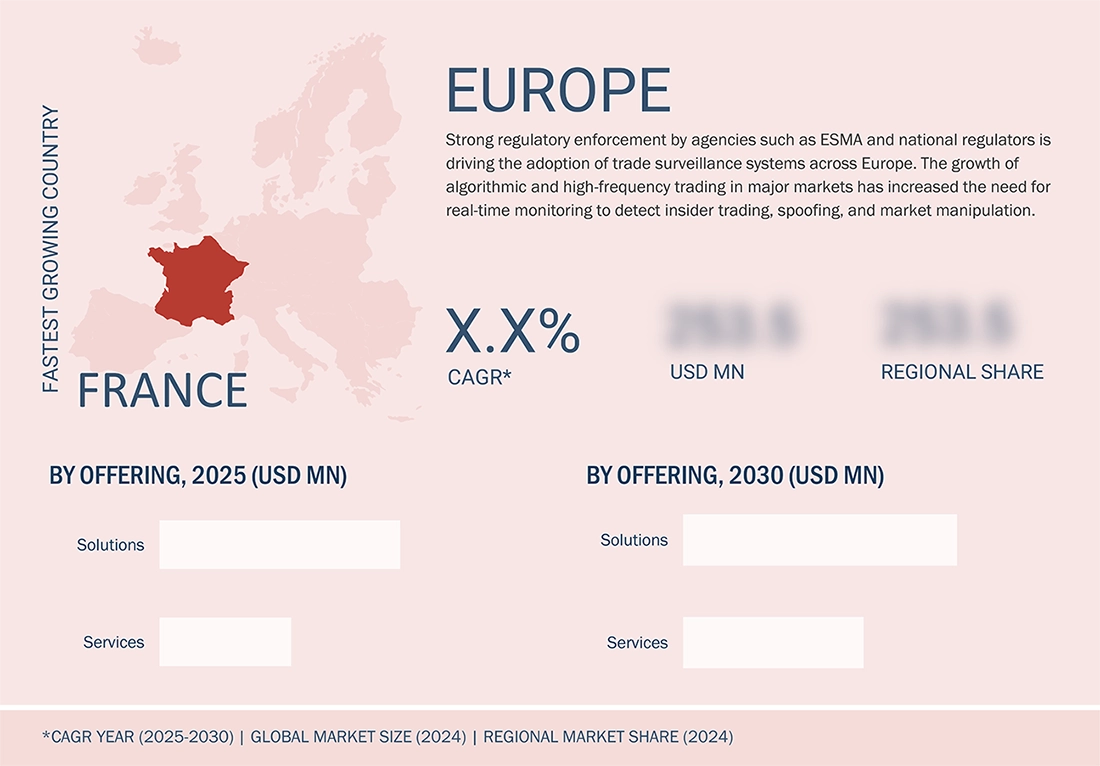
- Largest Growing Region: Europe
- The Trade Surveillance System Services Segment growing at a CAGR of 16.5 %
KEY TAKEAWAYS
- The Europe trade surveillance system market accounted for a 31.5% revenue share in 2024.
- By offering, the services segment is expected to register the highest CAGR of 16.5%.
- By application , case management segment is projected to grow at highest CAGR.
- By organization size, large enterprises segment will hold the largest market share.
- By deployment type, the cloud segment is expected to dominate the trade surveillance system market.
- By end user, the capital markets segment is projected to grow the at the fastest rate of 20.2% during the forecast period.
- Company NiCE, Nasdaq, and FIS were identified as some of the star players in the trade surveillance system market (global), given their strong market share and product footprint.
- Companies KX, Acuity Knowledge Partner, and MyComplianceOffice, among others, have distinguished themselves among startups and SMEs by securing strong footholds in specialized niche areas, underscoring their potential as emerging market leaders
Monitoring every trade in real time is no longer optional, as it is very critical to maintain investor trust. Automated surveillance solutions empower firms to track algorithmic and high-frequency trades at microsecond intervals, detect manipulative practices such as spoofing, layering, and quote stuffing, and enforce compliance with global regulations such as the SEC's Market Access Rule and Europe's MiFID II. These platforms streamline reporting, reinforce market integrity, and shield organizations from financial penalties, regulatory scrutiny, and reputational damage.
TRENDS & DISRUPTIONS IMPACTING CUSTOMERS' CUSTOMERS
The impact on consumers' business emerges from customer trends or disruptions. Hot bets are the clients of trade surveillance system providers, and target applications such as market abuse detection, trade monitoring, AML integration, and case management are the services offered to these clients. Regulatory or market shifts will affect end users' compliance, risk management, and operational efficiency, which in turn influences the revenues of hot bets and drives the growth of trade surveillance system providers.

Source: Secondary Research, Interviews with Experts, MarketsandMarkets Analysis
MARKET DYNAMICS
Level
-
Stringent regulatory compliance requirements

-
Rising market abuse and insider trading cases

Level
-
Technology failures creating surveillance blind spots

Level
-
Surveillance for crypto and digital assets

-
Integration of AI and machine learning to reduce false positive rates

Level
-
Integration across disparate systems

-
Non-standardization of compliances, evolving business models, and expanding global regulations

Source: Secondary Research, Interviews with Experts, MarketsandMarkets Analysis
Driver: Increasing Trading Volumes Across Emerging Nations
Rising trading volumes across emerging nations are reshaping capital markets, driven by increased investor participation, digital access, and the growth of high-frequency and algorithmic trading. This surge is creating pressure on institutions to ensure transparency, manage operational complexity, and comply with evolving regional regulations, fueling demand for robust trade surveillance systems.
Restraint: Technology Failures Creating Surveillance Blind Spots
Technology failures such as system outages, data feed interruptions, and software glitches create surveillance blind spots, undermining the effectiveness of trade surveillance systems and increasing compliance risks. For instance, the UK Financial Conduct Authority’s Market Watch 79 report (2024) highlighted cases where faulty implementations, software bugs, and data ingestion failures led firms to miss entire business segments or generate incomplete alerts. These issues in both in-house and vendor-managed systems underscore how inadequate implementation and testing erode trust, hinder adoption, and threaten compliance with regulatory requirements.
Opportunity: Surveillance for Crypto and Digital Assets
The rapid expansion of digital assets, including crypto, NFTs, DeFi, and tokenized securities, is creating significant opportunities for trade surveillance systems. With global cryptocurrency market capitalization at USD 1.17 trillion in March 2023 and tokenization projected to reach USD 5 trillion by 2030, rising complexity and regulatory scrutiny drive demand for specialized tools to monitor blockchain transactions, smart contracts, and cross-platform activity. These systems help firms detect fraud and manipulation, ensure compliance, protect investor trust, and enable sustainable growth in the evolving digital asset economy.
Challenge: Monitoring and Mitigating Risks from Colocation-driven Trade Manipulation
Colocation-driven trade manipulation poses a significant challenge for financial markets, as traders gain unfair speed advantages through proximity to exchange infrastructure, enabling practices like latency arbitrage and front-running. Detecting such abuses requires advanced surveillance tools to monitor trades at microsecond intervals. Ongoing disputes, such as India’s NSE co-location and dark fibre cases, underscore the complexity of identifying and curbing preferential access even in tightly regulated markets, highlighting the critical need for high-frequency monitoring solutions to ensure fairness and integrity.
Trade Surveillance System Market: COMMERCIAL USE CASES ACROSS INDUSTRIES
| COMPANY | USE CASE DESCRIPTION | BENEFITS |
|---|---|---|
 |
Implementation of cloud-based trade surveillance and risk platforms enables real-time cross-asset monitoring, regulatory compliance, and operational efficiency, strengthening transparency and trust in capital markets. | Cloud-based trade surveillance improved compliance, reduced costs, and enabled faster, smarter decisions. |
 |
Unified reporting, trade surveillance, and best execution on a single platform with high automation and workflow visibility. | Delivered stronger compliance, lower costs, and greater efficiency through automation and centralization. |
 |
Implemented crypto-native trade surveillance to monitor transactions, detect suspicious activities, and onboard new venues seamlessly. | Enhanced compliance, security, and trust while enabling scalable growth in digital asset markets. |
Logos and trademarks shown above are the property of their respective owners. Their use here is for informational and illustrative purposes only.
MARKET ECOSYSTEM
Prominent trade surveillance system market players operate across surveillance and analytics, risk and compliance, reporting and monitoring, and case management. These companies deliver AI-driven, multi-asset solutions via cloud and on-premises models, backed by advanced technologies, regulatory expertise, and global networks to help institutions detect market abuse, ensure compliance, and boost efficiency.

Logos and trademarks shown above are the property of their respective owners. Their use here is for informational and illustrative purposes only.
MARKET SEGMENTS

Source: Secondary Research, Interviews with Experts, MarketsandMarkets Analysis
Trade Surveillance System Market, By Offering
The solution segment is expected to hold the largest market throughout the forecast period. The solution provides financial institutions, capital markets, and digital asset exchanges with end-to-end capabilities to detect, investigate, and prevent market abuse while ensuring regulatory compliance and protecting market integrity. Leveraging advanced analytics and configurable detection scenarios, it generates context-driven alerts that reduce false positives and enable compliance teams to prioritize critical cases efficiently. Its architecture integrates seamlessly with order management systems, market data feeds, and third-party applications, covering equities, fixed income, derivatives, and digital assets. A robust case management module supports the full investigation lifecycle with secure audit trails and scalable performance to handle fluctuating trade volumes.
Trade Surveillance System Market, By Application
The surveillance & analytics segment is expected to hold the largest market share during the forecast period. Surveillance and analytics form the foundation of modern trade surveillance systems, enabling institutions to detect, investigate, and address potential market misconduct quickly and precisely. Solutions from vendors such as Nasdaq, NICE Actimize, and SMARTS Surveillance combine continuous monitoring with intelligent data processing to deliver actionable insights that strengthen compliance and market integrity. Processing large volumes of trade and order data in near real time, these systems identify irregularities and emerging risks before escalation, enabling timely intervention.
Trade Surveillance System Market, By Deployment Type
Cloud-based surveillance is expected to grow at the highest CAGR. Cloud-based trade surveillance provides a flexible, scalable, and cost-efficient approach to monitoring trading activities while meeting regulatory requirements. By hosting systems on secure cloud infrastructure, firms can quickly scale processing capacity to handle fluctuating trading volumes without heavy investment in physical hardware, ensuring responsiveness during peak market activity. Remote accessibility allows compliance teams to monitor, investigate, and act from any location, supporting global operations. Cloud deployment enables faster implementation and seamless software updates, aligning the platform with evolving regulations and industry best practices. Built-in integration with market data feeds, order management systems, and analytics tools streamlines workflows, reduces manual intervention, and enhances operational efficiency. Advanced security measures, including encryption and multi-layer authentication, safeguard data integrity and regulatory compliance.
Trade Surveillance System Market, By End-User
The capital markets segment is expected to have the highest CAGR during the forecast period. In modern capital markets, trade surveillance systems are essential to maintaining market fairness, protecting investors, and reinforcing regulatory trust. These platforms empower exchanges, broker-dealers, and regulators to monitor trading activity across equities, fixed income, derivatives, and digital assets, ensuring fair and transparent price formation. Vendors such as ACA Group, Eventus Validus, SteelEye, and Aquis Technologies equip market participants with the ability to detect insider trading, layering, spoofing, and cross-market manipulation before they undermine liquidity or investor sentiment. These solutions enable timely intervention and enforcement by consolidating fragmented trade data, applying advanced analytics, and generating defensible audit trails. Trade surveillance system integration with trading, clearing, and settlement systems ensures end-to-end visibility, reducing systemic risk and strengthening confidence in market infrastructure. Leveraging AI-driven pattern recognition and automated alerts, trade surveillance systems help compliance teams focus on high-priority cases, streamline investigations, and adapt to evolving global regulations.
REGION
Europe is expected to hold the largest market share in the data center power market during the forecast period.
The European trade surveillance systems market is experiencing strong growth, driven by the widespread adoption of advanced, automated solutions, especially in the financial sector. This progress is primarily shaped by the European Securities and Markets Authority (ESMA), which is central in updating trading regulations to enhance market transparency and protect investors. Initiatives such as limiting CFD leverage and banning binary options for retail clients reflect the region's commitment to safeguarding market participants. As these regulations evolve, the complexity of compliance increases, making manual surveillance increasingly impractical and accelerating the shift toward automation. Economically advanced countries with robust financial infrastructures remain at the forefront of adoption, while Nordic and Eastern European markets are steadily advancing. Growth in trading activity and stricter compliance demands make automated surveillance essential across European markets, ensuring efficiency and reducing regulatory risks.
Trade Surveillance System Market: COMPANY EVALUATION MATRIX
In the trade surveillance system market matrix, Nasdaq (Star) leads with a strong market presence and comprehensive solutions for real-time monitoring, risk management, and regulatory compliance, driving widespread adoption across financial institutions, capital markets, and digital asset exchanges. KX (Emerging Leader) is gaining traction with innovative analytics and high-performance surveillance solutions tailored for algorithmic and high-frequency trading. While Nasdaq dominates with scale and established global deployments, KX shows strong growth potential to advance toward the leaders' quadrant.

Source: Secondary Research, Interviews with Experts, MarketsandMarkets Analysis
KEY MARKET PLAYERS
MARKET SCOPE
| REPORT METRIC | DETAILS |
|---|---|
| Market Size in 2024 (Value) | USD 2.49 Billion |
| Market Forecast in 2030 (Value) | USD 5.90 Billion |
| Growth Rate | CAGR of 14.5% from 2025-2030 |
| Actual Data | 2020-2030 |
| Base Year | 2024 |
| Forecast Period | 2025-2030 |
| Units Considered | Value (USD Billion) |
| Report Coverage | Revenue forecast, company ranking, competitive landscape, growth factors, and trends |
| Segments Covered | By Offering: Solutions and Services I By Application: Risk & Compliance, Reporting & Monitoring, Surveillance & Analytics, Case Management, and Other I By Deployment Type: On-premises and Cloud-Based Surveillance I By Organization Size: Large Enterprises and SMEs I By End User: Financial Institutions, Capital Markets, and Digital Asset Exchange |
| Regional Scope | North America, Asia Pacific, Europe, the Middle East & Africa, and Latin America |
WHAT IS IN IT FOR YOU: Trade Surveillance System Market REPORT CONTENT GUIDE

RECENT DEVELOPMENTS
- May 2025 : NICE Actimize enhanced its SURVEIL-X Holistic Conduct Surveillance with Actimize Intelligence Generative AI, reducing false positives by up to 85% and detecting four times more true misconduct risks across multi-language communications with contextual, explainable alerts.
- May 2025 : The Stock Exchange of Thailand expanded its partnership with Nasdaq to modernize its capital markets using Nasdaq's AI-driven risk and surveillance technology, enhancing resilience, transparency, and investor trust while promoting standardized infrastructure across Thailand's financial ecosystem.
- February 2025 : Muqassa partnered with FIS to boost trade automation and expand clearing services in Saudi Arabia, enhancing operational efficiency, supporting OTC market development, and broadening collateral options to strengthen market infrastructure, align with global standards, and attract greater investor participation.
- April 2025 : eflow Global partnered with Australian AI firm DHI to enhance its TZTS Trade Surveillance system with AI-driven risk scoring, enabling real-time news impact analysis, reducing false positives, and improving market abuse detection for over 130 global financial institutions.
- September 2025 : IPC Systems partnered with Intercontinental Exchange to launch ICE Voice, a cloud-based audio solution integrated with ICE Chat, enabling traders to seamlessly switch between chat and voice, enhancing compliance, connectivity, and workflow efficiency through IPC's Connexus Unigy platform.
Table of Contents
 Exclusive indicates content/data unique to MarketsandMarkets and not available with any competitors.
Methodology
This research study used extensive secondary sources, directories, and databases, such as D&B Hoovers, Bloomberg Businessweek, and Factiva, to identify and collect information for a technical, market-oriented, and commercial study of the global trade surveillance system market. A few other market-related reports and analyses published by various industry associations, such as the National Security Agency (NSA) and SC Magazine, were considered while doing the extensive secondary research. The primary sources were mainly the industry experts from the core and related industries and preferred suppliers, manufacturers, distributors, service providers, technology developers, and technologists from companies and organizations related to all segments of this industry’s value chain.
In-depth interviews were conducted with primary respondents, including key industry participants, subject-matter experts, C-level executives of key market players, and industry consultants to obtain and verify critical qualitative and quantitative information and assess the prospects. The market has been estimated by analyzing various driving factors, such as improving organizational compliance requirements, enhancing operational efficiency, and simplifying workflows to eliminate bottlenecks.
Secondary Research
The market size of companies offering trade surveillance systems was derived based on secondary data available through paid and unpaid sources, analyzing the product portfolios of major companies in the ecosystem, and rating the companies based on their product capabilities and business strategies.Various sources were referenced in the secondary research process to identify and collect information for the study. These sources included annual reports, press releases, investor presentations of companies, product data sheets, white papers, journals, certified publications, and articles from recognized authors, government websites, directories, and databases.
Secondary research was mainly used to obtain key information about the industry’s supply chain, the total pool of key players, market classification and segmentation according to industry trends to the bottom-most level, regional markets, and key developments from market- and technology-oriented perspectives, all of which were further validated by primary sources.
Primary Research
In the primary research process, various sources from the supply and demand sides were interviewed to obtain qualitative and quantitative information for this report. The primary sources from the supply side included industry experts, such as chief executive officers (CEOs), vice presidents (VPs), marketing directors, technology and innovation directors, and related key executives from various key companies and organizations operating in the trade surveillance system market.
Primary interviews were conducted to gather insights, such as market statistics, the latest trends disrupting the market, new use cases implemented, data on revenue collected from products and services, market breakups, market size estimations, market forecasts, and data triangulation. Primary research also helped understand various technology-related trends, segmentation types, industry trends, and regions.
Demand-side stakeholders, such as Chief Information Officers (CIOs), Chief Technology Officers (CTOs), Chief Security Officers (CSOs), installation teams of governments and end users who utilize trade surveillance system, and digital initiatives project teams, were interviewed to understand the buyers’ perspectives on suppliers, products, service providers, and their current use of services, which would influence the overall trade surveillance system market.

Note: Tier 1 companies have revenues greater than USD 10 billion; tier 2 companies’ revenues range
between USD 1 and 10 billion; and tier 3 companies’ revenues range between USD 500 million and 1 billion.
Others include sales, marketing, and product managers.
Source: Secondary Literature, Interviews with Experts, and MarketsandMarkets Analysis
To know about the assumptions considered for the study, download the pdf brochure
Market Size Estimation
Multiple approaches were adopted to estimate and forecast the trade surveillance system market. The first approach involved estimating the market size by summing the companies’ revenue generated through the sale of services.
The research methodology used to estimate the market size included the following:
- Primary and secondary research were conducted to assess the revenue contributions of major market participants in each country, with secondary research identifying these participants.
- Critical insights were obtained by conducting in-depth interviews with industry professionals, including directors, CEOs, VPs, and marketing executives, and by reading the annual and financial reports of the top firms in the market.
- Primary sources were used to verify all percentage splits and breakups, which we calculated using secondary sources.
Trade Surveillance System Market : Top-Down and Bottom-Up Approach

Data Triangulation
Once the overall market size was determined, the market was divided into segments and subsegments using the previously described market size estimation procedures. When required, market breakdown and data triangulation procedures were used to complete the market engineering process and specify the exact figures for every market segment and subsegment. The data was triangulated by examining several variables and patterns from the government entities’ supply and demand sides.
Market Definition
Trade surveillance systems are software that prevent and investigate market abuse, market manipulation, or unethical trading practices in the securities market. Market surveillance helps organizations ensure an efficient process flow in markets, where buyers, brokers, and sellers willingly enter the market. Without using surveillance tools during market orders, the market is susceptible to abuse and manipulation, which could discourage investment and hinder economic growth.
Trade surveillance is about implementing a surveillance system that monitors and detects activities for market manipulation, fraud, behavioral patterning, and more across all asset classes and all products, thereby ensuring the prevention and investigation of abusive, manipulative, or illegal Trade surveillance, or market surveillance, involves monitoring the activities of the firm and its employees to detect illegal and unethical trading practices, including market manipulation, fraud, money laundering, insider trading, speculation, and unsuitable investments (Source: MyComplianceOffice)
Stakeholders
- Trade Surveillance Solution Providers
- Regulators
- Market Operators
- Brokers/Dealers
- Professional Service Providers
- Managed Service Providers (MSPs)
- System Integrators
- Cloud Platform Providers
- Resellers and Distributors
- Investors and Venture Capitalists
Report Objectives
- To define, describe, and forecast the trade surveillance system market based on offering, application, deployment mode, by organization size, by end user, and region
- To forecast the market size of five major regional segments: North America, Europe, Asia Pacific, the Middle East & Africa, and Latin America
- To strategically analyze the market subsegments concerning individual growth trends, prospects, and contributions to the total market
- To provide detailed information related to the major factors influencing the growth of the market (drivers, restraints, opportunities, and challenges)
- To strategically analyze macro and micro markets, considering growth trends, prospects, and their contributions to the overall market
- To analyze industry trends, patents and innovations, and pricing data related to the market
- To analyze the opportunities in the market for stakeholders and provide details of the competitive landscape for major players
- To analyze the impact of AI/generative AI on the market
- To profile key players in the market and comprehensively analyze their market share/ranking and core competencies
- To track and analyze competitive developments such as mergers & acquisitions, product launches, and partnerships & collaborations in the market
- To track and analyze competitive developments such as mergers & acquisitions, product launches, and partnerships & collaborations in the market
Available Customizations
MarketsandMarkets provides customizations based on the company’s unique requirements using market data. The following customization options are available for the report.
Product Analysis
- The product matrix provides a detailed comparison of each company’s portfolio.
Geographic Analysis as per Feasibility
- Further breakup of the trade surveillance system market
Company Information
- Detailed analysis and profiling of five additional market players
Key Questions Addressed by the Report
What is a trade surveillance system?
A trade surveillance system is a technology platform that monitors trading activity in financial markets to detect and prevent illegal, unethical, or market-manipulating behavior. It automatically analyzes large volumes of trade data in real time or after the fact, looking for patterns such as insider trading, market abuse, price manipulation, or unusual transactions. These systems help financial institutions and regulators ensure fair, transparent, and compliant markets.
What are the different types of deployment modes for a trade surveillance system?
Trade surveillance systems can be deployed through various models, including on-premises and cloud-based. On-premises deployment offers greater control over data, security, and customization, while cloud-based models provide scalability, cost-efficiency, and remote accessibility.
What are the major factors driving the growth of the trade surveillance system market?
The growth of trade surveillance systems is driven by stricter regulatory requirements, increasing market complexity, and the rise of high-frequency and digital asset trading. Advancements in AI and analytics enhance detection capabilities, while growing financial crime risks and the need for operational efficiency push firms toward automated, real-time monitoring solutions.
Which technologies are transforming the trade surveillance system market?
Technologies such as artificial intelligence (AI) and machine learning (ML) are transforming the trade surveillance system market by enhancing pattern recognition and detecting complex risks that traditional methods might miss. Blockchain improves transparency and ensures the integrity of transaction records, and natural language processing (NLP) allows analysis of unstructured data such as news and communications to uncover potential market abuse.
Who are the major end-users of this trade surveillance system?
Primary end-users include financial institutions, capital markets, and digital asset exchanges.
Need a Tailored Report?
Customize this report to your needs
Get 10% FREE Customization
Customize This ReportPersonalize This Research
- Triangulate with your Own Data
- Get Data as per your Format and Definition
- Gain a Deeper Dive on a Specific Application, Geography, Customer or Competitor
- Any level of Personalization
Let Us Help You
- What are the Known and Unknown Adjacencies Impacting the Trade Surveillance System Market
- What will your New Revenue Sources be?
- Who will be your Top Customer; what will make them switch?
- Defend your Market Share or Win Competitors
- Get a Scorecard for Target Partners

Custom Market Research Services
We Will Customise The Research For You, In Case The Report Listed Above Does Not Meet With Your Requirements
Get 10% Free CustomisationTESTIMONIALS


Growth opportunities and latent adjacency in Trade Surveillance System Market