The study utilized four major activities to estimate the underfloor heating market size. Exhaustive secondary research was conducted to gather information on the market and its peer and parent markets. The next step was to validate these findings, assumptions, and sizing with industry experts across the value chain through primary research. Both top-down and bottom-up approaches were employed to estimate the total market size. Finally, market breakdown and data triangulation methods were utilized to estimate the market size for different segments and subsegments.
Secondary Research
In the secondary research process, various sources were used to identify and collect information on the underfloor heating market for this study. Secondary sources for this research study include corporate filings (such as annual reports, investor presentations, and financial statements), trade, business, and professional associations, white papers, certified publications, articles by recognized authors, directories, and databases. The secondary data was collected and analyzed to determine the overall market size, further validated through primary research.
List of key secondary sources
|
SOURCE
|
Web Link
|
|
American Society of Heating, Refrigerating, and Air-Conditioning Engineers (ASHRAE)
|
https://www.ashrae.org/
|
|
Air Conditioning Contractors of America (ACCA)
|
https://www.acca.org/
|
|
Air Conditioning, Heating, and Refrigeration Institute (AHRI)
|
https://www.ahrinet.org/
|
|
The American National Standards Institute
|
www.ansi.org
|
|
National Fire Protection Association
|
www.nfpa.org
|
|
National Institute of Standards and Technology
|
www.nist.gov
|
|
Asia Industrial Gases Association
|
www.asiaiga.org
|
Primary Research
Primary interviews were conducted to gather insights on market statistics, revenue data, market breakdowns, size estimations, and forecasting. Additionally, primary research was used to comprehend the various technology, type, end-use, and regional trends. Interviews with stakeholders from the demand side, including CIOs, CTOs, CSOs, and customer/end-user installation teams using underfloor heating offerings and processes, were also conducted to understand their perspective on suppliers, products, component providers, and their current and future use of underfloor heating, which will impact the overall market. Several primary interviews were conducted across major countries in North America, Europe, Asia Pacific.

To know about the assumptions considered for the study, download the pdf brochure
Market Size Estimation
Both top-down and bottom-up approaches were utilized to estimate and validate the size of the underfloor heating market and its submarkets. Secondary research was conducted to identify the key players in the market, and primary and secondary research was used to determine their market share in specific regions. The process involved studying top players’ annual and financial reports and conducting extensive interviews with industry leaders such as CEOs, VPs, directors, and marketing executives. Secondary sources were used to determine all percentage shares and breakdowns, verified through primary sources. All parameters that could impact the markets covered in this research study were accounted for, analyzed in detail, verified through primary research, and consolidated to obtain the final quantitative and qualitative data.
Global Underfloor heating Market Size: Botton Up Approach
-
Identifying end users that are either using or will use underfloor heating.
-
Tracking leading companies and system integrators operating across various industries.
-
Deriving the size of the underfloor heating by type market through the data sanity method; analyzing revenues of more than 25 critical providers through their annual reports and press releases and summing them up to estimate the overall market size.
-
Analyzing the use cases across different regions and companies
-
Tracking the ongoing and upcoming installation contracts, acquisitions, expansions, and product launches by various companies and forecasting the market size based on these developments and other critical parameters.
-
Conduct multiple discussions with key opinion leaders to understand underfloor heating components offered by companies to various applications and analyze the breakdown of the scope of work carried out by each major company providing underfloor heating components.
-
Carrying out the market trend analysis to obtain the CAGR of the underfloor heating with respect to their types in the said market by understanding the industry penetration rate and analyzing the demand and supply of systems for different applications.
-
Assigning a percentage to the overall revenue or, in a few cases, to each company's segmental revenues to derive their revenues from the sale of underfloor heating. This percentage for each company has been assigned based on their product portfolios.
-
Verifying and crosschecking the estimates at every level through discussions with key opinion leaders, including CEOs, directors, operations managers, and domain experts at MarketsandMarkets
-
Studying various paid and unpaid information sources, such as annual reports, press releases, and white papers

Global Underfloor heating Market Size: Top-Down Approach
The top-down approach has been used to estimate and validate the total size of the underfloor heating market.
-
Information related to the revenue of key manufacturers and providers of Underfloor heating components was studied and analyzed to estimate the global size of the market.
-
Multiple discussions were conducted with key opinion leaders to understand the demand for underfloor heating solutions and analyze the breakdown of the scope of work carried out by each significant company.
-
Revenue, geographic presence, critical applications served, and diverse offerings of all identified players in the Underfloor heating market were studied to estimate and arrive at the percentage split of different market segments.
-
All major players in the market were identified through secondary research and verified through brief discussions with industry experts.
-
Multiple discussions were conducted with key opinion leaders of all key companies developing Underfloor heating solutions to validate the market split based on type, application, and region.
-
Geographic splits were estimated using secondary sources based on factors such as the number of players offering underfloor heating solutions in a specific country or region and the industries for which these players provide the solutions.

Data Triangulation
Once the overall size of the underfloor heating market was determined using the methods described above, it was divided into multiple segments and subsegments. Market engineering was performed for each segment and subsegment using market breakdown and data triangulation methods, as applicable, to obtain accurate statistics. Various factors and trends from the demand and supply sides were studied to triangulate the data. The market was validated using both top-down and bottom-up approaches.
Market Definition
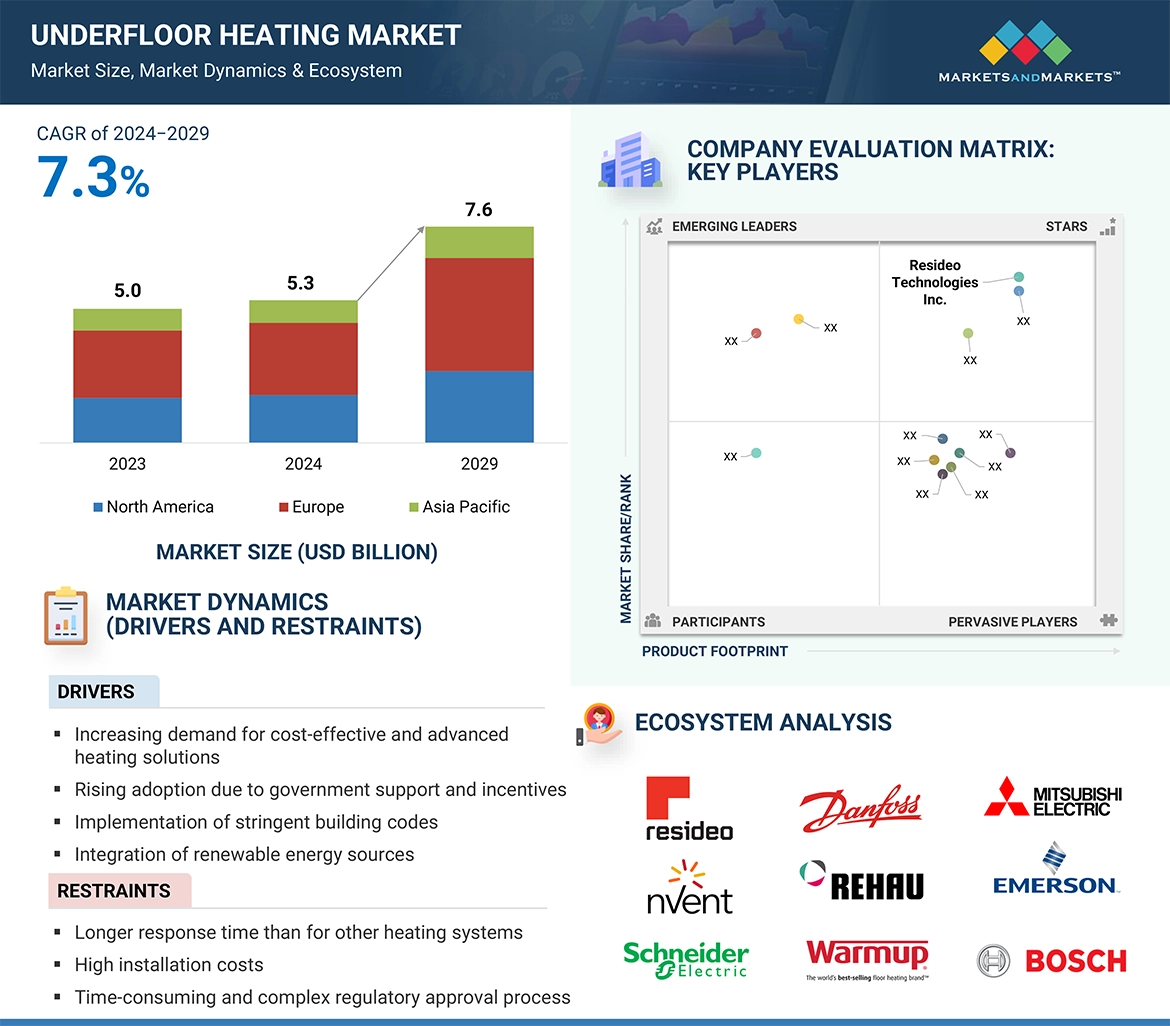
Basically, an underfloor heating system is usually a central system in controlling the indoor climate for the means of thermal comfort by using conduction, radiation, and convection. Underfloor heating systems included hydronic and electric underfloor heating systems in the market. The hydronic UFH systems rely on hot water for in-floor heating, while electric UFH systems depend on electricity for their operations. Underfloor heating systems have numerous advantages over radiator heating systems and have become a viable method of space heating.
Key Stakeholders
-
Original equipment manufacturers (OEMs)
-
Providers of technology solutions
-
Research institutes
-
Market research and consulting firms
-
Forums, alliances, and associations related to Underfloor heating
-
Technology investors
-
Governments and financial institutions
-
Analysts and strategic business planners
-
Existing end users and prospective ones
Report Objectives
-
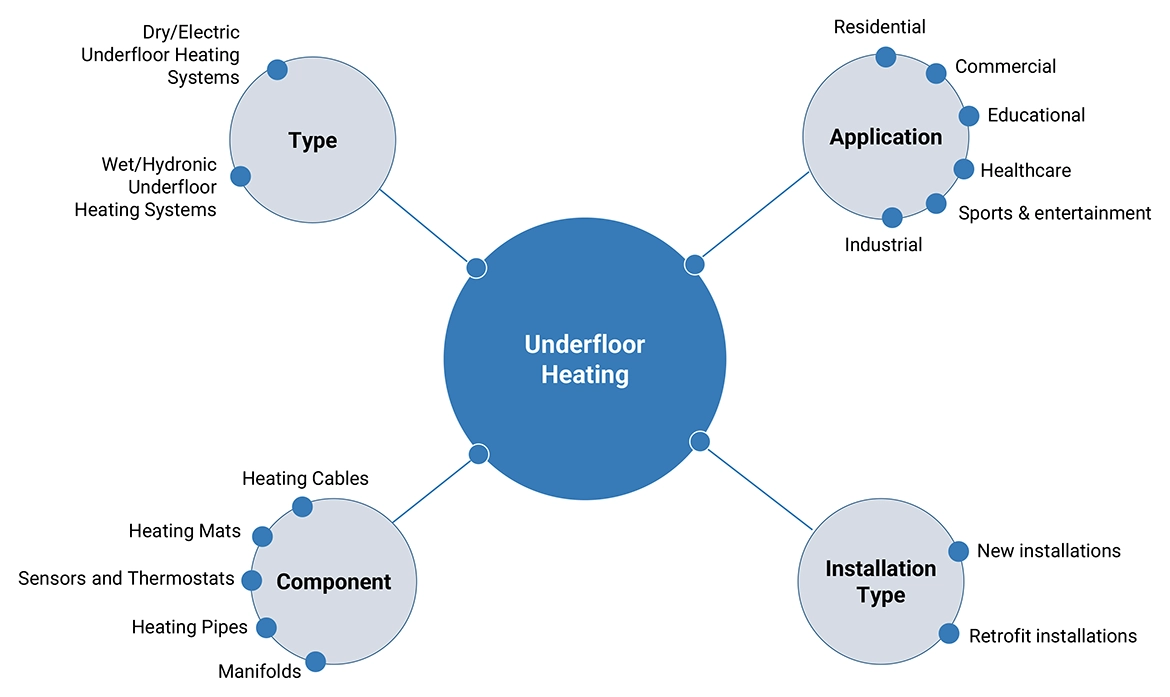
To define, describe, and forecast the underfloor heating market based on type, offering, installation type & application, and region
-
To forecast the size of the market segments for four major regions—North America, Europe, Asia Pacific (APAC)
-
To provide detailed information regarding the major factors influencing the growth of the market (drivers, restraints, opportunities, and challenges)
-
To strategically analyze micromarkets1 with respect to individual growth trends, prospects, and contributions to the total market
-
To study the complete value chain and allied industry segments and perform a market value chain analysis.
-
To provide ecosystem analysis, case study analysis, patent analysis, technology analysis, pricing analysis, Porter’s five forces analysis, key stakeholders and buying criteria, key conferences and events, and regulatory bodies, government agencies, and regulations pertaining to the market
-
To strategically profile the key players and comprehensively analyze their market shares and core competencies2.
-
Analyzing the opportunities in the market for stakeholders and describing the market's competitive landscape.
-
To analyze competitive developments such as collaborations, agreements, contracts, partnerships, mergers & acquisitions, product launches, and research & development (R&D) in the market
Available customizations:
With the given market data, MarketsandMarkets offers customizations according to the specific requirements of companies. The following customization options are available for the report:
-
Detailed analysis and profiling of additional market players (up to 5)
-
Additional country-level analysis of the underfloor heating market
Product Analysis
-
The product matrix provides a detailed comparison of the product portfolio of each company in the underfloor heating market.


Growth opportunities and latent adjacency in Underfloor Heating Market