Ultraviolet Visible Spectroscopy Market Growth

Ultraviolet Visible Spectroscopy Market by Offering (Instrument (Array, Single & Dual Beam), Software), Application (Environment. Air, Water, Soil), End User (Industry (F&B, Pharma, Biotech, Cosmetics. Chemicals), Labs) - Global Forecast to 2029

Report Code: AST 4640 Aug, 2024, by marketsandmarkets.com

Updated on : September 24, 2024

Overview of the Ultraviolet Visible Spectroscopy Market

Ultraviolet visible spectroscopy market growth forecasted to transform from USD 1.3 billion in 2024 to USD 1.7 billion by 2029, driven by a CAGR of 4.9%. Growth in this market can be attributed to rising concerns about meeting environmental regulations regarding wastewater monitoring and treatment. Strict quality control mandates in food and drug production help boost the adoption of UV/Visible spectrophotometers for quantitative measurements. These factors help to increase the demand for these instruments, which, in turn, boosts overall market growth. Growth can also be attributed to the growing adoption of UV/Visible spectrophotometers as a cost-effective instrument for routine quantitative analysis in research institutes and industries.

Ultraviolet Visible Spectroscopy Market Trends

UV/Visible Spectroscopy Market

To know about the assumptions considered for the study, Request for Free Sample Report

UV/Visible Spectroscopy Market

e- Estimated; p- Projected

Ultraviolet Visible Spectroscopy Market Dynamics

Driver: Rising adoption of UV/Visible spectrophotometers in environmental screening

Governments are increasingly becoming more proactive in monitoring and screening the environment, particularly when treating industrial wastewater. UV/visible spectrophotometers are widely used as analytical instruments in these applications, creating lucrative opportunities for market participants. Some manufacturers offer handheld and benchtop UV/Visible spectrophotometers that can be used directly in the field for water testing. These factors contribute to the growth of the market.

Restraint: Time-consuming sample preparation workflow reduces the use of techniques

Some analytes are not very soluble in standard solvents. This means that specialized solvents may be required, which can be expensive or difficult to work with. This is a limitation of UV/Visible spectroscopy. Due to these factors, selecting the ideal solvent for the analyte may take more time. These considerations could impact the usefulness of the instrument, especially considering time constraints.

Opportunity: Stringent environmental regulations could offer lucrative opportunities in water treatment analysis and monitoring

Upcoming opportunities or small disruptions could be observed in the near future from the environmental testing and monitoring segment as governments around the globe are more serious about climate change. These opportunities may arise due to increasing concerns about meeting environmental regulations related to wastewater monitoring and treatment in the industrial sector. UV/Visible spectrophotometers are used to evaluate parameters like ZLD (Zero Liquid Discharge) in wastewater and sludge treatment in industries. The demand for portable systems is also expected to rise due to the growing need for on-site analysis in areas such as rivers and water bodies. Such trends could lead to the adoption of UV/Visible spectrophotometers due to their cost-effective pricing.

Challenge: Higher chance of errors in results due to inexperienced operators

Organizations must operate UV/Visible spectrophotometers efficiently and with minimal errors. However, technical gaps in industry and academia can lead to inefficiencies in handling instruments, particularly in developing nations, resulting in common errors. This can ultimately hinder market growth over time. To address this, standard operating workshops could be implemented to provide real-time simulations for inexperienced operators.

Ultraviolet Visible Spectroscopy Market Ecosystem/Map

UV/Visible Spectroscopy Market Ecosystem

By offering, the dual-beam systems segment accounted for the largest share of the ultraviolet visible spectroscopy industry in 2023.

Dual-beam systems are widely used in various industrial operations, such as food & beverage, cosmetic production, and pharmaceuticals. They are in significant demand from the industrial segment due to their lower error rate and low stray light interference over a longer period. This results in lower costs associated with each sample, which makes these systems more efficient. Additionally, these systems are a popular choice for research institutes. These factors contribute to a significant demand for dual-beam systems, which will drive market growth in the coming years.

By application, industrial applications held the largest share of the ultraviolet visible spectroscopy industry in 2023.

UV/Visible spectrophotometers are cost-effective instruments, making them a prime choice for industries, academic institutes, and research institutes. These instruments are preferred because they provide acceptable results at lower operating costs. These instruments find application in drug profiling, diffuse reflectance measurement for food additives, transmittance measurement for quartz plates, and haze measurement for plastics. All these application areas in different industrial setups help to increase the demand for UV/Visible spectrophotometers.

By region, North America is expected to be the largest market for the ultraviolet visible spectroscopy industry during the forecast period.

The ultraviolet visible spectroscopy market includes the following regions: North America, Europe, Asia Pacific, Latin America, and the Middle East & Africa. Currently, North America dominates the UV/Visible spectroscopy market. The US National Science Foundation (NSF) has been allocating considerable funding and investments towards analytical instruments for life science, engineering, and physical science research. This trend benefits manufacturers of UV/Visible spectrophotometers and has contributed to the growth of the UV/Visible spectroscopy market in this region.

UV/Visible Spectroscopy Market by Region

To know about the assumptions considered for the study, download the pdf brochure

As of 2023, the major players that operate in the ultraviolet visible spectroscopy market are Agilent Technologies, Inc. (US), Shimadzu Corporation (Japan), PerkinElmer (US), Thermo Fisher Scientific (US), Veralto Corporation (US), JASCO (Japan), Mettler Toledo (US), Hitachi High-Tech Corporation (Japan), Oxford Instruments Plc (UK), Bruker Corporation (US), Hamamatsu Photonics K.K. (Japan), Harvard Bioscience, Inc. (US), and Xylem, Inc. (US).

Scope of the Ultraviolet Visible Spectroscopy Industry:

Report Metric

Details

Market Revenue in 2024

$1.3 billion

Projected Revenue by 2029

$1.7 billion

Revenue Rate

Poised to Grow at a CAGR of 4.9%

Market Driver

Rising adoption of UV/Visible spectrophotometers in environmental screening

Market Opportunity

Stringent environmental regulations could offer lucrative opportunities in water treatment analysis and monitoring

This report has categorized the ultraviolet visible spectroscopy market to forecast revenue and analyze trends in each of the following submarkets

By Type
  • Instruments
    • Single–beam systems
    • Dual–beam systems
    • Array–based systems
    • Handheld systems
  • Software & Services
  • Accessories
By Application
  • Industrial applications
    • Pharma–Biopharma Manufacturing
    • Food & beverage applications
    • Cosmetic applications
    • Chemical and petrochemical applications
    • Pharmaceutical applications
    • Agricultural applications
    • Textile applications
    • Automotive applications
  • Academic applications
    • Life science studies
    • Material science studies
    • Analytical and physical chemistry studies
    • Environmental and ecological studies
    • Geological studies
  • Environmental applications
    • Air quality testing
    • Water quality testing
    • Soil quality testing
  • Diagnostic and pathology testing
By End Users
  • Industries
    • Food and beverage industry
    • Biotechnology and pharmaceutical industry
    • Chemical and petrochemical industry
    • Textile industry
    • Agricultural industry
    • Other industries (automotive & materials industry and oil & gas industry)
  • Pathological and Diagnostic labs
  • Academic and research institutes
  • Others (hospitals, diagnostic centers, blood banks, and forensic labs)
By Region
  • North America
    • US
    • Canada
  • Europe
    • Germany
    • France
    • UK
    • Spain
    • Italy
    • Rest of Europe
  • Asia Pacific
    • China
    • Japan
    • India
    • Australia
    • South Korea
    • Rest of Asia Pacific
  • Latin America
    • Brazil
    • Mexico
    • Rest of Latin America
  • Middle East and Africa
    • GCC Countries

Recent Developments of Ultraviolet Visible Spectroscopy Industry

  • In April 2023, Shimadzu Corporation launched UV-2600i, a UV/Visible spectrophotometer designed to determine the Tm value for samples, which is a thermal stability index used in various research, industrial, and pharmaceutical applications.
  • In December 2021, Agilent Technologies Inc. launched the Cary 3500 UV–VIS Series. This new series of UV/Visible spectrophotometers shows compatibility with OpenLab software.

Frequently Asked Questions (FAQ):

To speak to our analyst for a discussion on the above findings, click Speak to Analyst

TABLE OF CONTENTS
 
1 INTRODUCTION (Page No. - 25)
    1.1 STUDY OBJECTIVES 
    1.2 MARKET DEFINITION 
           1.2.1 INCLUSIONS & EXCLUSIONS
    1.3 STUDY SCOPE 
           1.3.1 SEGMENTS COVERED
           1.3.2 YEARS CONSIDERED
           1.3.3 CURRENCY CONSIDERED
    1.4 STAKEHOLDERS 
    1.5 SUMMARY OF CHANGES 
 
2 RESEARCH METHODOLOGY (Page No. - 30)
    2.1 RESEARCH DATA SOURCES 
           2.1.1 SECONDARY RESEARCH
           2.1.2 PRIMARY RESEARCH
                    2.1.2.1 Primary sources
                    2.1.2.2 Breakdown of primaries
    2.2 MARKET SIZE ESTIMATION METHODOLOGY 
           2.2.1 BOTTOM-UP APPROACH
                    2.2.1.1 Approach 1: Company revenue estimation approach
                    2.2.1.2 Approach 2: Customer-based market estimation
    2.3 MARKET FORECASTING METHODOLOGY 
    2.4 DATA TRIANGULATION APPROACH 
    2.5 RESEARCH ASSUMPTIONS 
    2.6 RESEARCH LIMITATIONS 
    2.7 RISK ASSESSMENT 
           2.7.1 RISK ASSESSMENT & ANALYSIS
 
3 EXECUTIVE SUMMARY (Page No. - 41)
 
4 PREMIUM INSIGHTS (Page No. - 45)
    4.1 UV/VISIBLE SPECTROSCOPY MARKET OVERVIEW 
    4.2 UV/VISIBLE SPECTROSCOPY INSTRUMENTS MARKET, BY TYPE (2024 VS. 2029) 
    4.3 ASIA PACIFIC: UV/VISIBLE SPECTROSCOPY MARKET, BY END USER (2023) 
    4.4 UV/VISIBLE SPECTROSCOPY MARKET, BY APPLICATION (2024 VS. 2029) 
    4.5 UV/VISIBLE SPECTROSCOPY MARKET: GEOGRAPHIC GROWTH OPPORTUNITIES (2024–2029) 
 
5 MARKET OVERVIEW (Page No. - 49)
    5.1 INTRODUCTION 
    5.2 MARKET DYNAMICS 
           5.2.1 DRIVERS
                    5.2.1.1 Growing applications of UV/Vis spectroscopy in environmental screening
                    5.2.1.2 Growing use of UV/Vis spectroscopy in pharmaceutical and biotechnology industries
                    5.2.1.3 Technological advancements
                    5.2.1.4 Increasing need for food analysis
           5.2.2 RESTRAINTS
                    5.2.2.1 Time-consuming sample preparation due to limited solvent–analyte compatibility
                    5.2.2.2 Need for periodic subscription of spectroscopic software
           5.2.3 OPPORTUNITIES
                    5.2.3.1 Stringent pollution control regulations in environmental monitoring
                    5.2.3.2 Growth opportunities in emerging markets
                    5.2.3.3 Increasing utilization of UV/Vis spectroscopy in material science, energy sector, and environmental monitoring
           5.2.4 CHALLENGES
                    5.2.4.1 High error rates due to inexperienced operators
    5.3 REGULATORY ANALYSIS 
           5.3.1 REGULATORY LANDSCAPE
                    5.3.1.1 North America
                               5.3.1.1.1 US
                               5.3.1.1.2 Canada
                    5.3.1.2 Europe
                    5.3.1.3 Asia Pacific
                               5.3.1.3.1 Japan
                               5.3.1.3.2 China
                               5.3.1.3.3 India
           5.3.2 KEY REGULATORY BODIES, GOVERNMENT AGENCIES, AND OTHER ORGANIZATIONS
                    5.3.2.1 North America
                    5.3.2.2 Europe
                    5.3.2.3 Asia Pacific
                    5.3.2.4 Latin America
                    5.3.2.5 Middle East & Africa
    5.4 VALUE CHAIN ANALYSIS 
           5.4.1 RESEARCH & DEVELOPMENT
           5.4.2 RAW MATERIAL PROCUREMENT & PRODUCT DEVELOPMENT
           5.4.3 MARKETING, SALES, AND DISTRIBUTION
    5.5 SUPPLY CHAIN ANALYSIS 
           5.5.1 PROMINENT COMPANIES
           5.5.2 SMALL AND MEDIUM-SIZED ENTERPRISES
           5.5.3 END USERS
    5.6 ECOSYSTEM ANALYSIS 
    5.7 TRADE ANALYSIS 
           5.7.1 IMPORT DATA FOR UV/VISIBLE SPECTROPHOTOMETERS (HS CODE 902730)
           5.7.2 EXPORT DATA FOR UV/VISIBLE SPECTROPHOTOMETERS (HS CODE 902730)
    5.8 PATENT ANALYSIS 
    5.9 PRICING ANALYSIS 
    5.10 TECHNOLOGY ANALYSIS 
           5.10.1 KEY TECHNOLOGIES
                    5.10.1.1 Single-beam UV/Visible spectrophotometers
                    5.10.1.2 Dual-beam UV/Visible spectrophotometers
                    5.10.1.3 Array-based UV/Visible spectrophotometers
                    5.10.1.4 Handheld UV/Visible spectrophotometers
           5.10.2 COMPLEMENTARY TECHNOLOGIES
                    5.10.2.1 Inline flow cells
                    5.10.2.2 Autosamplers
           5.10.3 ADJACENT TECHNOLOGIES
                    5.10.3.1 Multivariate optical computing
                    5.10.3.2 Advanced sensor technologies
    5.11 PORTER’S FIVE FORCE ANALYSIS 
           5.11.1 THREAT OF NEW ENTRANTS
           5.11.2 THREAT OF SUBSTITUTES
           5.11.3 BARGAINING POWER OF SUPPLIERS
           5.11.4 BARGAINING POWER OF BUYERS
           5.11.5 INTENSITY OF COMPETITIVE RIVALRY
    5.12 KEY CONFERENCES & EVENTS IN 2024–2025 
    5.13 TRENDS/DISRUPTIONS IMPACTING CUSTOMERS’ BUSINESSES 
    5.14 INVESTMENT & FUNDING SCENARIO 
    5.15 KEY STAKEHOLDERS & BUYING CRITERIA 
           5.15.1 KEY STAKEHOLDERS IN BUYING PROCESS
           5.15.2 KEY BUYING CRITERIA
    5.16 UNMET NEEDS 
    5.17 IMPACT OF GENERATIVE AI ON UV/VISIBLE SPECTROSCOPY MARKET 
 
6 UV/VISIBLE SPECTROSCOPY MARKET, BY OFFERING (Page No. - 89)
    6.1 INTRODUCTION 
    6.2 INSTRUMENTS 
           6.2.1 SINGLE-BEAM SYSTEMS
                    6.2.1.1 Greater affordability of single-beam systems compared to other systems to boost adoption
           6.2.2 DUAL-BEAM SYSTEMS
                    6.2.2.1 Ease of use, precision, and cost to drive demand for dual-beam systems
           6.2.3 ARRAY-BASED SYSTEMS
                    6.2.3.1 Rising pharmaceutical & biotechnology R&D to drive market growth
           6.2.4 HANDHELD SYSTEMS
                    6.2.4.1 Growing demand for inline and spot-based quality control in industries to drive market for handheld systems
    6.3 SOFTWARE & SERVICES 
           6.3.1 GROWING NEED FOR SOFTWARE TO ADDRESS DATA PROCESSING REQUIREMENTS TO DRIVE GROWTH
    6.4 ACCESSORIES 
           6.4.1 NEED FOR BETTER INSTRUMENT FUNCTIONALITY AND PERFORMANCE TO FUEL MARKET GROWTH
 
7 UV/VISIBLE SPECTROSCOPY MARKET, BY APPLICATION (Page No. - 98)
    7.1 INTRODUCTION 
    7.2 INDUSTRIAL APPLICATIONS 
           7.2.1 FOOD & BEVERAGE APPLICATIONS
                    7.2.1.1 Growing importance of quality control in food manufacturing to increase adoption
           7.2.2 COSMETIC APPLICATIONS
                    7.2.2.1 Increasing demand for cosmetics due to rise in disposable income to boost demand
           7.2.3 CHEMICAL & PETROCHEMICAL APPLICATIONS
                    7.2.3.1 Growing demand for analytical instruments in petrochemical industry to favor market growth
           7.2.4 PHARMACEUTICAL APPLICATIONS
                    7.2.4.1 Growth of pharmaceutical sector to boost demand for UV/Visible spectrophotometers in drug manufacturing
           7.2.5 AGRICULTURAL APPLICATIONS
                    7.2.5.1 Rising trend of contract farming to drive future demand for UV/Visible spectroscopy in soil analysis
           7.2.6 TEXTILE APPLICATIONS
                    7.2.6.1 Shift to sustainable fibers to drive market growth
           7.2.7 AUTOMOTIVE APPLICATIONS
                    7.2.7.1 Rising automotive production and middle-class growth to fuel demand for UV/Visible spectrophotometers
    7.3 ACADEMIC APPLICATIONS 
           7.3.1 LIFE SCIENCE STUDIES
                    7.3.1.1 Government research grants to boost demand for UV/Visible spectrophotometers in life sciences
           7.3.2 MATERIAL SCIENCE STUDIES
                    7.3.2.1 Advancing material science research to spur demand for UV/Visible spectrophotometers
           7.3.3 ANALYTICAL & PHYSICAL CHEMISTRY STUDIES
                    7.3.3.1 Growing and sustainable research conditions in chemistry to propel market growth
           7.3.4 ENVIRONMENTAL & ECOLOGICAL STUDIES
                    7.3.4.1 Rising concerns about climate change and strict environmental regulations to increase adoption
           7.3.5 GEOLOGICAL STUDIES
                    7.3.5.1 Limited but essential position of UV/Visible spectroscopy in geological studies and mining exploration to drive growth
    7.4 ENVIRONMENTAL APPLICATIONS 
           7.4.1 AIR QUALITY TESTING
                    7.4.1.1 Growing testing methodologies in air monitoring to drive market for UV/Visible spectroscopy
           7.4.2 WATER QUALITY TESTING
                    7.4.2.1 Aggressive water treatment regulations to generate need for UV/Visible spectrophotometers
           7.4.3 SOIL QUALITY TESTING
                    7.4.3.1 Diverse applications of UV/Visible spectrophotometers in soil testing to propel market
    7.5 DIAGNOSTIC & PATHOLOGY TESTING 
           7.5.1 NEED FOR ROUTINE DIAGNOSTIC TESTING TO FUEL MARKET GROWTH
 
8 UV/VISIBLE SPECTROSCOPY MARKET, BY END USER (Page No. - 115)
    8.1 INTRODUCTION 
    8.2 INDUSTRIES 
           8.2.1 FOOD & BEVERAGE INDUSTRY
                    8.2.1.1 Growing stringency of quality control standards in food & beverage industry to drive growth
           8.2.2 BIOTECHNOLOGY & PHARMACEUTICAL INDUSTRY
                    8.2.2.1 Growth of biopharmaceutical sector to boost demand for UV/Visible spectroscopy
           8.2.3 CHEMICAL & PETROCHEMICAL INDUSTRY
                    8.2.3.1 Stable growth in petrochemical & chemical sector to generate major demand for UV/Visible spectrophotometers
           8.2.4 TEXTILE INDUSTRY
                    8.2.4.1 Constant increase in textile and yarn production to drive market growth
           8.2.5 AGRICULTURAL INDUSTRY
                    8.2.5.1 Shift from conventional to contract farming to increase demand for analytical instruments
           8.2.6 OTHER INDUSTRIES
    8.3 PATHOLOGY & DIAGNOSTIC LABS 
           8.3.1 HIGHER REPLACEMENT RATES AND POST-SALES SERVICES DEMAND FROM LABS TO SUPPORT MARKET GROWTH
    8.4 ACADEMIC & RESEARCH INSTITUTES 
           8.4.1 FAVORABLE TAX AND PURCHASING POLICIES AND LARGE RESEARCH BUDGETS TO FAVOR MARKET GROWTH
    8.5 OTHER END USERS 
 
9 UV/VISIBLE SPECTROSCOPY MARKET, BY REGION (Page No. - 124)
    9.1 INTRODUCTION 
    9.2 NORTH AMERICA 
           9.2.1 MACROECONOMIC OUTLOOK FOR NORTH AMERICA
           9.2.2 US
                    9.2.2.1 US to dominate North American UV/Visible spectroscopy market during forecast period
           9.2.3 CANADA
                    9.2.3.1 Increasing R&D funds and grants to drive market growth
    9.3 EUROPE 
           9.3.1 MACROECONOMIC OUTLOOK FOR EUROPE
           9.3.2 GERMANY
                    9.3.2.1 Strong R&D investments and healthcare expenditure to propel market growth
           9.3.3 UK
                    9.3.3.1 Favorable government initiatives and technological advancements to spur market growth
           9.3.4 FRANCE
                    9.3.4.1 Growing biotechnology industry to drive market in France
           9.3.5 ITALY
                    9.3.5.1 Well-established analytical instrument network and favorable government initiatives to fuel market growth
           9.3.6 SPAIN
                    9.3.6.1 Increased government budget for R&D in healthcare and life science to augment market growth
           9.3.7 REST OF EUROPE
    9.4 ASIA PACIFIC 
           9.4.1 MACROECONOMIC OUTLOOK FOR ASIA PACIFIC
           9.4.2 JAPAN
                    9.4.2.1 Strong research network and increasing exports of UV/Visible spectroscopy products to support market growth
           9.4.3 CHINA
                    9.4.3.1 Environmental testing and government initiatives to propel growth
           9.4.4 INDIA
                    9.4.4.1 Significant growth in biotechnology and pharmaceutical industry to drive demand for UV/Visible spectrophotometers
           9.4.5 AUSTRALIA
                    9.4.5.1 Rising concerns for environmental monitoring and testing to drive growth
           9.4.6 SOUTH KOREA
                    9.4.6.1 High spending on research activities to support market growth
           9.4.7 REST OF ASIA PACIFIC
    9.5 LATIN AMERICA 
           9.5.1 MACROECONOMIC OUTLOOK FOR LATIN AMERICA
           9.5.2 BRAZIL
                    9.5.2.1 Favorable research policies and presence of several national institutes to drive market
           9.5.3 MEXICO
                    9.5.3.1 Increasing R&D investments along with favorable free trade agreements to aid market growth
           9.5.4 REST OF LATIN AMERICA
    9.6 MIDDLE EAST & AFRICA 
           9.6.1 MACROECONOMIC OUTLOOK FOR MIDDLE EAST & AFRICA
           9.6.2 GCC COUNTRIES
                    9.6.2.1 Developments in healthcare infrastructure and high government expenditure to drive market
           9.6.3 REST OF MIDDLE EAST & AFRICA
 
10 COMPETITIVE LANDSCAPE (Page No. - 172)
     10.1 OVERVIEW 
     10.2 KEY PLAYER STRATEGY/RIGHT TO WIN 
             10.2.1 OVERVIEW OF STRATEGIES ADOPTED BY PLAYERS IN UV/VISIBLE SPECTROSCOPY MARKET
     10.3 REVENUE ANALYSIS 
             10.3.1 RANKING OF KEY MARKET PLAYERS
     10.4 COMPANY EVALUATION MATRIX: KEY PLAYERS, 2023 
             10.4.1 STARS
             10.4.2 EMERGING LEADERS
             10.4.3 PERVASIVE PLAYERS
             10.4.4 PARTICIPANTS
             10.4.5 COMPANY FOOTPRINT: KEY PLAYERS, 2023
                        10.4.5.1 Company footprint
                        10.4.5.2 Offering footprint
                        10.4.5.3 Application footprint
                        10.4.5.4 End-user footprint
                        10.4.5.5 Region footprint
     10.5 COMPANY EVALUATION MATRIX: STARTUPS/SMES, 2023 
             10.5.1 PROGRESSIVE COMPANIES
             10.5.2 RESPONSIVE COMPANIES
             10.5.3 DYNAMIC COMPANIES
             10.5.4 STARTING BLOCKS
             10.5.5 COMPETITIVE BENCHMARKING: STARTUPS/SMES, 2023
     10.6 COMPANY VALUATION & FINANCIAL METRICS 
             10.6.1 FINANCIAL METRICS
             10.6.2 COMPANY VALUATION
     10.7 BRAND/PRODUCT COMPARISON 
     10.8 COMPETITIVE SCENARIO 
             10.8.1 PRODUCT LAUNCHES
             10.8.2 DEALS
             10.8.3 EXPANSIONS
 
11 COMPANY PROFILES (Page No. - 194)
     11.1 KEY PLAYERS 
             11.1.1 AGILENT TECHNOLOGIES, INC.
                        11.1.1.1 Business overview
                        11.1.1.2 Products offered
                        11.1.1.3 Recent developments
                                     11.1.1.3.1 Product launches
                                     11.1.1.3.2 Deals
                                     11.1.1.3.3 Expansions
                        11.1.1.4 MnM view
                                     11.1.1.4.1 Right to win
                                     11.1.1.4.2 Strategic choices
                                     11.1.1.4.3 Weaknesses & competitive threats
             11.1.2 PERKINELMER, INC.
                        11.1.2.1 Business overview
                        11.1.2.2 Products offered
                        11.1.2.3 MnM view
                                     11.1.2.3.1 Right to win
                                     11.1.2.3.2 Strategic choices
                                     11.1.2.3.3 Weaknesses & competitive threats
             11.1.3 THERMO FISHER SCIENTIFIC INC.
                        11.1.3.1 Business overview
                        11.1.3.2 Products offered
                        11.1.3.3 Recent developments
                                     11.1.3.3.1 Product launches
                                     11.1.3.3.2 Deals
                        11.1.3.4 MnM view
                                     11.1.3.4.1 Key strengths
                                     11.1.3.4.2 Strategic choices
                                     11.1.3.4.3 Weaknesses & competitive threats
             11.1.4 VERALTO CORPORATION
                        11.1.4.1 Business overview
                        11.1.4.2 Products offered
                        11.1.4.3 Recent developments
                                     11.1.4.3.1 Deals
                        11.1.4.4 MnM view
                                     11.1.4.4.1 Right to win
                                     11.1.4.4.2 Strategic choices
                                     11.1.4.4.3 Weaknesses & competitive threats
             11.1.5 SHIMADZU CORPORATION
                        11.1.5.1 Business overview
                        11.1.5.2 Products offered
                        11.1.5.3 Recent developments
                                     11.1.5.3.1 Product launches
                                     11.1.5.3.2 Expansions
                        11.1.5.4 MnM view
                                     11.1.5.4.1 Right to win
                                     11.1.5.4.2 Strategic choices
                                     11.1.5.4.3 Weaknesses & competitive threats
             11.1.6 JASCO
                        11.1.6.1 Business overview
                        11.1.6.2 Products offered
                        11.1.6.3 Recent developments
                                     11.1.6.3.1 Product launches
                                     11.1.6.3.2 Deals
             11.1.7 METTLER TOLEDO
                        11.1.7.1 Business overview
                        11.1.7.2 Products offered
                        11.1.7.3 Recent developments
                                     11.1.7.3.1 Product launches
             11.1.8 HITACHI HIGH-TECH CORPORATION
                        11.1.8.1 Business overview
                        11.1.8.2 Products offered
                        11.1.8.3 Recent developments
                                     11.1.8.3.1 Other developments
             11.1.9 OXFORD INSTRUMENTS PLC
                        11.1.9.1 Business overview
                        11.1.9.2 Products offered
                        11.1.9.3 Recent developments
                                     11.1.9.3.1 Expansions
             11.1.10 BRUKER CORPORATION
                        11.1.10.1 Business overview
                        11.1.10.2 Products offered
                        11.1.10.3 Recent developments
                                     11.1.10.3.1 Product launches
             11.1.11 HORIBA LTD.
                        11.1.11.1 Business overview
                        11.1.11.2 Products offered
                        11.1.11.3 Recent developments
                                     11.1.11.3.1 Deals
             11.1.12 HAMAMATSU PHOTONICS K.K.
                        11.1.12.1 Business overview
                        11.1.12.2 Products offered
                        11.1.12.3 Recent developments
                                     11.1.12.3.1 Product launches
                                     11.1.12.3.2 Expansions
             11.1.13 HARVARD BIOSCIENCE, INC.
                        11.1.13.1 Business overview
                        11.1.13.2 Products offered
             11.1.14 XYLEM INC.
                        11.1.14.1 Business overview
                        11.1.14.2 Products offered
     11.2 OTHER PLAYERS 
             11.2.1 ANTYLIA SCIENTIFIC
             11.2.2 JULABO GMBH
             11.2.3 MACHEREY-NAGEL GMBH & CO. KG
             11.2.4 AVANTES BV
             11.2.5 EDINBURGH INSTRUMENTS
             11.2.6 THORLABS, INC.
             11.2.7 PG INSTRUMENTS
             11.2.8 GBC SCIENTIFIC EQUIPMENT PTY LTD.
             11.2.9 ANALYTIK JENA GMBH+CO. KG
             11.2.10 BUCK SCIENTIFIC INSTRUMENTS LLC
             11.2.11 EMCLAB INSTRUMENTS GMBH
 
12 APPENDIX (Page No. - 244)
     12.1 DISCUSSION GUIDE 
     12.2 KNOWLEDGESTORE: MARKETSANDMARKETS’ SUBSCRIPTION PORTAL 
     12.3 CUSTOMIZATION OPTIONS 
     12.4 RELATED REPORTS 
     12.5 AUTHOR DETAILS 
 
 
LIST OF TABLES (223 TABLES)
 
TABLE 1 UV/ VISIBLE SPECTROSCOPY MARKET: INCLUSIONS & EXCLUSIONS
TABLE 2 EPA-APPROVED PRODUCTS BY SHIMADZU CORPORATION
TABLE 3 LIST OF PRODUCTS FEATURING ADVANCED CAPABILITIES
TABLE 4 MEDICAL DEVICE CLASSIFICATION OF UV/VISIBLE SPECTROPHOTOMETERS BY US FDA
TABLE 5 US: MEDICAL DEVICE REGULATORY APPROVAL PROCESS
TABLE 6 CANADA: MEDICAL DEVICE REGULATORY APPROVAL PROCESS
TABLE 7 JAPAN: MEDICAL DEVICE CLASSIFICATION UNDER PHARMACEUTICAL AND MEDICAL DEVICE AGENCY
TABLE 8 CHINA: CLASSIFICATION OF MEDICAL DEVICES
TABLE 9 NORTH AMERICA: KEY REGULATORY BODIES, GOVERNMENT AGENCIES, AND OTHER ORGANIZATIONS
TABLE 10 EUROPE: KEY REGULATORY BODIES, GOVERNMENT AGENCIES, AND OTHER ORGANIZATIONS
TABLE 11 ASIA PACIFIC: KEY REGULATORY BODIES, GOVERNMENT AGENCIES, AND OTHER ORGANIZATIONS
TABLE 12 LATIN AMERICA: KEY REGULATORY BODIES, GOVERNMENT AGENCIES, AND OTHER ORGANIZATIONS
TABLE 13 MIDDLE EAST & AFRICA: KEY REGULATORY BODIES, GOVERNMENT AGENCIES, AND OTHER ORGANIZATIONS
TABLE 14 UV/VISIBLE SPECTROSCOPY MARKET: ROLE IN ECOSYSTEM
TABLE 15 IMPORT DATA FOR UV/VISIBLE SPECTROPHOTOMETERS (HS CODE 902730), BY COUNTRY, 2019–2023 (USD THOUSAND)
TABLE 16 EXPORT DATA FOR UV/VISIBLE SPECTROPHOTOMETERS (HS CODE 902730), BY COUNTRY, 2019–2023 (USD THOUSAND)
TABLE 17 LIST OF MAJOR PATENT INNOVATIONS AND PATENT REGISTRATIONS, 2022–2024
TABLE 18 AVERAGE SELLING PRICE OF UV/VISIBLE SPECTROSCOPY INSTRUMENTS, 2021–2023 (USD THOUSAND)
TABLE 19 AVERAGE SELLING PRICE OF UV/VISIBLE SPECTROPHOTOMETERS, BY REGION, 2021–2023
TABLE 20 UV/VISIBLE SPECTROSCOPY MARKET: PORTER’S FIVE FORCES ANALYSIS
TABLE 21 LIST OF KEY CONFERENCES & EVENTS IN UV/VISIBLE SPECTROSCOPY MARKET, JANUARY 2024–DECEMBER 2025
TABLE 22 INFLUENCE OF STAKEHOLDERS ON BUYING PROCESS OF UV/VISIBLE SPECTROSCOPY INSTRUMENTS, SOFTWARE & SERVICES, AND ACCESSORIES
TABLE 23 KEY BUYING CRITERIA FOR UV/VISIBLE SPECTROSCOPY PRODUCTS
TABLE 24 UV/VISIBLE SPECTROSCOPY MARKET: LIST OF UNMET NEEDS
TABLE 25 UV/VISIBLE SPECTROSCOPY MARKET, BY OFFERING, 2022–2029 (USD MILLION)
TABLE 26 UV/VISIBLE SPECTROSCOPY INSTRUMENTS MARKET, BY TYPE, 2022–2029 (USD MILLION)
TABLE 27 UV/VISIBLE SPECTROSCOPY INSTRUMENTS MARKET, BY REGION, 2022–2029 (USD MILLION)
TABLE 28 UV/VISIBLE SPECTROSCOPY INSTRUMENTS MARKET, BY APPLICATION, 2022–2029 (USD MILLION)
TABLE 29 UV/VISIBLE SPECTROSCOPY INSTRUMENTS MARKET, BY END USER, 2022–2029 (USD MILLION)
TABLE 30 UV/VISIBLE SPECTROSCOPY INSTRUMENTS MARKET FOR SINGLE-BEAM SYSTEMS, BY REGION, 2022–2029 (USD MILLION)
TABLE 31 UV/VISIBLE SPECTROSCOPY INSTRUMENTS MARKET FOR DUAL-BEAM SYSTEMS, BY REGION, 2022–2029 (USD MILLION)
TABLE 32 UV/VISIBLE SPECTROSCOPY INSTRUMENTS MARKET FOR ARRAY-BASED SYSTEMS, BY REGION, 2022–2029 (USD MILLION)
TABLE 33 UV/VISIBLE SPECTROSCOPY INSTRUMENTS MARKET FOR HANDHELD SYSTEMS, BY REGION, 2022–2029 (USD MILLION)
TABLE 34 UV/VISIBLE SPECTROSCOPY SOFTWARE & SERVICES MARKET, BY REGION, 2022–2029 (USD MILLION)
TABLE 35 UV/VISIBLE SPECTROSCOPY SOFTWARE & SERVICES MARKET, BY APPLICATION, 2022–2029 (USD MILLION)
TABLE 36 UV/VISIBLE SPECTROSCOPY SOFTWARE & SERVICES MARKET, BY END USER, 2022–2029 (USD MILLION)
TABLE 37 UV/VISIBLE SPECTROSCOPY ACCESSORIES MARKET, BY REGION, 2022–2029 (USD MILLION)
TABLE 38 UV/VISIBLE SPECTROSCOPY ACCESSORIES MARKET, BY APPLICATION, 2022–2029 (USD MILLION)
TABLE 39 UV/VISIBLE SPECTROSCOPY ACCESSORIES MARKET, BY END USER, 2022–2029 (USD MILLION)
TABLE 40 UV/VISIBLE SPECTROSCOPY MARKET, BY APPLICATION, 2022–2029 (USD MILLION)
TABLE 41 UV/VISIBLE SPECTROSCOPY MARKET, BY REGION, 2022–2029 (USD MILLION)
TABLE 42 UV/VISIBLE SPECTROSCOPY MARKET FOR INDUSTRIAL APPLICATIONS, BY TYPE, 2022–2029 (USD MILLION)
TABLE 43 UV/VISIBLE SPECTROSCOPY MARKET FOR INDUSTRIAL APPLICATIONS, BY REGION, 2022–2029 (USD MILLION)
TABLE 44 UV/VISIBLE SPECTROSCOPY MARKET FOR FOOD & BEVERAGE APPLICATIONS, BY REGION, 2022–2029 (USD MILLION)
TABLE 45 UV/VISIBLE SPECTROSCOPY MARKET FOR COSMETIC APPLICATIONS, BY REGION, 2022–2029 (USD MILLION)
TABLE 46 UV/VISIBLE SPECTROSCOPY MARKET FOR CHEMICAL & PETROCHEMICAL APPLICATIONS, BY REGION, 2022–2029 (USD MILLION)
TABLE 47 UV/VISIBLE SPECTROSCOPY MARKET FOR PHARMACEUTICAL APPLICATIONS, BY REGION, 2022–2029 (USD MILLION)
TABLE 48 UV/VISIBLE SPECTROSCOPY MARKET FOR AGRICULTURAL APPLICATIONS, BY REGION, 2022–2029 (USD MILLION)
TABLE 49 UV/VISIBLE SPECTROSCOPY MARKET FOR TEXTILE APPLICATIONS, BY REGION, 2022–2029 (USD MILLION)
TABLE 50 UV/VISIBLE SPECTROSCOPY MARKET FOR AUTOMOTIVE APPLICATIONS, BY REGION, 2022–2029 (USD MILLION)
TABLE 51 UV/VISIBLE SPECTROSCOPY MARKET FOR ACADEMIC APPLICATIONS, BY TYPE, 2022–2029 (USD MILLION)
TABLE 52 UV/VISIBLE SPECTROSCOPY MARKET FOR ACADEMIC APPLICATIONS, BY REGION, 2022–2029 (USD MILLION)
TABLE 53 UV/VISIBLE SPECTROSCOPY MARKET FOR LIFE SCIENCE STUDIES, BY REGION, 2022–2029 (USD MILLION)
TABLE 54 UV/VISIBLE SPECTROSCOPY MARKET FOR MATERIAL SCIENCE STUDIES, BY REGION, 2022–2029 (USD MILLION)
TABLE 55 UV/VISIBLE SPECTROSCOPY MARKET FOR ANALYTICAL & PHYSICAL CHEMISTRY STUDIES, BY REGION, 2022–2029 (USD MILLION)
TABLE 56 UV/VISIBLE SPECTROSCOPY MARKET FOR ENVIRONMENTAL & ECOLOGICAL STUDIES, BY REGION, 2022–2029 (USD MILLION)
TABLE 57 UV/VISIBLE SPECTROSCOPY MARKET FOR GEOLOGICAL STUDIES, BY REGION, 2022–2029 (USD MILLION)
TABLE 58 UV/VISIBLE SPECTROSCOPY MARKET FOR ENVIRONMENTAL APPLICATIONS, BY TYPE, 2022–2029 (USD MILLION)
TABLE 59 UV/VISIBLE SPECTROSCOPY MARKET FOR ENVIRONMENTAL APPLICATIONS, BY REGION, 2022–2029 (USD MILLION)
TABLE 60 UV/VISIBLE SPECTROSCOPY MARKET FOR AIR QUALITY TESTING, BY REGION, 2022–2029 (USD MILLION)
TABLE 61 UV/VISIBLE SPECTROSCOPY MARKET FOR WATER QUALITY TESTING, BY REGION, 2022–2029 (USD MILLION)
TABLE 62 UV/VISIBLE SPECTROSCOPY MARKET FOR SOIL QUALITY TESTING, BY REGION, 2022–2029 (USD MILLION)
TABLE 63 UV/VISIBLE SPECTROSCOPY MARKET FOR DIAGNOSTIC & PATHOLOGY TESTING, BY REGION, 2022–2029 (USD MILLION)
TABLE 64 UV/VISIBLE SPECTROSCOPY MARKET, BY END USER, 2022–2029 (USD MILLION)
TABLE 65 INDUSTRIAL APPLICATIONS OF MICROSCOPES
TABLE 66 UV/VISIBLE SPECTROSCOPY MARKET FOR INDUSTRIES, BY REGION, 2022–2029 (USD MILLION)
TABLE 67 UV/VISIBLE SPECTROSCOPY MARKET FOR INDUSTRIES, BY TYPE, 2022–2029 (USD MILLION)
TABLE 68 UV/VISIBLE SPECTROSCOPY MARKET FOR FOOD & BEVERAGE INDUSTRY, BY REGION, 2022–2029 (USD MILLION)
TABLE 69 UV/VISIBLE SPECTROSCOPY MARKET FOR BIOTECHNOLOGY & PHARMACEUTICAL INDUSTRY, BY REGION, 2022–2029 (USD MILLION)
TABLE 70 UV/VISIBLE SPECTROSCOPY MARKET FOR CHEMICAL & PETROCHEMICAL INDUSTRY, BY REGION, 2022–2029 (USD MILLION)
TABLE 71 UV/VISIBLE SPECTROSCOPY MARKET FOR TEXTILE INDUSTRY, BY REGION, 2022–2029 (USD MILLION)
TABLE 72 UV/VISIBLE SPECTROSCOPY MARKET FOR AGRICULTURAL INDUSTRY, BY REGION, 2022–2029 (USD MILLION)
TABLE 73 UV/VISIBLE SPECTROSCOPY MARKET FOR OTHER INDUSTRIES, BY REGION, 2022–2029 (USD MILLION)
TABLE 74 UV/VISIBLE SPECTROSCOPY MARKET FOR PATHOLOGY & DIAGNOSTIC LABS, BY REGION, 2022–2029 (USD MILLION)
TABLE 75 UV/VISIBLE SPECTROSCOPY MARKET FOR ACADEMIC & RESEARCH INSTITUTES, BY REGION, 2022–2029 (USD MILLION)
TABLE 76 UV/VISIBLE SPECTROSCOPY MARKET FOR OTHER END USERS, BY REGION, 2022–2029 (USD MILLION)
TABLE 77 UV/VISIBLE SPECTROSCOPY MARKET, BY REGION, 2022–2029 (USD MILLION)
TABLE 78 UV/VISIBLE SPECTROSCOPY INSTRUMENTS MARKET, BY TYPE, 2023 (UNITS)
TABLE 79 NORTH AMERICA: UV/VISIBLE SPECTROSCOPY MARKET, BY COUNTRY, 2022–2029 (USD MILLION)
TABLE 80 NORTH AMERICA: UV/VISIBLE SPECTROSCOPY MARKET, BY OFFERING, 2022–2029 (USD MILLION)
TABLE 81 NORTH AMERICA: UV/VISIBLE SPECTROSCOPY INSTRUMENTS MARKET, BY TYPE, 2022–2029 (USD MILLION)
TABLE 82 NORTH AMERICA: UV/VISIBLE SPECTROSCOPY MARKET, BY APPLICATION, 2022–2029 (USD MILLION)
TABLE 83 NORTH AMERICA: UV/VISIBLE SPECTROSCOPY MARKET FOR INDUSTRIAL APPLICATIONS, BY TYPE, 2022–2029 (USD MILLION)
TABLE 84 NORTH AMERICA: UV/VISIBLE SPECTROSCOPY MARKET FOR ACADEMIC APPLICATIONS, BY TYPE, 2022–2029 (USD MILLION)
TABLE 85 NORTH AMERICA: UV/VISIBLE SPECTROSCOPY MARKET FOR ENVIRONMENTAL APPLICATIONS, BY TYPE, 2022–2029 (USD MILLION)
TABLE 86 NORTH AMERICA: UV/VISIBLE SPECTROSCOPY MARKET, BY END USER, 2022–2029 (USD MILLION)
TABLE 87 NORTH AMERICA: UV/VISIBLE SPECTROSCOPY MARKET FOR INDUSTRIES, BY TYPE, 2022–2029 (USD MILLION)
TABLE 88 NORTH AMERICA: MACROECONOMIC OUTLOOK
TABLE 89 US: UV/VISIBLE SPECTROSCOPY MARKET, BY OFFERING, 2022–2029 (USD MILLION)
TABLE 90 US: UV/VISIBLE SPECTROSCOPY INSTRUMENTS MARKET, BY TYPE, 2022–2029 (USD MILLION)
TABLE 91 CANADA: UV/VISIBLE SPECTROSCOPY MARKET, BY OFFERING, 2022–2029 (USD MILLION)
TABLE 92 CANADA: UV/VISIBLE SPECTROSCOPY INSTRUMENTS MARKET, BY TYPE, 2022–2029 (USD MILLION)
TABLE 93 EUROPE: MAJOR DEVELOPMENTS IN UV/VISIBLE SPECTROSCOPY MARKET
TABLE 94 EUROPE: UV/VISIBLE SPECTROSCOPY MARKET, BY COUNTRY, 2022–2029 (USD MILLION)
TABLE 95 EUROPE: UV/VISIBLE SPECTROSCOPY MARKET, BY OFFERING, 2022–2029 (USD MILLION)
TABLE 96 EUROPE: UV/VISIBLE SPECTROSCOPY INSTRUMENTS MARKET, BY TYPE, 2022–2029 (USD MILLION)
TABLE 97 EUROPE: UV/VISIBLE SPECTROSCOPY MARKET, BY APPLICATION, 2022–2029 (USD MILLION)
TABLE 98 EUROPE: UV/VISIBLE SPECTROSCOPY MARKET FOR INDUSTRIAL APPLICATIONS, BY TYPE, 2022–2029 (USD MILLION)
TABLE 99 EUROPE: UV/VISIBLE SPECTROSCOPY MARKET FOR ACADEMIC APPLICATIONS, BY TYPE, 2022–2029 (USD MILLION)
TABLE 100 EUROPE: UV/VISIBLE SPECTROSCOPY MARKET FOR ENVIRONMENTAL APPLICATIONS, BY TYPE, 2022–2029 (USD MILLION)
TABLE 101 EUROPE: UV/VISIBLE SPECTROSCOPY MARKET, BY END USER, 2022–2029 (USD MILLION)
TABLE 102 EUROPE: UV/VISIBLE SPECTROSCOPY MARKET FOR INDUSTRIES, BY TYPE, 2022–2029 (USD MILLION)
TABLE 103 EUROPE: MACROECONOMIC OUTLOOK
TABLE 104 GERMANY: UV/VISIBLE SPECTROSCOPY MARKET, BY OFFERING, 2022–2029 (USD MILLION)
TABLE 105 GERMANY: UV/VISIBLE SPECTROSCOPY INSTRUMENTS MARKET, BY TYPE, 2022–2029 (USD MILLION)
TABLE 106 UK: UV/VISIBLE SPECTROSCOPY MARKET, BY OFFERING, 2022–2029 (USD MILLION)
TABLE 107 UK: UV/VISIBLE SPECTROSCOPY INSTRUMENTS MARKET, BY TYPE, 2022–2029 (USD MILLION)
TABLE 108 FRANCE: UV/VISIBLE SPECTROSCOPY MARKET, BY OFFERING, 2022–2029 (USD MILLION)
TABLE 109 FRANCE: UV/VISIBLE SPECTROSCOPY INSTRUMENTS MARKET, BY TYPE, 2022–2029 (USD MILLION)
TABLE 110 ITALY: UV/VISIBLE SPECTROSCOPY MARKET, BY OFFERING, 2022–2029 (USD MILLION)
TABLE 111 ITALY: UV/VISIBLE SPECTROSCOPY INSTRUMENTS MARKET, BY TYPE, 2022–2029 (USD MILLION)
TABLE 112 SPAIN: UV/VISIBLE SPECTROSCOPY MARKET, BY OFFERING, 2022–2029 (USD MILLION)
TABLE 113 SPAIN: UV/VISIBLE SPECTROSCOPY INSTRUMENTS MARKET, BY TYPE, 2022–2029 (USD MILLION)
TABLE 114 REST OF EUROPE: UV/VISIBLE SPECTROSCOPY MARKET, BY OFFERING, 2022–2029 (USD MILLION)
TABLE 115 REST OF EUROPE: UV/VISIBLE SPECTROSCOPY INSTRUMENTS MARKET, BY TYPE, 2022–2029 (USD MILLION)
TABLE 116 ASIA PACIFIC: UV/VISIBLE SPECTROSCOPY MARKET, BY COUNTRY, 2022–2029 (USD MILLION)
TABLE 117 ASIA PACIFIC: UV/VISIBLE SPECTROSCOPY MARKET, BY OFFERING, 2022–2029 (USD MILLION)
TABLE 118 ASIA PACIFIC: UV/VISIBLE SPECTROSCOPY INSTRUMENTS MARKET, BY TYPE, 2022–2029 (USD MILLION)
TABLE 119 ASIA PACIFIC: UV/VISIBLE SPECTROSCOPY MARKET, BY APPLICATION, 2022–2029 (USD MILLION)
TABLE 120 ASIA PACIFIC: UV/VISIBLE SPECTROSCOPY MARKET FOR INDUSTRIAL APPLICATIONS, BY TYPE, 2022–2029 (USD MILLION)
TABLE 121 ASIA PACIFIC: UV/VISIBLE SPECTROSCOPY MARKET FOR ACADEMIC APPLICATIONS, BY TYPE, 2022–2029 (USD MILLION)
TABLE 122 ASIA PACIFIC: UV/VISIBLE SPECTROSCOPY MARKET FOR ENVIRONMENTAL APPLICATIONS, BY TYPE, 2022–2029 (USD MILLION)
TABLE 123 ASIA PACIFIC: UV/VISIBLE SPECTROSCOPY MARKET, BY END USER, 2022–2029 (USD MILLION)
TABLE 124 ASIA PACIFIC: UV/VISIBLE SPECTROSCOPY MARKET FOR INDUSTRIES, BY TYPE, 2022–2029 (USD MILLION)
TABLE 125 ASIA PACIFIC: MACROECONOMIC OUTLOOK
TABLE 126 JAPAN: UV/VISIBLE SPECTROSCOPY MARKET, BY OFFERING, 2022–2029 (USD MILLION)
TABLE 127 JAPAN: UV/VISIBLE SPECTROSCOPY INSTRUMENTS MARKET, BY TYPE, 2022–2029 (USD MILLION)
TABLE 128 CHINA: UV/VISIBLE SPECTROSCOPY MARKET, BY OFFERING, 2022–2029 (USD MILLION)
TABLE 129 CHINA: UV/VISIBLE SPECTROSCOPY INSTRUMENTS MARKET, BY TYPE, 2022–2029 (USD MILLION)
TABLE 130 INDIA: UV/VISIBLE SPECTROSCOPY MARKET, BY OFFERING, 2022–2029 (USD MILLION)
TABLE 131 INDIA: UV/VISIBLE SPECTROSCOPY INSTRUMENTS MARKET, BY TYPE, 2022–2029 (USD MILLION)
TABLE 132 AUSTRALIA: UV/VISIBLE SPECTROSCOPY MARKET, BY OFFERING, 2022–2029 (USD MILLION)
TABLE 133 AUSTRALIA: UV/VISIBLE SPECTROSCOPY INSTRUMENTS MARKET, BY TYPE, 2022–2029 (USD MILLION)
TABLE 134 SOUTH KOREA: UV/VISIBLE SPECTROSCOPY MARKET, BY OFFERING, 2022–2029 (USD MILLION)
TABLE 135 SOUTH KOREA: UV/VISIBLE SPECTROSCOPY INSTRUMENTS MARKET, BY TYPE, 2022–2029 (USD MILLION)
TABLE 136 REST OF ASIA PACIFIC: UV/VISIBLE SPECTROSCOPY MARKET, BY OFFERING, 2022–2029 (USD MILLION)
TABLE 137 REST OF ASIA PACIFIC: UV/VISIBLE SPECTROSCOPY INSTRUMENTS MARKET, BY TYPE, 2022–2029 (USD MILLION)
TABLE 138 LATIN AMERICA: UV/VISIBLE SPECTROSCOPY MARKET, BY COUNTRY, 2022–2029 (USD MILLION)
TABLE 139 LATIN AMERICA: UV/VISIBLE SPECTROSCOPY MARKET, BY OFFERING, 2022–2029 (USD MILLION)
TABLE 140 LATIN AMERICA: UV/VISIBLE SPECTROSCOPY INSTRUMENTS MARKET, BY TYPE, 2022–2029 (USD MILLION)
TABLE 141 LATIN AMERICA: UV/VISIBLE SPECTROSCOPY MARKET, BY APPLICATION, 2022–2029 (USD MILLION)
TABLE 142 LATIN AMERICA: UV/VISIBLE SPECTROSCOPY MARKET FOR INDUSTRIAL APPLICATIONS, BY TYPE, 2022–2029 (USD MILLION)
TABLE 143 LATIN AMERICA: UV/VISIBLE SPECTROSCOPY MARKET FOR ACADEMIC APPLICATIONS, BY TYPE, 2022–2029 (USD MILLION)
TABLE 144 LATIN AMERICA: UV/VISIBLE SPECTROSCOPY MARKET FOR ENVIRONMENTAL APPLICATIONS, BY TYPE, 2022–2029 (USD MILLION)
TABLE 145 LATIN AMERICA: UV/VISIBLE SPECTROSCOPY MARKET, BY END USER, 2022–2029 (USD MILLION)
TABLE 146 LATIN AMERICA: UV/VISIBLE SPECTROSCOPY MARKET FOR INDUSTRIES, BY TYPE, 2022–2029 (USD MILLION)
TABLE 147 LATIN AMERICA: MACROECONOMIC OUTLOOK
TABLE 148 BRAZIL: UV/VISIBLE SPECTROSCOPY MARKET, BY OFFERING, 2022–2029 (USD MILLION)
TABLE 149 BRAZIL: UV/VISIBLE SPECTROSCOPY INSTRUMENTS MARKET, BY TYPE, 2022–2029 (USD MILLION)
TABLE 150 MEXICO: UV/VISIBLE SPECTROSCOPY MARKET, BY OFFERING, 2022–2029 (USD MILLION)
TABLE 151 MEXICO: UV/VISIBLE SPECTROSCOPY INSTRUMENTS MARKET, BY TYPE, 2022–2029 (USD MILLION)
TABLE 152 REST OF LATIN AMERICA: UV/VISIBLE SPECTROSCOPY MARKET, BY OFFERING, 2022–2029 (USD MILLION)
TABLE 153 REST OF LATIN AMERICA: UV/VISIBLE SPECTROSCOPY INSTRUMENTS MARKET, BY TYPE, 2022–2029 (USD MILLION)
TABLE 154 MIDDLE EAST & AFRICA: UV/VISIBLE SPECTROSCOPY MARKET, BY COUNTRY, 2022–2029 (USD MILLION)
TABLE 155 MIDDLE EAST & AFRICA: UV/VISIBLE SPECTROSCOPY MARKET, BY OFFERING, 2022–2029 (USD MILLION)
TABLE 156 MIDDLE EAST & AFRICA: UV/VISIBLE SPECTROSCOPY INSTRUMENTS MARKET, BY TYPE, 2022–2029 (USD MILLION)
TABLE 157 MIDDLE EAST & AFRICA: UV/VISIBLE SPECTROSCOPY MARKET, BY APPLICATION, 2022–2029 (USD MILLION)
TABLE 158 MIDDLE EAST & AFRICA: UV/VISIBLE SPECTROSCOPY MARKET FOR INDUSTRIAL APPLICATIONS, BY TYPE, 2022–2029 (USD MILLION)
TABLE 159 MIDDLE EAST & AFRICA: UV/VISIBLE SPECTROSCOPY MARKET FOR ACADEMIC APPLICATIONS, BY TYPE, 2022–2029 (USD MILLION)
TABLE 160 MIDDLE EAST & AFRICA: UV/VISIBLE SPECTROSCOPY MARKET FOR ENVIRONMENTAL APPLICATIONS, BY TYPE, 2022–2029 (USD MILLION)
TABLE 161 MIDDLE EAST & AFRICA: UV/VISIBLE SPECTROSCOPY MARKET, BY END USER, 2022–2029 (USD MILLION)
TABLE 162 MIDDLE EAST & AFRICA: UV/VISIBLE SPECTROSCOPY MARKET FOR INDUSTRIES, BY TYPE, 2022–2029 (USD MILLION)
TABLE 163 MIDDLE EAST & AFRICA: MACROECONOMIC OUTLOOK
TABLE 164 GCC COUNTRIES: UV/VISIBLE SPECTROSCOPY MARKET, BY OFFERING, 2022–2029 (USD MILLION)
TABLE 165 GCC COUNTRIES: UV/VISIBLE SPECTROSCOPY INSTRUMENTS MARKET, BY TYPE, 2022–2029 (USD MILLION)
TABLE 166 REST OF MIDDLE EAST & AFRICA: UV/VISIBLE SPECTROSCOPY MARKET, BY OFFERING, 2022–2029 (USD MILLION)
TABLE 167 REST OF MIDDLE EAST & AFRICA: UV/VISIBLE SPECTROSCOPY INSTRUMENTS MARKET, BY TYPE, 2022–2029 (USD MILLION)
TABLE 168 OVERVIEW OF STRATEGIES ADOPTED BY KEY MANUFACTURING COMPANIES
TABLE 169 UV/VISIBLE SPECTROSCOPY MARKET: DEGREE OF COMPETITION
TABLE 170 UV/VISIBLE SPECTROSCOPY MARKET: OFFERING FOOTPRINT
TABLE 171 UV/VISIBLE SPECTROSCOPY MARKET: APPLICATION FOOTPRINT
TABLE 172 UV/VISIBLE SPECTROSCOPY MARKET: END-USER FOOTPRINT
TABLE 173 UV/VISIBLE SPECTROSCOPY MARKET: REGION FOOTPRINT
TABLE 174 UV–VISIBLE SPECTROSCOPY MARKET: DETAILED LIST OF KEY STARTUP/SME PLAYERS
TABLE 175 UV/VISIBLE SPECTROSCOPY MARKET: COMPETITIVE BENCHMARKING OF KEY STARTUPS/SMES
TABLE 176 UV/VISIBLE SPECTROSCOPY MARKET: PRODUCT LAUNCHES, JANUARY 2021–MAY 2024
TABLE 177 UV/VISIBLE SPECTROSCOPY MARKET: DEALS, JANUARY 2021–MAY 2024
TABLE 178 UV/VISIBLE SPECTROSCOPY MARKET: EXPANSIONS, JANUARY 2021–MAY 2024
TABLE 179 AGILENT TECHNOLOGIES, INC.: COMPANY OVERVIEW
TABLE 180 AGILENT TECHNOLOGIES, INC.: PRODUCTS OFFERED
TABLE 181 AGILENT TECHNOLOGIES INC.: PRODUCT LAUNCHES, JANUARY 2021–MAY 2024
TABLE 182 AGILENT TECHNOLOGIES INC.: DEALS, JANUARY 2021–MAY 2024
TABLE 183 AGILENT TECHNOLOGIES INC.: EXPANSIONS, JANUARY 2021–MAY 2024
TABLE 184 PERKINELMER, INC.: COMPANY OVERVIEW
TABLE 185 PERKINELMER, INC.: PRODUCTS OFFERED
TABLE 186 THERMO FISHER SCIENTIFIC INC.: COMPANY OVERVIEW
TABLE 187 THERMO FISHER SCIENTIFIC INC.: PRODUCTS OFFERED
TABLE 188 THERMO FISHER SCIENTIFIC INC.: PRODUCT LAUNCHES, JANUARY 2021–MAY 2024
TABLE 189 THERMO FISHER SCIENTIFIC INC.: DEALS, JANUARY 2021–MAY 2024
TABLE 190 VERALTO CORPORATION: COMPANY OVERVIEW
TABLE 191 VERALTO CORPORATION: PRODUCTS OFFERED
TABLE 192 VERALTO CORPORATION: DEALS, JANUARY 2021–MAY 2024
TABLE 193 SHIMADZU CORPORATION: COMPANY OVERVIEW
TABLE 194 SHIMADZU CORPORATION: PRODUCTS OFFERED
TABLE 195 SHIMADZU CORPORATION: PRODUCT LAUNCHES, JANUARY 2021–MAY 2024
TABLE 196 SHIMADZU CORPORATION: EXPANSIONS, JANUARY 2021–MAY 2024
TABLE 197 JASCO: COMPANY OVERVIEW
TABLE 198 JASCO: PRODUCTS OFFERED
TABLE 199 JASCO: PRODUCT LAUNCHES, JANUARY 2021–MAY 2024
TABLE 200 JASCO: DEALS, JANUARY 2021–MAY 2024
TABLE 201 METTLER TOLEDO: COMPANY OVERVIEW
TABLE 202 METTLER TOLEDO: PRODUCTS OFFERED
TABLE 203 METTLER TOLEDO: PRODUCT LAUNCHES, JANUARY 2021–MAY 2024
TABLE 204 HITACHI HIGH-TECH CORPORATION: COMPANY OVERVIEW
TABLE 205 HITACHI HIGH-TECH CORPORATION: PRODUCTS OFFERED
TABLE 206 HITACHI HIGH-TECH CORPORATION: OTHER DEVELOPMENTS, JANUARY 2021–MAY 2024
TABLE 207 OXFORD INSTRUMENTS PLC: COMPANY OVERVIEW
TABLE 208 OXFORD INSTRUMENTS PLC: PRODUCTS OFFERED
TABLE 209 OXFORD INSTRUMENTS PLC: EXPANSIONS, JANUARY 2021–MAY 2024
TABLE 210 BRUKER CORPORATION: COMPANY OVERVIEW
TABLE 211 BRUKER CORPORATION: PRODUCTS OFFERED
TABLE 212 BRUKER CORPORATION: PRODUCT LAUNCHES, JANUARY 2021–MAY 2024
TABLE 213 HORIBA LTD.: COMPANY OVERVIEW
TABLE 214 HORIBA LTD.: PRODUCTS OFFERED
TABLE 215 HORIBA LTD.: DEALS, JANUARY 2021–MAY 2024
TABLE 216 HAMAMATSU PHOTONICS K.K.: COMPANY OVERVIEW
TABLE 217 HAMAMATSU PHOTONICS K.K.: PRODUCTS OFFERED
TABLE 218 HAMAMATSU PHOTONICS K.K.: PRODUCT LAUNCHES, JANUARY 2021–MAY 2024
TABLE 219 HAMAMATSU PHOTONICS K.K.: EXPANSIONS, JANUARY 2021–MAY 2024
TABLE 220 HARVARD BIOSCIENCE, INC.: COMPANY OVERVIEW
TABLE 221 HARVARD BIOSCIENCE, INC.: PRODUCTS OFFERED
TABLE 222 XYLEM, INC.: COMPANY OVERVIEW
TABLE 223 XYLEM, INC.: PRODUCTS OFFERED
 
 
LIST OF FIGURES (61 FIGURES)
 
FIGURE 1 UV/VISIBLE SPECTROSCOPY MARKET: SEGMENTS COVERED
FIGURE 2 UV/VISIBLE SPECTROSCOPY MARKET: YEARS CONSIDERED
FIGURE 3 UV/VISIBLE SPECTROSCOPY MARKET: RESEARCH DESIGN METHODOLOGY
FIGURE 4 BREAKDOWN OF PRIMARY INTERVIEWS: BY COMPANY TYPE, DESIGNATION, AND REGION
FIGURE 5 RESEARCH METHODOLOGY: HYPOTHESIS BUILDING
FIGURE 6 BOTTOM-UP APPROACH: COMPANY REVENUE ESTIMATION APPROACH
FIGURE 7 UV/VISIBLE SPECTROSCOPY MARKET: BOTTOM-UP APPROACH
FIGURE 8 UV/VISIBLE SPECTROSCOPY MARKET: GROWTH PROJECTIONS BASED ON REVENUE IMPACT OF KEY MACROINDICATORS
FIGURE 9 DATA TRIANGULATION METHODOLOGY
FIGURE 10 UV/VISIBLE SPECTROSCOPY MARKET, BY OFFERING, 2024 VS. 2029 (USD MILLION)
FIGURE 11 UV/VISIBLE SPECTROSCOPY INSTRUMENTS MARKET, BY TYPE, 2024 VS. 2029 (USD MILLION)
FIGURE 12 UV/VISIBLE SPECTROSCOPY MARKET, BY APPLICATION, 2024 VS. 2029 (USD MILLION)
FIGURE 13 UV/VISIBLE SPECTROSCOPY MARKET, BY END USER, 2024 VS. 2029 (USD MILLION)
FIGURE 14 GEOGRAPHICAL SNAPSHOT OF UV/VISIBLE SPECTROSCOPY MARKET
FIGURE 15 FAVORABLE R&D FUNDING AND STRICT ENVIRONMENTAL REGULATIONS TO DRIVE MARKET
FIGURE 16 DUAL-BEAM SYSTEMS TO REGISTER HIGHEST CAGR DURING FORECAST PERIOD
FIGURE 17 CHINA AND INDUSTRIES SEGMENT TO DOMINATE MARKET DURING STUDY PERIOD
FIGURE 18 INDUSTRIAL APPLICATIONS TO COMMAND LARGEST MARKET SHARE FROM 2024 TO 2029
FIGURE 19 ASIA PACIFIC COUNTRIES TO REGISTER HIGHEST CAGR DURING STUDY PERIOD
FIGURE 20 UV/VISIBLE SPECTROSCOPY MARKET: DRIVERS, RESTRAINTS, OPPORTUNITIES, AND CHALLENGES
FIGURE 21 US: PREMARKET NOTIFICATION: 510(K) APPROVALS FOR MEDICAL DEVICES
FIGURE 22 CANADA: REGULATORY APPROVAL PROCESS FOR MEDICAL DEVICES
FIGURE 23 EUROPE: CE APPROVAL PROCESS FOR MEDICAL DEVICES
FIGURE 24 UV/VISIBLE SPECTROSCOPY MARKET: VALUE CHAIN ANALYSIS
FIGURE 25 UV/VISIBLE SPECTROSCOPY MARKET: SUPPLY CHAIN ANALYSIS
FIGURE 26 UV/VISIBLE SPECTROSCOPY MARKET: ECOSYSTEM ANALYSIS
FIGURE 27 PATENT DETAILS FOR UV/VISIBLE SPECTROPHOTOMETERS (JANUARY 2013–DECEMBER 2023)
FIGURE 28 AVERAGE SELLING PRICE OF UV/VISIBLE SPECTROSCOPY INSTRUMENTS, 2023 (USD THOUSAND)
FIGURE 29 AVERAGE SELLING PRICE FOR TOP 3 UV/VISIBLE SPECTROSCOPY INSTRUMENTS, BY KEY PLAYER, 2023 (USD THOUSAND)
FIGURE 30 AVERAGE SELLING PRICE TREND OF UV/VISIBLE SPECTROSCOPY INSTRUMENTS, BY REGION, 2023 (USD THOUSAND)
FIGURE 31 UV/VISIBLE SPECTROSCOPY MARKET: PORTER’S FIVE FORCES ANALYSIS
FIGURE 32 TRENDS/DISRUPTIONS IMPACTING CUSTOMERS’ BUSINESSES
FIGURE 33 FUNDING AND DEALS IN UV/VISIBLE SPECTROSCOPY MARKET, 2020–2024
FIGURE 34 NUMBER OF DEALS IN UV/VISIBLE SPECTROSCOPY MARKET, BY KEY PLAYER, 2020–2024
FIGURE 35 VALUE OF DEALS IN UV/VISIBLE SPECTROSCOPY MARKET, BY KEY PLAYER, 2020–2024 (USD)
FIGURE 36 INFLUENCE OF STAKEHOLDERS ON BUYING PROCESS
FIGURE 37 KEY BUYING CRITERIA FOR UV/VISIBLE SPECTROSCOPY PRODUCTS, BY END USER
FIGURE 38 NORTH AMERICA: UV/VISIBLE SPECTROSCOPY MARKET SNAPSHOT
FIGURE 39 ASIA PACIFIC: UV/VISIBLE SPECTROSCOPY MARKET SNAPSHOT
FIGURE 40 REVENUE ANALYSIS OF TOP FIVE PLAYERS IN UV/VISIBLE SPECTROSCOPY MARKET (2019–2023)
FIGURE 41 MARKET SHARE ANALYSIS OF KEY PLAYERS IN UV/VISIBLE SPECTROSCOPY MARKET (2023)
FIGURE 42 RANKING OF KEY PLAYERS IN UV/VISIBLE SPECTROSCOPY MARKET, 2023
FIGURE 43 UV/VISIBLE SPECTROSCOPY MARKET: COMPANY EVALUATION MATRIX (KEY PLAYERS), 2023
FIGURE 44 UV/VISIBLE SPECTROSCOPY MARKET: COMPANY FOOTPRINT
FIGURE 45 UV/VISIBLE SPECTROSCOPY MARKET: COMPANY EVALUATION MATRIX (STARTUPS/SMES), 2023
FIGURE 46 EV/EBITDA OF KEY VENDORS
FIGURE 47 YEAR-TO-DATE (YTD) PRICE TOTAL RETURN AND 5-YEAR STOCK BETA OF KEY VENDORS
FIGURE 48 UV/VISIBLE SPECTROSCOPY MARKET: BRAND/PRODUCT COMPARATIVE ANALYSIS
FIGURE 49 AGILENT TECHNOLOGIES, INC.: COMPANY SNAPSHOT (2023)
FIGURE 50 PERKINELMER, INC.: COMPANY SNAPSHOT (2023)
FIGURE 51 THERMO FISHER SCIENTIFIC INC.: COMPANY SNAPSHOT (2023)
FIGURE 52 VERALTO CORPORATION: COMPANY SNAPSHOT (2023)
FIGURE 53 SHIMADZU CORPORATION: COMPANY SNAPSHOT (2023)
FIGURE 54 METTLER TOLEDO: COMPANY SNAPSHOT (2023)
FIGURE 55 HITACHI HIGH-TECH CORPORATION: COMPANY SNAPSHOT (2023)
FIGURE 56 OXFORD INSTRUMENTS PLC: COMPANY SNAPSHOT (2023)
FIGURE 57 BRUKER CORPORATION: COMPANY SNAPSHOT (2023)
FIGURE 58 HORIBA LTD.: COMPANY SNAPSHOT (2023)
FIGURE 59 HAMAMATSU PHOTONICS K.K.: COMPANY SNAPSHOT (2023)
FIGURE 60 HARVARD BIOSCIENCE, INC.: COMPANY SNAPSHOT (2023)
FIGURE 61 XYLEM, INC.: COMPANY SNAPSHOT (2023)

To make a balance between primary and secondary research for the UV/visible spectroscopy market, various market variables for small and medium-sized businesses and major businesses were analyzed as part of this study. The study is composed of significant market segments, evolving patterns, regulatory frameworks, and competitive environments. This study also considers key market players and their strategies they deploy in this market. Total market size was estimated through top-down and bottom-up approaches along with data triangulation to reach the number for final market size. Primary research was conducted throughout the course of the study to validate and test each hypothesis.

Secondary Research

During the study, secondary research utilized various secondary sources that included directories, databases like Bloomberg Businessweek, D&B Hoovers, and Factiva, white papers, annual reports, SEC filings, and investor presentations. The above-mentioned research approach was utilized to gather and generate data that contains comprehensive, technical, and market-focused insights for the UV/visible spectroscopy market. The data also provides insights about key players and market segmentation based on recent industry trends, along with significant developments related to the market. A database consisting of leading industry figures was also produced through secondary research.

Primary Research

For the part of primary research and to obtain qualitative and quantitative data a range of personalities from the supply and demand sides were questioned during the phase of primary research. Key positions from the industry like CEOs, vice presidents, directors of marketing and sales, directors of technology and innovation, and other important leaders were interviewed from key players. Among the demand-side primary sources were academic institutions, research organizations. In order to validate market segmentation, identify prominent market participants, and gain insights into significant industry trends and market dynamics of the real-world primary study was carried out. To gather qualitative and quantitative insights in primary research, personalities from supply and demand sides were interviewed. Crucial designers from industries like CEOs, VPs, directors for marketing and sales, and other important personalities were interviewed from major players in the market. To validate market segmentation and identify prominent market participant personalities from demand from academic institutes, research organizations were interviewed.

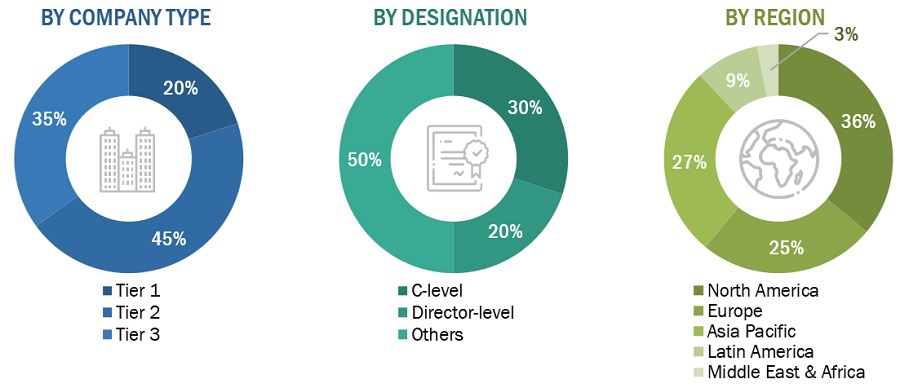
A breakdown of the primary respondents is provided below:
UV/Visible Spectroscopy Market Size, and Share

*Others include distributors, suppliers, product managers, business development managers, marketing managers and sales managers.

Note: Companies are categorized into tiers based on their total revenue. As of 2023, Tier 1 = >USD 1,000 million, Tier 2 = USD 500–1,000 million, and Tier 3 = < USD 500 million.

To know about the assumptions considered for the study, download the pdf brochure

Market Estimation Methodology

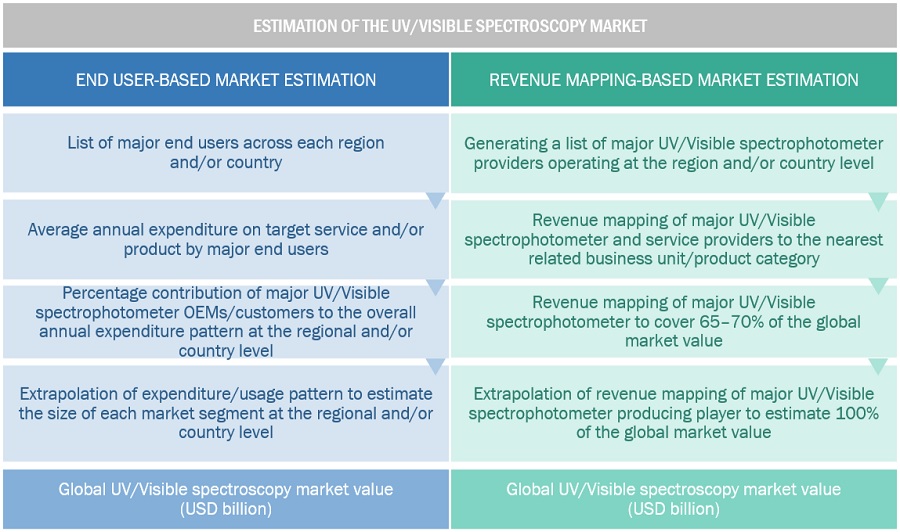
Based on a review of prominent company's revenue shares, the market size of the global UV/Visible spectroscopy market was calculated in this report. To address this, major market participants were identified, and their UV/Visible spectrophotometer business revenues were calculated using insights obtained through the primary and secondary research stages. Analyzing the annual and financial reports of the leading market participants was one aspect of secondary research. On the other hand, in-depth interviews with important thought leaders, including directors, CEOs, and marketing executives, were a part of the primary study.

For calculation of global market value, segmental revenue was calculated in the basis of revenue mapping of service/product providers. Process involved below mentioned steps:

  • List of prominent players that operate in UV/Visible spectroscopy market on regional or country level.
  • Formation of product mapping of manufacturers of UV/Visible spectrophotometers and related product lines at regional and country level
  • Revenue mapping for listed players from UV/Visible spectrophotometers and related product and services.
  • Revenue mapping of major players to cover at least ~70% of the global market share as of 2023. Revenue mapping for major players that cover nearly 70% of the global market share for year 2023.
  • Revenue mapping extrapolation for players will drive the global market value for the respective segment.
  • Summation for market value for all segment and subsegment to achieve actual value of the global value of UV/Visible spectroscopy market.
UV/Visible Spectroscopy Market Size, and Share

To know about the assumptions considered for the study, Request for Free Sample Report

Data Triangulation

After getting the overall market size from the market size estimation process mentioned above, the UV/Visible spectroscopy market was split into segments and subsegments. Data triangulation and market segmentation procedures were used to complete the overall market engineering process and arrive at the exact statistics for all segments and subsegments. The data was triangulated by studying and analyzing various factors and trends from both the demand and supply sides. Additionally, the UV/Visible spectroscopy market was verified and validated using both top-down and bottom-up approaches.

Market Definition

UV/visible spectroscopy is an analytical technique used for measuring the absorption, emission, and transmission of a specific region of the electromagnetic spectrum called the ultraviolet region (190 nm-400nm) and visible region (400 nm-800 nm). The market comprises of UV/visible spectroscopy systems, software, post sales services and accessories that are routinely used in the fields of academic and industrial research for the quantitative and qualitative determination of different analytes, such as transition metal ions, highly conjugated organic compounds, and biological macromolecules.

Key Stakeholders

  • Biotech and Pharmaceutical Companies.
  • Pharmaceutical and biotechnology companies
  • Manufacturers and suppliers of UV/Visible spectrophotometers, accessories, and software
  • Product suppliers, distributors, and channel partners
  • Automotive industry
  • Food & beverage industry
  • Medical research institutes and independent research labs
  • Academic & research institutes
  • Community centers and hospitals
  • Regulatory authorities and industry associations
  • Venture capitalists and investment firms

Objectives of the Study

  • To describe, define and forecast the market for UV/Visible spectroscopy on the basis of instrument types, applications, end–user and region.
  • To give detailed information regarding factors influencing the growth potential of the UV/Visible spectroscopy market (drivers, restraints, opportunities, challenges, and trends)
  • To study the micro markets with considering individual growth trends, future prospects, and contributions to the UV/Visible spectroscopy market
  • To study and analyze crucial growth opportunities in the UV/Visible spectroscopy market for prominent stakeholders and to give insights on competitive landscape for market leaders
  • To forecast the size of market segments and/or subsegments with respect to five major regions, namely, North America (US and Canada), Europe (Germany, France, the UK, Italy, Spain, and the RoE), Asia Pacific (Japan, China, India, and the RoAPAC), Latin America (Brazil, Mexico, and RoLATAM), and the Middle East & Africa
  • To profile the key players in the global UV/Visible spectroscopy market and deeply analyze their market shares and core capabilities.
  • To study, track and analyze the competitive developments undertaken in the global UV/Visible spectroscopy market, such as product launches; agreements; expansions; and mergers & acquisitions.

Available Customizations

With the given market data, MarketsandMarkets offers customizations per the company’s specific needs. The following customization options are available for the present UV/Visible spectroscopy market report:

Product Analysis

  • Product matrix gives a detailed comparison of the product portfolios of the top five companies.

Company Information

  • Detailed analysis and profiling of additional market players (up to five)

Geographic Analysis

  • Further breakdown of the Rest of Europe UV/Visible spectroscopy market into Russia, Belgium, Netherlands, Switzerland, Austria, Finland, Sweden, Poland, and Portugal, among others
  • Further breakdown of the Rest of Asia Pacific UV/Visible spectroscopy market into Singapore, Taiwan, New Zealand, Philippines, Malaysia, and other APAC countries
Custom Market Research Services

We will customize the research for you, in case the report listed above does not meet with your exact requirements. Our custom research will comprehensively cover the business information you require to help you arrive at strategic and profitable business decisions.

Request Customization

Instant Answers with GPT - Ask Now!

Ask real questions. Get complete answers !
Report Code
AST 4640
Published ON
Aug, 2024
Choose License Type
BUY NOW
  • SHARE
X
Request Customization
Speak to Analyst
Speak to Analyst
OR FACE-TO-FACE MEETING
PERSONALIZE THIS RESEARCH
  • Triangulate with your Own Data
  • Get Data as per your Format and Definition
  • Gain a Deeper Dive on a Specific Application, Geography, Customer or Competitor
  • Any level of Personalization
REQUEST A FREE CUSTOMIZATION
LET US HELP YOU!
  • What are the Known and Unknown Adjacencies Impacting the Ultraviolet Visible Spectroscopy Market
  • What will your New Revenue Sources be?
  • Who will be your Top Customer; what will make them switch?
  • Defend your Market Share or Win Competitors
  • Get a Scorecard for Target Partners
CUSTOMIZED WORKSHOP REQUEST
  • Call Us
  • +1-888-600-6441 (Corporate office hours)
  • +1-888-600-6441 (US/Can toll free)
  • +44-800-368-9399 (UK office hours)
CONNECT WITH US
ABOUT TRUST ONLINE
©2024 MarketsandMarkets Research Private Ltd. All rights reserved
DMCA.com Protection Status
Website Feedback