
Vacuum Evaporators Market

Vacuum Evaporators Market by Technology (Heat Pump, Mechanical Vapor Recompression, Thermal), Application (Wastewater Treatment, Product Processing), End-use Industry (Food & Beverage, Pharmaceutical) and Region - Global Forecast to 2030


OVERVIEW
Source: Secondary Research, Interviews with Experts, MarketsandMarkets Analysis
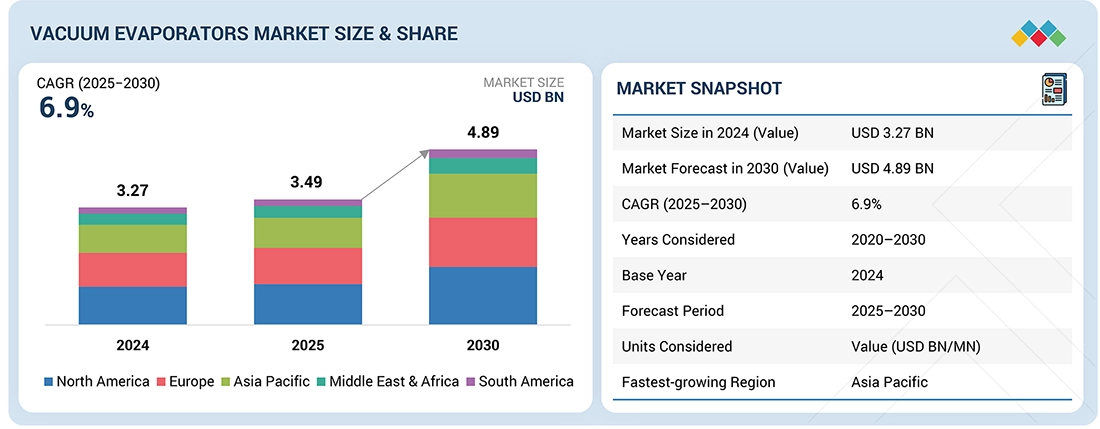
The vacuum evaporators market is projected to reach USD 4.89 billion by 2030 from USD 3.49 billion in 2025, at a CAGR of 6.9% during the forecast period. Vacuum evaporators are mainly used in the food & beverage industries. Rapid adoption of zero liquid discharge (ZLD) and minimum liquid discharge (MLD) in manufacturing industries drives the growth in the vacuum evaporators market. Vacuum evaporators find applications in multiple end-use industries such as pharmaceutical, chemical & petrochemical, electronics & semiconductors, food & beverage, and automotive, among others.
KEY TAKEAWAYS
-
BY TECHNOLOGYThe vacuum evaporators market comprises heat pump vacuum evaporators, mechanical vapor recompression vacuum evaporators, and thermal vacuum evaporators. The thermal vacuum evaporators segment accounted for a major share of the vacuum evaporators market in 2024, as they are used to treat high salinity and contaminant wastewater.
-
BY APPLICATIONThe applications of vacuum evaporators include wastewater treatment and product processing, among others. The wastewater treatment segment accounted for the largest share of the overall vacuum evaporators market in 2024. Industrial activities generate wastewater containing various pollutants, resulting from processes such as cleaning and cooling, which results in the adoption of Zero Liquid Discharge (ZLD) systems.
-
BY CAPACITYThe capacity segment includes small-scale, medium-scale, and large-scale. The large-scale segment accounts for a major share as these systems are most prevalent in industries such as chemicals, pharmaceuticals, food & beverage processing, and large-scale manufacturing facilities where the volume of effluent and process waste is substantial.
-
BY INSTALLATION TYPEKey installation types include new installation and retrofit installation. The larger segment by installation type in the vacuum evaporators market is new installations. This dominance is primarily attributed to the ongoing industrial expansion and regulatory mandates that require the deployment of advanced evaporation systems for zero liquid discharge (ZLD) and wastewater treatment in new facilities.
-
BY END-USE INDUSTRYEnd-use industries of vacuum evaporators include chemical & petrochemical, electronics & semiconductor, energy & power, food & beverage, pharmaceutical, automotive, and others. The automotive segment accounted for the largest share of the vacuum evaporators market, as the automotive industry generates complex effluents throughout the production process.
-
BY REGIONThe vacuum evaporators market covers Europe, North America, Asia Pacific, South America, and the Middle East & Africa. North America is the largest market for vacuum evaporators. It is home to several prominent vacuum evaporator companies and is witnessing growth in the automotive, chemical, and petrochemical industries, all contributing to the increasing adoption of vacuum evaporator products.
-
COMPETITIVE LANDSCAPEThe major market players have adopted both organic and inorganic strategies, including expansions, new product developments, partnerships, acquisitions, and product launches. For instance, the agreement between Veolia Water Technologies and Tampa Bay Water involves Veolia leading the design, construction, and operation of an expansion project to increase drinking water capacity for customers in the Gulf Coast region of Florida. This project increases Veolia’s activities in the US municipal water sector, provides experience with large-scale water infrastructure in the region, and adds to its list of completed projects in North America.
The vacuum evaporators market is witnessing steady growth, driven by the implementation of stringent environmental regulations and zero liquid discharge (ZLD) initiatives, water scarcity, the need for resource recovery, and expanding industrial applications. New deals and developments, including product launches, strategic partnerships between OEMs and material suppliers, and expansions of production capacities, are reshaping the industry landscape.
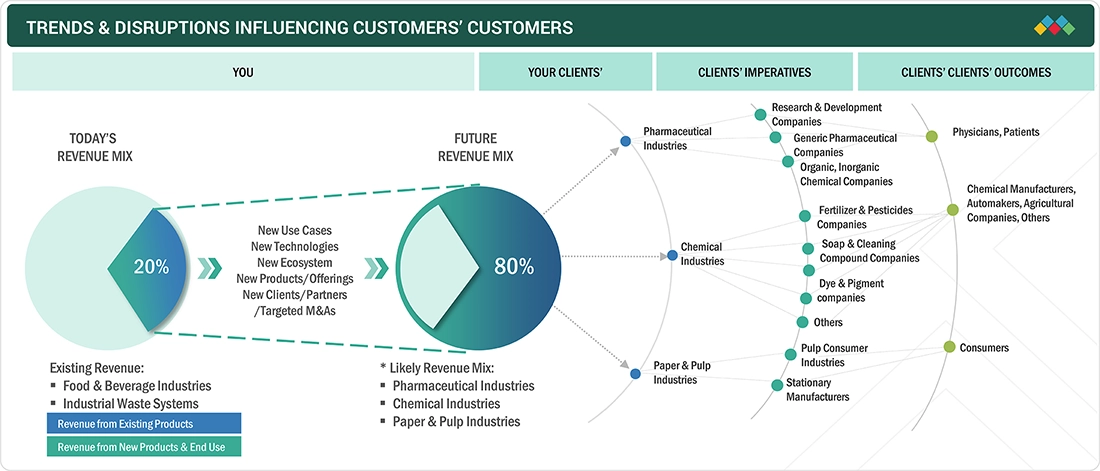
TRENDS & DISRUPTIONS IMPACTING CUSTOMERS' CUSTOMERS
Shifts in customer trends and industry disruptions directly influence the revenue performance of target end-use applications, which are the primary customers for vacuum evaporator system integrators and solution providers. When these end-use sectors experience changes in demand, process requirements, or strategic direction, their investment levels adjust accordingly. This has a cascading effect: the changing revenue streams for these end users directly impact demand for original equipment manufacturers (hotbeds), who in turn transfer this revenue influence upstream to vacuum evaporator manufacturers, ultimately shaping overall market growth and value chain dynamics.
Source: Secondary Research, Interviews with Experts, MarketsandMarkets Analysis
MARKET DYNAMICS
Level
-
Implementation of stringent environmental regulations and zero liquid discharge (ZLD) initiatives

-
Water scarcity and need for resource recovery

Level
-
High installation and operational costs of vacuum evaporators

-
Complex operation and maintenance

Level
-
Support for green chemistry initiatives

-
Technological advancements and energy-efficient designs

Level
-
Technical complexity and need for skilled labor

-
Competition from alternative technologies

Source: Secondary Research, Interviews with Experts, MarketsandMarkets Analysis
Driver: Implementation of stringent environmental regulations and zero liquid discharge (ZLD) initiatives
Environmental policies are stringent, which has led to growing developments in adopting vacuum evaporators in ZLD system applications. Increased water pollution awareness caused regulators to rapidly strengthen wastewater treatment and recycling laws, thus creating a high demand for better technologies. Vacuum evaporators provide the heart of a ZLD system, concentrating dissolved solids effectively, limiting liquid discharge, and recycling water. Chemical, pharmaceutical, food & beverage, and textile industries quickly install these systems to comply with the laws and avoid penalties. Governments and environmental bodies further support these through incentives such as technical aid and a framework for sustainable policies. Moving towards the circular water use and green workings of industries, vacuum evaporators are becoming must-haves for assistive, inexpensive, and compliant wastewater management.
Restraint: High installation and operational costs of vacuum evaporators
The capital and operating expenses connected with vacuum evaporators are a limiting factor for market growth. These systems need acquisition, installation, and integration, with far-reaching investments in purchasing besides high-priced components, especially expensive pumps, heat exchangers, and condensers, all of which contribute to initial costs at a scale that poses great problems for small- and medium-sized enterprises (SMEs). Initial costs are less significant than ongoing operational costs, which include the need to heat and maintain the vacuum, allocate time for maintenance and descaling, and adequately train skilled personnel to operate the system. These factors add to the overall costly ownership of the system, thus curtailing adoption in cost-sensitive industries. Developing countries have comparatively less capital and access to sophisticated technologies, so cheap ones, thought to be inefficient, were often in favor, thereby slowing down adoption and hampering widespread market penetration, if ever under the weight of increasing environmental compliance pressures.
Opportunity: Support for green chemistry initiatives
The vacuum evaporators market offers considerable opportunities as they parallel global tendencies towards green chemistry, which recommend sustainable industrial practices and fewer environmental hazards. As an eco-friendly solution, vacuum evaporators treat and recycle wastewater while employing minimal chemicals, thus allowing the reuse of water and recovery of some valuable by-products. This synergizes with waste reduction and conservation of resources, especially in those sectors that truly focus on green production, such as pharmaceutical, chemical, and food processing. They are cleaner and safer processes because, in their operation, fewer chemical treatments are used. This movement is supported by governments and regulatory organizations that provide incentives, file projects, and issue encouraging policies so that industries invest in pollution-prevention technologies. As industries continue their journey towards sustainability and corporate responsibilities, demand for vacuum evaporators is expected to increase, opening ample opportunities for innovation and mass acceptance.
Challenge: Technical complexity and need for skilled labor
The vacuum evaporators market faces the most pressing problem: technical complexity, requiring skilled manpower. Operating between the various advanced principles like vacuum pressure control, heat exchange, phase separation, and others, these systems need the utmost precise calibration and continuous attention from technicians. This implies that installation and maintenance should be done by technicians who have the proper know-how of thermodynamics, fluid mechanics, and automation, which is a skill rarely found in many industries and more rarely among small and medium-enterprise owners. If companies cannot find skilled people, they tend to experience improper settings, operational inefficiency, extended downtime, and increased cost: all of which discourage implementation even after the acquiring company had contemplated the benefits of the machine for the long run. Another aspect is that this issue worsens in remote areas or where resources are scarce. Thus, many companies tend to move away from vacuum evaporator investments. Tackling this barrier would require investments in workforce training, designs that ease the user experience, and remote monitoring to facilitate operations and encourage more adoption.
Vacuum Evaporators Market: COMMERCIAL USE CASES ACROSS INDUSTRIES
| COMPANY | USE CASE DESCRIPTION | BENEFITS |
|---|---|---|
 |
Treat and concentrate industrial effluents (chemical, pharma, textile, brine) to recover clean condensate for reuse and reduce or eliminate liquid discharge | Large reduction in hazardous/regulated wastewater volumes (lower disposal and permitting risk) |
 |
Gentle vacuum evaporation (often falling-film or plate evaporators) to concentrate heat-sensitive liquids like fruit juices, herbal extracts, flavors, and aroma fractions while preserving quality and aroma | Improved product quality (less thermal damage) and higher organoleptic retention |
 |
Concentrate milk, whey, or lactose feedstocks to the desired solids before spray-drying or crystallization using falling-film/plate evaporators in a vacuum to avoid scorching | Higher solids result in more efficient spray-drying and lower per-kg energy/drying cost, controlled product quality (viscosity and heat exposure managed) |
 |
Concentration of active pharmaceutical ingredient (API) slurries, removal/recovery of solvents, and final concentration steps using vacuum evaporators designed for sanitary/ATEX environments | Solvent recovery for cost savings and regulatory compliance, precise thermal control for product purity and potency |
 |
Concentrate process brines or leachates to recover salts, reduce tailings liquid, or prepare feeds for salt crystallizers. Hybrid ZLD/thermal trains are used in critical minerals and potash | Valuable salt/mineral recovery and fewer disposal liabilities, water recovery for reuse in the mine/process, lowering freshwater intake |
Logos and trademarks shown above are the property of their respective owners. Their use here is for informational and illustrative purposes only.
MARKET ECOSYSTEM
The vacuum evaporators market ecosystem consists of raw material suppliers (e.g., Arcelor Mittal, Posco), vacuum evaporators manufacturers (e.g., Veolia Water Technologies, GEA Group Aktiengesellschaft), and end users (e.g., Dow, Pepsico). Raw materials like steel are processed to form vacuum evaporators for use in various end-use industries. End users' demand for rapid adoption of zero liquid discharge (ZLD) and minimum liquid discharge (MLD) in manufacturing industries drives the growth in the vacuum evaporators market. Collaboration across the value chain is key to innovation and market growth.
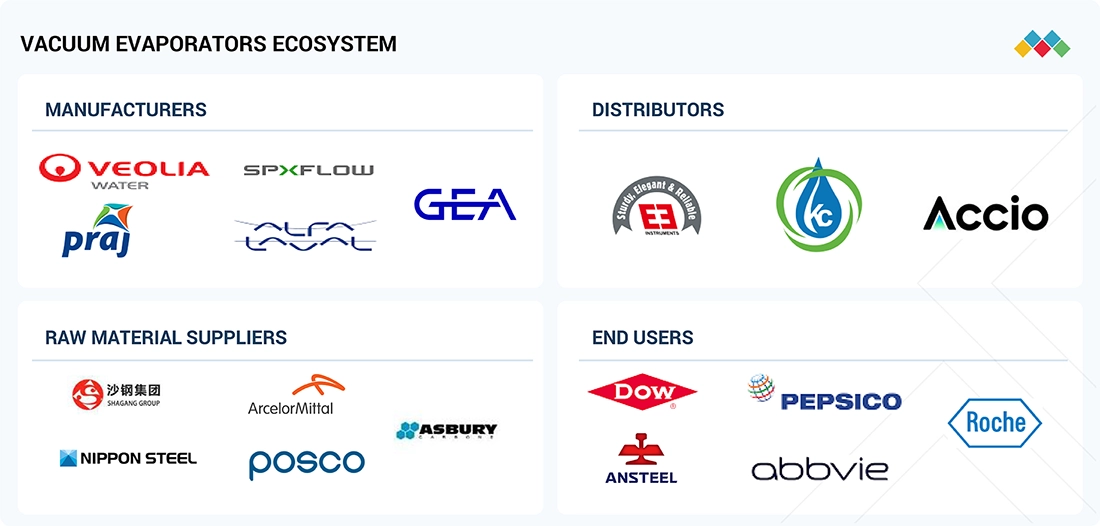
Logos and trademarks shown above are the property of their respective owners. Their use here is for informational and illustrative purposes only.
MARKET SEGMENTS
Source: Secondary Research, Interviews with Experts, MarketsandMarkets Analysis
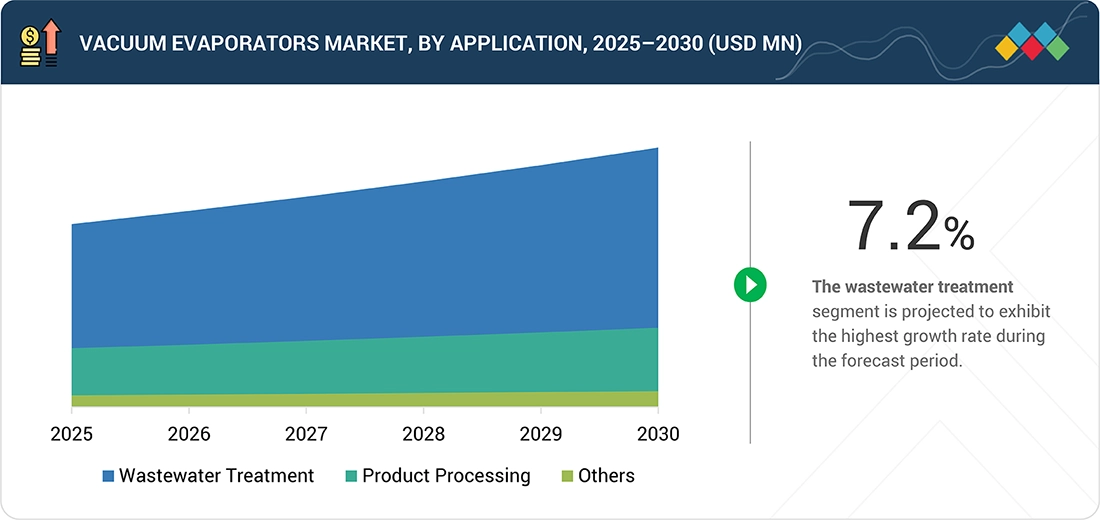
Vacuum Evaporators Market, By Application
The wastewater treatment segment is expected to grow faster in the vacuum evaporators market during the forecast period. This is mainly due to the growing global concern for water scarcity, increased volumes of industrial effluents, and stringent environmental regulations that demand proper wastewater management. Industries of all kinds (chemical, pharmaceutical, food, beverage, textile, and metal processing) are being increasingly pressured to treat, recycle, and minimize the discharge of their liquid wastes, making vacuum evaporators a prime solution. Vacuum evaporators are used to effectively concentrate and separate contaminants in very complex wastewater streams, thus facilitating high recovery of water and minimizing sludge disposal requirements. They are considered well-suited for industrial wastewater treatment due mainly to their capacity for treating streamwaters containing very high loads of dissolved solids and toxic materials. With the enactment of Zero Liquid Discharge (ZLD) in various locations, vacuum evaporators are now being considered within treatment systems for compliance purposes.
Vacuum Evaporators Market, By Technology
Based on the technology, the mechanical vapor recompression (MVR) vacuum evaporators segment is estimated to grow fastest during the forecast period. This growth may primarily be attributed to the emphasis on energy efficiency of the MVR technology and its cost advantages against the conventional evaporation means. An MVR vacuum evaporator reuses the vapor generated during the evaporation process after compressing it and then placing it back to serve as a heat source, thereby minimizing external energy consumption. This contributes substantially to operational costs by using less energy, which also means having a low-carbon footprint, and these are compelling reasons favoring its acceptance in the industry. With increasing emphasis on sustainable and energy-efficient industrial operations, MVR vacuum evaporators have become popular in the pharmaceutical, chemical, food & beverage, and wastewater treatment sectors, where the need to remove vast quantities of water must be done efficiently. Further support to the demand for MVR technology arises from the increased implementation of Zero Liquid Discharge (ZLD) systems, which maximize water recovery aided by minimal energy consumption.
REGION
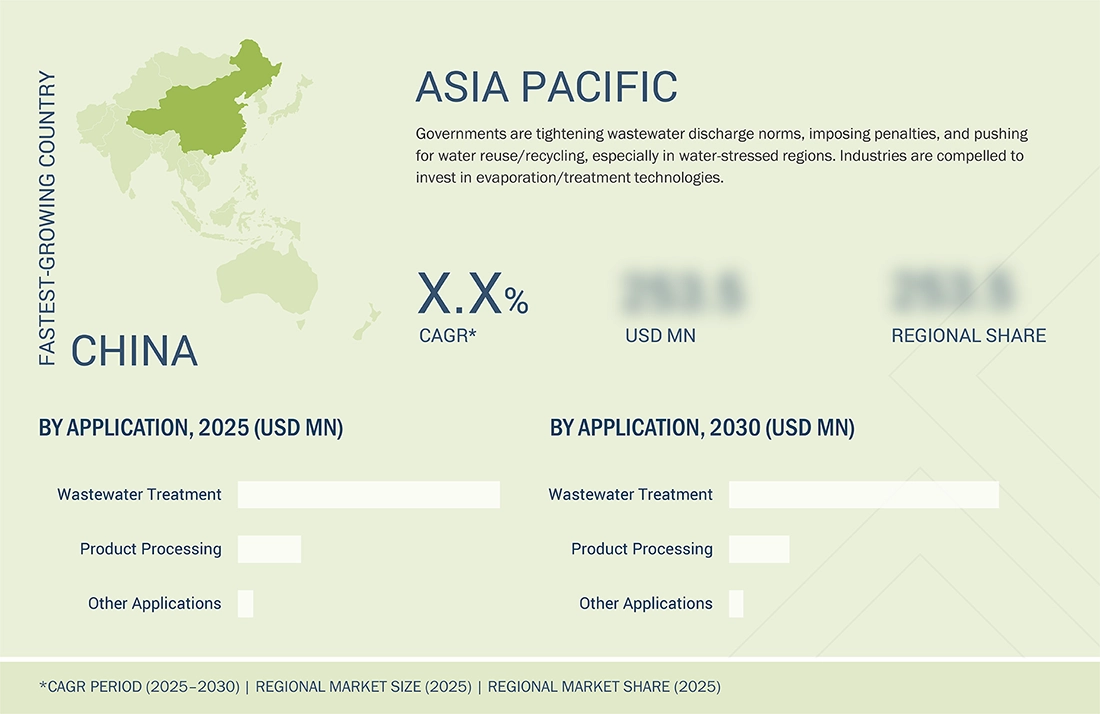
Asia Pacific is projected to be the fastest-growing market during the forecast period.
The Asia Pacific region is projected to experience the highest compound annual growth rate (CAGR) in the vacuum evaporators market during the forecast period. This growth is driven by rapid industrialization, an expanding manufacturing sector, and increasing environmental concerns in countries such as China, India, Japan, and South Korea. Industries in this region, particularly pharmaceuticals, chemicals, textiles, and electronics, generate large volumes of wastewater, leading to a heightened demand for efficient and advanced wastewater treatment technologies like vacuum evaporators. The implementation of stringent environmental regulations and wastewater discharge standards by the regional governments is one of the other reasons driving market growth. Countries such as China and India are enhancing their environmental regulatory frameworks and are promoting ZLD policies, which require industries to invest in water recycling and treatment solutions effectively. Vacuum evaporator systems fit reasonably well within the regulatory framework because they produce little waste and recover almost clean water.
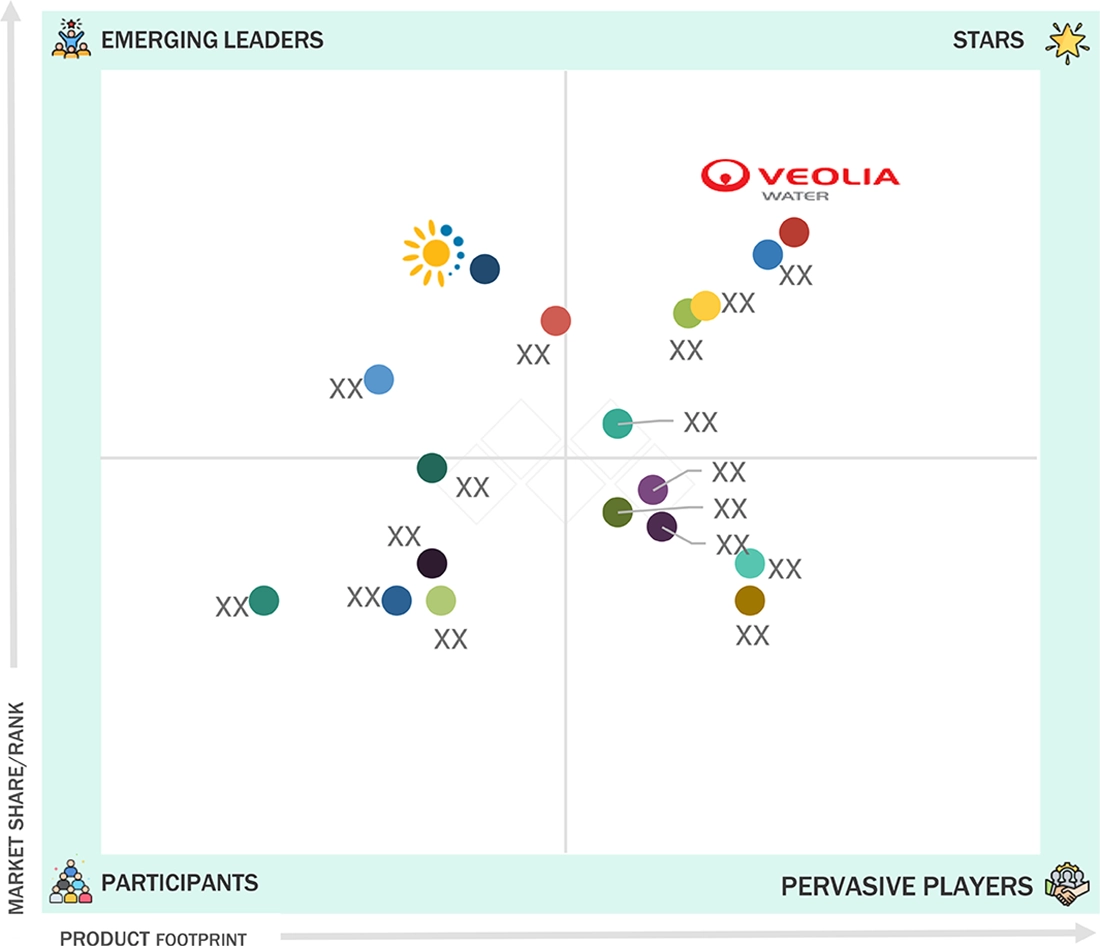
Vacuum Evaporators Market: COMPANY EVALUATION MATRIX
In the vacuum evaporators market matrix, Veolia Water Technologies (Star) leads with a strong market share and extensive product footprint, driven by its vacuum evaporators plant, which is adopted for wastewater treatment and other applications. Saltworks Technologies, Inc. (Emerging Leader) is gaining visibility with its specialized vacuum evaporator solutions for product processing applications, strengthening its position through innovation and niche product offerings. While Veolia Water Technologies dominates through scale and a diversified portfolio, Saltworks Technologies, Inc., shows significant potential to move toward the leaders’ quadrant as demand for vacuum evaporators continues to rise.
Source: Secondary Research, Interviews with Experts, MarketsandMarkets Analysis
KEY MARKET PLAYERS
- Veolia Water Technologies (France)
- Alfa Laval (Sweden)
- GEA Group AG (Germany)
- SPX Flow Inc. (US)
- Condorchem Enviro Solutions (Spain)
- Eco-Techno Srl (Italy)
- H2O GmbH (Germany)
- De Dietrich Process Systems (France)
- Bucher Unipektin (Switzerland)
- Sasakura Engineering Co., Ltd. (Japan)
- Praj Industries Ltd. (India)
- Sanshin Mfg. Co., Ltd. (Japan)
- Saltworks Technologies Inc. (Canada)
- Zhejiang Taikang Evaporator Co., Ltd (China)
- Belmar Technologies Ltd. (England)
- Hebei Leheng Energy Saving Equipment Co., Ltd. (China)
- Unitop Aquacare Limited (India)
- GMM Pfaudler (India)
MARKET SCOPE
| REPORT METRIC | DETAILS |
|---|---|
| Market Size in 2024 (Value) | USD 3.27 BN |
| Market Forecast in 2030 (Value) | USD 4.89 BN |
| CAGR (2025–2030) | 6.9% |
| Years considered | 2020–2030 |
| Base Year | 2024 |
| Forecast Period | 2025–2030 |
| Units Considered | Value (USD BN/MN) |
| Report Coverage | The report defines, segments, and projects the vacuum evaporators market based on technology, application, capacity, end-use industry, installation type, and region. It provides detailed information regarding the major factors influencing the market's growth, such as drivers, restraints, opportunities, and challenges. It strategically profiles vacuum evaporator manufacturers, comprehensively analyses their market shares and core competencies, and tracks and analyzes competitive developments they undertake in the market, such as expansions, partnerships, and new product launches. |
| Segments Covered | Technology (Heat Pump Vacuum Evaporators, Mechanical Vapor Recompression Vacuum Evaporators, Thermal Vacuum Evaporators) |
| Regions Covered | North America, Europe, Asia Pacific, South America, and Middle East & Africa |
WHAT IS IN IT FOR YOU: Vacuum Evaporators Market REPORT CONTENT GUIDE
DELIVERED CUSTOMIZATIONS
We have successfully delivered the following deep-dive customizations:
| CLIENT REQUEST | CUSTOMIZATION DELIVERED | VALUE ADDS |
|---|---|---|
| Automotive OEM (EV / Component Manufacturing) | Forecast adoption of vacuum evaporators for paint-shop wastewater & metal-finishing effluents | Secure compliance with tightening wastewater reuse and disposal standards |
| Food & Beverage Producer | Market sizing for evaporators in dairy, juice, and extract concentration | Enhance product quality with gentle concentration |
| Pharmaceutical & Chemical Producer | Benchmarking evaporator systems for solvent recovery | Meet strict regulatory requirements for hazardous waste |
| Pulp & Paper/Textiles Manufacturer | Mapping adoption of multi-effect evaporators in black liquor & dye effluents | Optimize chemical recovery and energy efficiency |
| Chemical & Raw Material Supplier | Capacity mapping of evaporator installations across APAC, EU, NA | Assess supply-demand gaps for expansion |
RECENT DEVELOPMENTS
- April 2025 : Veolia Water Technologies and Tampa Bay Water signed an agreement involving Veolia leading the design, construction, and operation of an expansion project to increase drinking water capacity for customers in the Gulf Coast region of Florida. This project expands Veolia’s activities in the US municipal water sector, provides experience with large-scale water infrastructure, and adds to its completed projects in North America.
- January 2025 : De Dietrich launched the cutting-edge short-path evaporation system engineered explicitly for vegetable oil refining. This advanced system is designed to extract high-value compounds such as squalene, sterols, tocopherols, and omega-3 fatty acids, underscoring our dedication to providing efficient, sustainable, and innovative solutions for industry.
- January 2025 : The GEA Dairy Evaporator eZero reflects GEA’s dedication to sustainability by reducing reliance on fossil fuels and supporting the transition to renewable energy. Designed to help customers operate more sustainably, this innovative system can cut energy consumption by up to 60% and reduce CO2 emissions by up to 100% compared to traditional mechanical vapor recompression (MVR) evaporators, depending on specific plant operations, resource availability, and the electricity emission factor. When powered by green electricity, the system can achieve net-zero CO2 emissions, potentially including offsetting measures based on the energy provider’s mix.
Table of Contents
 Exclusive indicates content/data unique to MarketsandMarkets and not available with any competitors.
Methodology
The study involved four main activities to estimate the current size of the Vacuum evaporators market: detailed secondary research gathered information on the market, related markets, and parent markets. The next step was to confirm these findings, assumptions, and size estimates with industry experts across the Vacuum evaporators value chain through primary research. Both top-down and bottom-up methods were used to determine the overall market size. Afterward, market segmentation and data triangulation helped estimate the sizes of segments and subsegments.
Secondary Research
Secondary sources for this research include annual reports, press releases, and investor presentations of companies; white papers; certified publications; articles by recognized authors; gold- and silver-standard websites; Vacuum evaporators manufacturing companies, regulatory bodies, trade directories, and databases. The secondary research was mainly used to gather key information about the industry’s supply chain, the main players, market classification, and segmentation based on industry trends down to the regional level. It also helped obtain information about important developments from a market-focused perspective.
Primary Research
The Vacuum evaporators market includes various stakeholders, such as raw material suppliers, technology support providers, Vacuum evaporator manufacturers, and regulatory agencies within the supply chain. To gather both qualitative and quantitative data, interviews were conducted with key sources from the market’s supply and demand sides. On the supply side, industry experts like CEOs, vice presidents, marketing directors, technology and innovation directors, and other senior executives from different companies and organizations involved in the Vacuum Evaporators Market were interviewed. On the demand side, directors, marketing heads, and purchasing managers from diverse sourcing industries were also included. The following is the breakdown of the primary respondents:

To know about the assumptions considered for the study, download the pdf brochure
Market Size Estimation
The top-down and bottom-up approaches have been used to estimate and validate the total size of the Vacuum evaporators market. These methods have also been widely applied to determine the size of various related market subsegments. The research methodology used to estimate the market size included the following:
The following segments provide details about the overall market size estimation process employed in this study:
- The key players in the market were identified through secondary research.
- The market shares in the relevant regions were determined through both primary and secondary research.
- The value chain and market size of the Vacuum evaporators market, in terms of both value and volume, were established through primary and secondary research.
- All percentage shares, splits, and breakdowns were determined using secondary sources and verified through primary sources.
- All parameters that could influence the market, covered in this study, were examined thoroughly, verified through primary research, and analyzed to produce the final quantitative and qualitative data.
- The research included studying the annual and financial reports of the top market players and interviewing industry experts, such as CEOs, VPs, directors, sales managers, and marketing executives, for key quantitative and qualitative insights.

Data Triangulation
The market was divided into several segments and sub-segments after determining the overall market size using the estimation methods described above. Data triangulation and market breakdown techniques were used wherever applicable to complete the overall market analysis and obtain precise statistics for each segment and subsegment. The data was triangulated by examining various factors and trends from both the demand and supply sides.
Market Definition
Vacuum evaporation is a competitive and efficient method used to treat aqueous effluents. The method is chosen when traditional wastewater treatment approaches are ineffective or impractical. Vacuum evaporators are among the most effective technologies for reducing and treating industrial wastewater. They are clean, safe, versatile, and have extremely low management costs. They are often a key component of zero liquid discharge systems.
The Vacuum evaporator converts wastewater into two streams: concentrated waste and high-quality water. It operates under a Vacuum, lowering the liquid effluent’s boiling point, saving energy, and boosting efficiency. There are different types of Vacuum evaporators, such as thermal Vacuum evaporators, heat pump Vacuum evaporators, and mechanical vapor recompression Vacuum evaporators. Key applications include wastewater treatment, product processing, and electroplating. Due to their various uses across different regions, Vacuum evaporators are known by different names, including Vacuum concentrators, water evaporators, Vacuum distillers, and industrial evaporators.
Stakeholders
- Raw material manufacturers
- Technology support providers<
- Manufacturers of Vacuum evaporators
- Traders, distributors, and suppliers
- Regulatory bodies and government agencies
- Research & development (R&D) institutions
- End-use industries
- Consulting firms, trade associations, and industry bodies
- Investment banks and private equity firms
Report Objectives
- To analyze and forecast the market size of the Vacuum evaporators market in terms of value and volume
- To provide detailed information regarding the major factors (drivers, restraints, challenges, and opportunities) influencing the regional market
- To analyze and forecast the global Vacuum evaporators market based on technology, application, capacity, installation type, end-use industry, and region
- To analyze the opportunities in the market for stakeholders and provide details of a competitive landscape for market leaders
- To forecast the size of various market segments based on five major regions: Asia Pacific, Europe, North America, South America, and Middle East & Africa, along with their respective key countries
- To track and analyze the competitive developments, such as acquisitions, partnerships, collaborations, agreements, and expansions in the market
- To strategically profile the key players and comprehensively analyze their market shares and core competencies
Available customizations:
With the given market data, MarketsandMarkets offers customizations according to the client-specific needs.
The following customization options are available for the report:
- Additional country-level analysis of the Vacuum evaporators market
- Profiling of additional market players (up to 5)
Product Analysis
- Product matrix, which gives a detailed comparison of the product portfolio of each company.
Key Questions Addressed by the Report
What is the key driver for the vacuum evaporators market?
The key driver is the implementation of stringent environmental regulations and zero liquid discharge (ZLD) initiatives.
Which region is expected to register the highest CAGR in the vacuum evaporators market during the forecast period?
Asia Pacific is expected to register the highest CAGR during the forecast period.
Which is the primary end-use industry for vacuum evaporators?
The primary end-use industry is the food & beverage sector, where vacuum evaporators are used for concentrating liquids (fruit juices, dairy, sauces) and for preservation by reducing water content.
Who are the major players in the vacuum evaporators market?
Major players include Veolia Water Technologies (France), SPX Flow Inc. (US), Alfa Laval (Sweden), and GEA Group AG (Germany).
What is the total CAGR expected to be recorded for the vacuum evaporators market from 2025 to 2030?
The market is expected to record a CAGR of 7.0% from 2025 to 2030.
Need a Tailored Report?
Customize this report to your needs
Get 10% FREE Customization
Customize This ReportPersonalize This Research
- Triangulate with your Own Data
- Get Data as per your Format and Definition
- Gain a Deeper Dive on a Specific Application, Geography, Customer or Competitor
- Any level of Personalization
Let Us Help You
- What are the Known and Unknown Adjacencies Impacting the Vacuum Evaporators Market
- What will your New Revenue Sources be?
- Who will be your Top Customer; what will make them switch?
- Defend your Market Share or Win Competitors
- Get a Scorecard for Target Partners

Custom Market Research Services
We Will Customise The Research For You, In Case The Report Listed Above Does Not Meet With Your Requirements
Get 10% Free CustomisationTESTIMONIALS

We at Nissan Chemicals Corporation have been clients of MarketsandMarkets for more than a year now. We recently consulted MarketsandMarkets for a study, the team at MarketsandMarkets was extremely professional and organized. The business insights were very detailed and aligned well with our expectations that really helped us formulate the Business Plans and device new strategies for development themes. MarketsandMarkets offers a unique combination of expertise and dedicated engagement model. Their research findings have helped us in designing our Pricing Strategy which will make it easier for us to predict the future sales and profits for the next ten years. We look forward to working with MarketsandMarkets in the future.
VP of Strategy & New Business Development
Leading Specialty Chemical Company
The MarketsandMarkets Engagement Model, composed of both the Knowledge Store and advisory custom research, has greatly helped us in understanding our markets and making strategic decisions. The Knowledge Store is a fast way to allow everyone in our organization to understand more about most any market they are interested in. The ability to then get custom research done and get answers to specific strategic questions and market insight has been spectacular. The Markets and Markets team feel more like colleagues than vendors and their services have helped us change our culture where statements of things like growth opportunities and competitive position are always backed by industry research.

Rich Gibson,
Director, Corporate Strategy
Milliken & Company,
Leading Industrial Manufacturer of specialty chemical, floor covering, performance and protective textile materials, and healthcaremilliken.com
MarketsandMarkets is a trusted resource that helps us to better understand markets that are near-adjacencies-whether its technology, value chain or geography. Their Knowledge Store platform provides a dashboard of markets and their characteristics which is easy to use and saves us time.
Adam Shaw,
Market Development and Strategy Manager
AdvanSix Inc. USA,
An American Leader in Chemicalswww.advansix.com
The Knowledge Store from MarketsandMarkets is a valuable tool which has helped my team acquire greater insight in to the end markets that our business serves. This has enabled us to help our company build stronger strategies throughout our planning process.
TOSHIO KINOSHITA
Senior Chif Consultion Research & Consulting Division
Mitsubishi Chemical Research Corporation,
Leading Manufacturer of Chemical Productswww.mitsubishichem-res.co.jp/en/

We recently engaged with MarketsandMarkets for a study, the team not only clearly understood our business objectives but was also extremely professional in the way they handled the entire project. The study was efficiently conducted in a phase-wise manner, and the engagement model furnished us with high-quality business insights that far exceeded our expectations at each phase. We were especially happy that MarketsandMarkets could provide us with both, an English as well as a Japanese version of the study. A special thanks to the Analyst Team and Client Services Team, whose fluency in Japanese enhanced our comfort level, as we could converse with them in our preferred language.
Independent entrepreneurs
Arrow Precision
We approached MarketsandMarkets for study on Proppants Market, and their work exceeded our expectations. The study conducted was comprehensive and enabled us to view the market through the various dimensions. In addition, the team was extraordinarily responsive throughout the process and resolved our queries on time. I strongly recommend MarketsandMarkets and will certainly consider them for additional market assessments we will need in the future.
Global engineering company, Japan
Deputy Manager,
Strategic Planning OfficeThe high-quality insights shared by the MarketsandMarkets team helped us understand the pharmaceutical plant designers in a specific geography. It also captured the risks that we may likely face in communicating with our potential partners. The study would enable us identify partners, which would impact our future growth.


Growth opportunities and latent adjacency in Vacuum Evaporators Market