
VSAT Market Size, Share & Trends

VSAT Market Size, Share and Trends by End Use (Broadband, Voice Communication, Private Network), Application (Maritime, Aviation, Automotive, Government & Defense), Frequency (L, S, C, X, Ku, Ka, Multi-Band), Network (Standard VSAT, USAT) and Region - Global Forecast to 2030


VERY SMALL APERTURE TERMINAL (VSAT) MARKET SIZE, SHARE & TRENDS
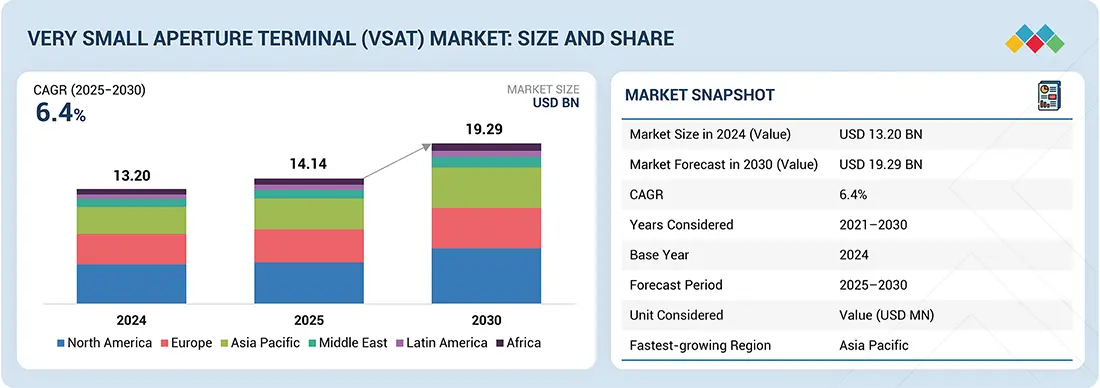
According to Marketsandmarkets, The Very Small Aperture Terminal (VSAT) Market size was valued at USD 14.14 billion in 2025 and is projected to reach USD 19.29 billion by 2030, growing at a CAGR of 6.4% from 2025 to 2030. This growth is fueled by elevated demand for high-speed internet in remote areas, government-supported broadband initiatives, HTS and LEO deployments, mobility solutions in aviation and maritime sectors, and enterprise dependence on real-time data and IoT.
MARKET SNAPSHOT TABLE
| REPORT METRIC | DETAILS |
|---|---|
| Market Size, 2025 (Value) | USD 14.14 Billion |
| Market Forecast, 2030 (Value) | USD 19.29 Billion |
| Growth Rate (2025–2030) | 6.40% From 2025 to 2030 |
| Years Considered | 2021–2030 |
| Base Year | 2024 |
| Forecast Period | 2025–2030 |
| Unit Considered | Value (USD Million) |
| Report Coverage | Revenue Forecast, Company Ranking, Competitive Landscape, Growth Factors, and Trends |
| Top Companies |
|
| Growth Driver |
|
| Segments Covered | Solution: Equipment, Connectivity Services, and Support Services; Platform: Land VSAT, Maritime VSAT, and Airborne VSAT; End Use: Broadband/Data Networks, Voice Communications, Private Network Services, Broadcast, and Others; Application: Healthcare, Ener |
| Regions Covered | North America, Europe, Asia Pacific, Middle East, Latin America, and Africa |
Market Size & Forecast
KEY TAKEAWAYS
- North America is expected to account for a 34.1% share of the VSAT market in 2025.
- By type, the standard VSAT segment is projected to grow at the fastest rate, registering a CAGR of 6.5% from 2025 to 2030.
- By solution, the support services segment is expected to dominate the market in 2025.
- By end use, the broadband and data network services segment is expected to account for the largest share of 31.6% in 2025.
- L3Harris Technologies Inc., Orbit Communication Systems Ltd., and Viasat Inc. were identified as some of the star players in the VSAT market, given their strong market share and product footprint.
- Norsat International Inc., The Marlink Group, and NSSL Global have distinguished themselves among startups and SMEs by securing strong footholds in specialized niche areas, underscoring their potential as emerging market leaders.
The future outlook for the VSAT Industry shows strong growth, driven by increased adoption in maritime, aviation, energy, and enterprise sectors, along with the rollout of HTS and LEO satellites. Government digital initiatives and the demand for secure defense networks add momentum, while advancements in Ka-/Ku-band, hybrid architectures, and ruggedized systems reinforce its role as a key driver of global connectivity and digital transformation.
Source: Secondary Research, Interviews with Experts, MarketsandMarkets Analysis
TRENDS & DISRUPTIONS IMPACTING CUSTOMERS' CUSTOMERS
The VSAT market is fueled by innovations in antenna design, significant defense and government investments, and increased demand for reliable connectivity. Adoption in both commercial and military sectors is creating new revenue opportunities for industry players. With growing remote operations and investments in secure networks, VSAT is poised to play a key role in fulfilling global connectivity needs.

Source: Secondary Research, Interviews with Experts, MarketsandMarkets Analysis
MARKET DYNAMICS
Level
-
Increased adoption of VSAT technology for crew welfare in oil & gas industry

-
Extensive use of VSAT technology in maritime industry

Level
-
Connectivity issues at sea

-
Long duration of product certification

Level
-
Growing demand for autonomous and connected vehicles

-
Increasing use of ultra-compact Ku-band VSAT for tactical UAVs

Level
-
Cybersecurity concerns

-
Radio spectrum availability issues

Source: Secondary Research, Interviews with Experts, MarketsandMarkets Analysis
Driver: Extensive use of VSAT technology in maritime industry
The maritime industry promotes VSAT adoption by increasing demand for high-speed connectivity on commercial fleets, cruise ships, naval vessels, and oil rigs. Uses include navigation, telemedicine, surveillance, and crew welfare. With HTS, hybrid satellite-LTE packages, and digital operations, VSAT provides effective communication, entertainment, and remote monitoring. Growing global shipping and offshore exploration will significantly boost usage.
Restraint: Long duration of product certification
Lengthy and complex certification processes hinder VSAT deployment, especially in aviation, defense, and emergency services. Approvals from regulators like FAA and EASA can take months or years, increasing costs and delaying launches. Frequent technology updates require re-certification, creating barriers for startups. These delays slow adoption, making collaboration among regulators, operators, and manufacturers essential to streamline certification.
Opportunity: Growing demand for autonomous and connected vehicles
Autonomous vehicles, UAVs, connected trucks, and maritime or aviation systems rely on real-time, high-bandwidth satellite communication. VSAT supports coordination, telemetry, and navigation where terrestrial networks are unavailable. Applications include defense logistics, cargo monitoring, and collision avoidance. With AI, edge computing, V2X advancements, and expanding satellite constellations, VSAT integration into connected transport ecosystems generates new revenue streams for vendors.
Challenge: Radio spectrum availability issues
Spectrum scarcity and regulatory complexities restrict VSAT scalability. Heavy use of Ku- and Ka-band causes congestion, interference, and delays. LEO constellations introduce frequency-sharing challenges with GEO satellites, while high-frequency bands are vulnerable to atmospheric interference. These problems impact service reliability and worldwide adoption. Coordinated policies, flexible spectrum models, and industry collaboration are crucial to sustain the growth of VSAT-based satellite communications.
VSAT Market: COMMERCIAL USE CASES ACROSS INDUSTRIES
| COMPANY | USE CASE DESCRIPTION | BENEFITS |
|---|---|---|
 |
Ruggedized Tactical SATCOM terminals for defense | Enables secure, rapid-deployment, multi-band VSAT in contested environments |
 |
Peregrine u8 flat-panel maritime VSAT with OneWeb | Provides compact, high-speed, low-latency connectivity at sea |
 |
Metamaterial-based lightweight antennas | Reduces drag and fuel burn while ensuring resilient multi-band performance |
 |
VSAT platforms for broadband, mobility, and backhaul | Offers GEO/LEO compatibility and lowers deployment costs |
 |
JUPITER VSAT systems for enterprise and community | Expands broadband access in underserved regions with high capacity |
 |
O3b mPOWER VSAT-enabled constellation | Delivers fiber-like, low-latency connectivity for maritime, aviation, and government |
Logos and trademarks shown above are the property of their respective owners. Their use here is for informational and illustrative purposes only.
MARKET ECOSYSTEM
The VSAT market ecosystem includes major companies, SMEs, and end users. Large firms lead innovation through research and development, while SMEs provide specialized solutions. End users, such as the military, commercial organizations, governments, and law enforcement, serve as key demand drivers that shape the industry’s growth and direction.
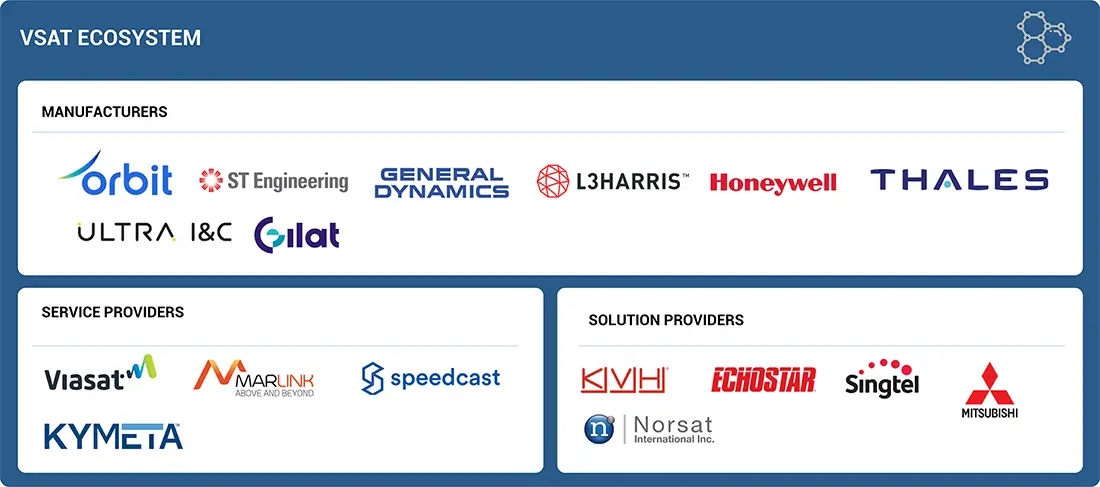
Logos and trademarks shown above are the property of their respective owners. Their use here is for informational and illustrative purposes only.
MARKET SEGMENTS
Source: Secondary Research, Interviews with Experts, MarketsandMarkets Analysis
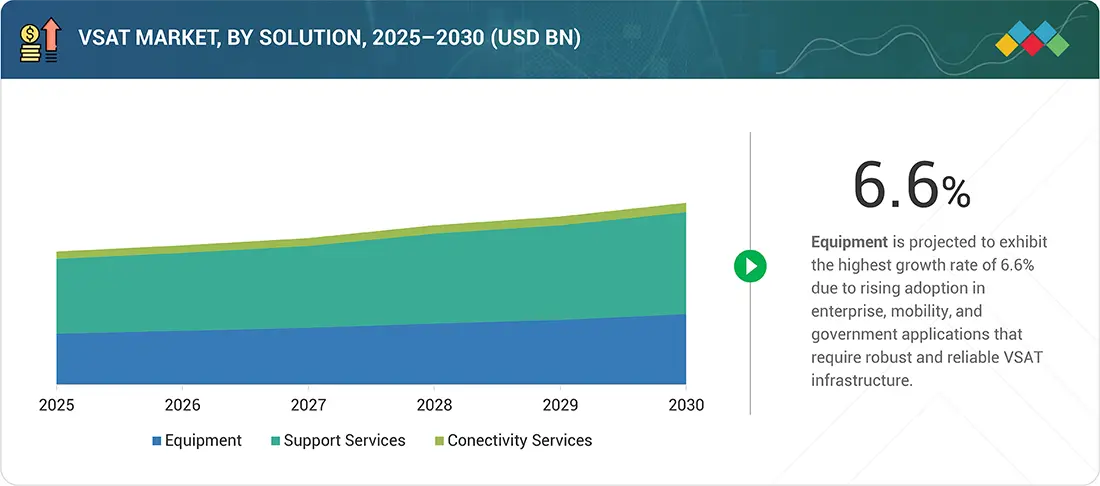
VSAT Market, By Solution
Support services hold a major share, driven by increasing demand for installation, maintenance, and network management. Reliable offerings minimize downtime, reduce costs, and guarantee continuous connectivity, making them vital for enterprises and government users.
VSAT Market, By Platform
Land VSAT leads because it is widely used in businesses, governments, and schools. Its scalability, affordability, and dependability make it the core of satellite communication, especially in rural and remote areas.
VSAT Market, By End Use
Broadband and data networks dominate the market, driven by increasing demand for high-speed, secure internet. Enterprises and governments rely on VSAT for e-governance, digital education, and secure data transfer, strengthening its role in expanding connectivity.
VSAT Market, By Frequency
Ku-band leads because of its balance of coverage, cost-effectiveness, and reliability. It is widely used for broadband, enterprise, and defense applications, with adoption growing alongside high-throughput satellites.
REGION
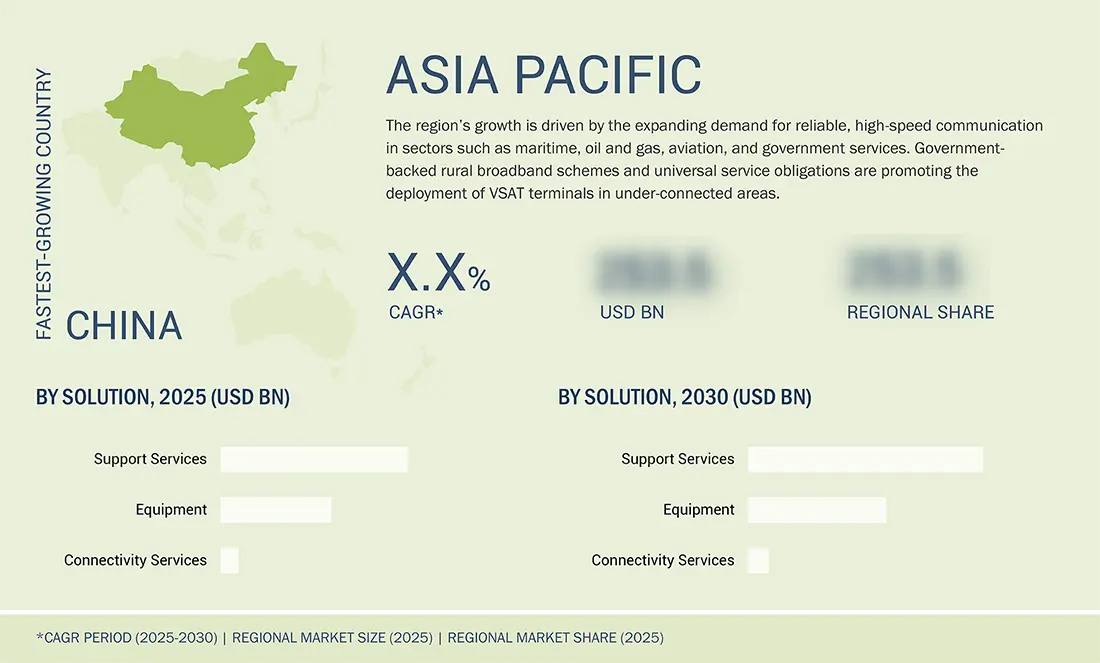
Asia Pacific to be fastest-growing region during forecast period
Asia Pacific is expected to experience the fastest growth, fueled by broadband expansion, digital transformation, and rural connectivity demands. Significant investments from India, China, and Indonesia, along with adoption in maritime, aviation, and defense sectors, and the deployment of high-throughput satellites, further position the region as a leading market.
VSAT Market: COMPANY EVALUATION MATRIX
The company evaluation matrix for the VSAT market evaluates players based on product footprint and market share. It highlights their competitive positioning and ranks them according to market strength and growth strategies. Orbit Communication is positioned as a leading player with a strong focus on advanced VSAT technologies, while Thales is recognized as an emerging leader in this market.
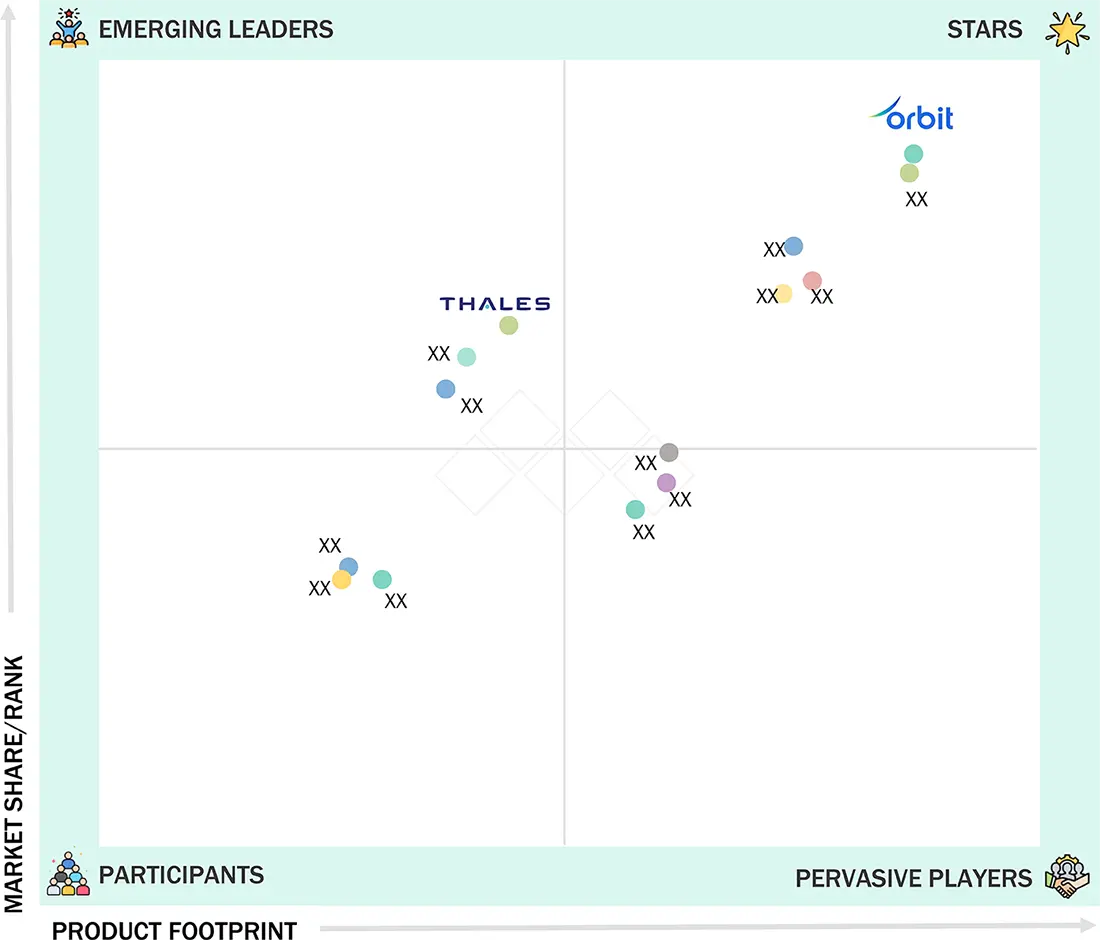
Source: Secondary Research, Interviews with Experts, MarketsandMarkets Analysis
KEY MARKET PLAYERS
List of Top VSAT Market Companies
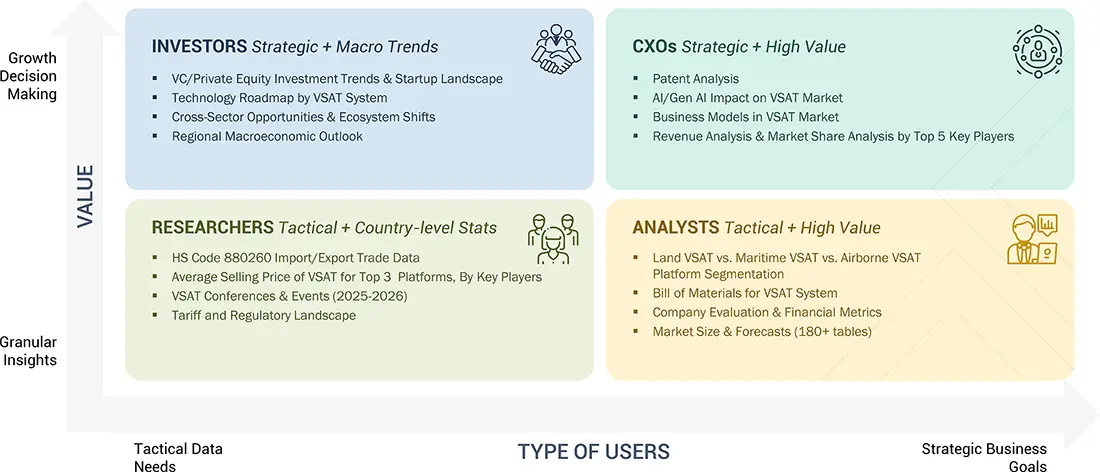
WHAT IS IN IT FOR YOU: VSAT Market REPORT CONTENT GUIDE
DELIVERED CUSTOMIZATIONS
We have successfully delivered the following deep-dive customizations:
| CLIENT REQUEST | CUSTOMIZATION DELIVERED | VALUE ADDS |
|---|---|---|
| Comprehensive VSAT Market Analysis with Focus on Military Segment | A comprehensive VSAT market study with dedicated military segment coverage, including historic and forecast analysis of market volume (Units) and value (USD Million) up to 2028. The study provided deep segmentation by vertical, platform (land, airborne, marine), technology, frequency band, design (rugged vs. non-rugged), and region, ensuring both breadth and depth of insights tailored to the client’s requirements. |
|
RECENT DEVELOPMENTS
- April 2025 : EchoStar launched the HL1100W Electronically Steerable Antenna. It is a lightweight, self-pointing, LEO-capable, ESA-approved device for the OneWeb network, enabling low-latency VSAT applications.
- April 2025 : L3Harris Technologies partnered with SES Space & Defense and Comtech Telecommunications to integrate SES’ o3b mPOWER MEO satellite capabilities into L3Harris’ Panther II VSAT terminals.
- February 2025 : L3Harris Technologies collaborated with Kuiper Government Solutions (an Amazon subsidiary) to develop integrated, hybrid satcom solutions for defense and government users.
- June 2025 : L3Harris Technologies secured a USD 60 million contract to deliver Hawkeye III Lite VSAT systems to the US Army. The 1.2-m low-profile terminals enable high-speed satellite communication, with quick reconfiguration and installation, including aircraft compatibility.
- March 2025 : Singtel partnered with Pacific International Lines to install VSAT systems on 33 vessels. The package includes Singtel’s VSAT terminals and cybersecurity solutions, enabling real-time data analytics and predictive maintenance at sea.
Table of Contents
 Exclusive indicates content/data unique to MarketsandMarkets and not available with any competitors.
Methodology
This research study involved the use of extensive secondary sources, directories, and databases (e.g., Hoovers, Bloomberg Business, Factiva, and OneSource) to identify and collect information useful for this technical, market-oriented, and commercial study of the VSAT (Very Small Aperture Terminal) market. Primary sources included several industry experts from the core and related industries and preferred suppliers, manufacturers, distributors, technology developers, IP vendors, standards, and organizations related to all the segments of this industry’s value chain. In-depth interviews were conducted with various primary respondents, including key industry participants, subject matter experts (SMEs), C-level executives of key market players, and industry consultants to obtain and verify critical qualitative and quantitative information, as well as to assess the prospects.
Secondary Research
In the secondary research process, various secondary sources were referred to for identifying and collecting information for this study. The secondary sources included annual reports, press releases, and investor presentations of companies; white papers, journals, certified publications, and articles from recognized authors; and websites, directories, and databases. Secondary research was used to obtain key information about the industry’s supply chain, the market’s value chain, major players, market classification, and segmentation according to the industry trends to the bottommost level, geographic markets, and key developments from both market- and technology-oriented perspectives. The secondary data was collected and analyzed to arrive at the overall market size, which has further been validated by primary research.
Primary Research
Extensive primary research was conducted after obtaining information about the current scenario of the VSAT market through secondary research. Several primary interviews were conducted with market experts from the demand and supply sides across North America, Europe, Asia Pacific, the Middle East, Latin America, and Africa. This primary data was collected through questionnaires, emails, and telephonic interviews.

Note: Tiers of companies are based on their revenue in 2024. Tier 1: company revenue greater than USD 1 billion; Tier 2: company revenue between USD 100 million and USD 1 billion; and Tier 3: company revenue less than USD 100 million.
To know about the assumptions considered for the study, download the pdf brochure
Market Size Estimation
Both the top-down and bottom-up approaches were used to estimate and validate the size of the VSAT market. The research methodology used to estimate the market size also includes the following details:
- Key players in the market were identified through secondary research, and their market ranking was determined through primary and secondary research. This included a study of annual and financial reports of the top market players and extensive interviews with industry experts who are knowledgeable about VSAT.
- The top-down and bottom-up approaches were used to estimate and validate the size of the global market and the dependent submarkets in the overall market.
VSAT Market : Top-Down and Bottom-Up Approach

Data Triangulation
After arriving at the overall size of the VSAT market from the estimation process explained above, the total market was split into several segments and subsegments. The data triangulation and market breakdown procedures explained below were implemented, wherever applicable, to complete the overall market engineering process and arrive at the exact statistics for various market segments and subsegments. The data was triangulated by studying various factors and trends from the demand and supply sides. Along with this, the VSAT market size was validated using the top-down and bottom-up approaches.
Market Definition
A VSAT (very small aperture terminal) is a two-way satellite ground station that uses antennas smaller than 3 meters. VSATs access high-throughput satellites (HTS), geosynchronous orbit (GEO) satellites, and low Earth orbit (LEO) and medium Earth orbit (MEO) satellites to relay data to other VSATs across the globe, transfer data from one Earth station to another, or access the internet. VSATs are also used for on-the-move (utilizing phased array antennas) or mobile maritime communications.
Key Stakeholders
- VSAT Service Providers
- VSAT Solution Providers
- VSAT Manufacturers
- Defense Procurement Agencies
- Regulatory Bodies
- R&D Companies
- System/Component Manufacturers
- System Integrators
Report Objectives
- To define, describe, segment, and forecast the size of the VSAT (Very Small Aperture Terminal) market based on solution, platform, end-use, application, frequency, network, type, design, and region
- To forecast sizes of various segments of the market with respect to four major regions: North America, Europe, Asia Pacific, the Middle East, and the Rest of the World, along with major countries in each of these regions
- To identify and analyze key drivers, restraints, opportunities, and challenges influencing the growth of the market across the globe
- To identify industry trends, market trends, and technology trends that are currently prevailing in the market
- To provide an overview of the regulatory landscape with respect to VSAT (regulations across regions
- To analyze micromarkets with respect to individual growth trends, prospects, and their contribution to the overall market
- To analyze opportunities in the market for stakeholders by identifying key market trends
- To profile key market players and comprehensively analyze their market shares and core competencies
- To analyze the degree of competition in the market by identifying key growth strategies, such as acquisitions, product launches, contracts, and partnerships, adopted by leading market players
- To identify detailed financial positions, key products, and unique selling points of leading companies in the market
- To provide a detailed competitive landscape of the market, along with market ranking analysis, market share analysis, and revenue analysis of key players
Available customizations:
Along with the market data, MarketsandMarkets offers customizations to meet the specific needs of companies. The following customization options are available for the report:
Product Analysis
- Product matrix, which gives a detailed comparison of the product portfolio of each company
Regional Analysis
- Further breakdown of the market segments at the country level
Company Information
- Detailed analysis and profiling of additional market players (up to 5)
Key Questions Addressed by the Report
What is the current size of the Very Small Aperture Terminal (VSAT) Market?
The global VSAT Market is estimated at USD 14.14 billion in 2025 and is projected to reach USD 19.29 billion by 2030.
What is the expected CAGR of the VSAT Market?
The market is expected to grow at a CAGR of 6.4% from 2025 to 2030, driven by increasing demand for satellite-based connectivity and broadband services.
What are the major growth drivers of the VSAT Market?
Key growth drivers include rising demand for high-speed internet in remote areas, government-backed broadband initiatives, expansion of high-throughput satellites (HTS), LEO satellite deployments, and increasing adoption in maritime, aviation, and defense sectors.
Which region holds the largest share of the VSAT Market?
North America is expected to account for 34.1% of the global VSAT market in 2025, supported by strong satellite communication infrastructure and defense investments.
Which region is expected to grow the fastest?
Asia Pacific is projected to be the fastest-growing region due to broadband expansion, digital transformation initiatives, rural connectivity programs, and increasing adoption across maritime, aviation, and defense applications.
Which end-use segment dominates the VSAT Market?
The Broadband & Data Network Services segment is expected to account for the largest share, representing 31.6% of the market in 2025, driven by growing enterprise and consumer demand for reliable connectivity.
Which network type is expected to grow the fastest?
The Standard VSAT segment is projected to register the highest growth rate, with a 6.5% CAGR during the forecast period, owing to its widespread use across commercial and government applications.
What are the key trends shaping the VSAT Market?
Major trends include HTS adoption, LEO satellite integration, Ka-band and Ku-band VSAT systems, hybrid satellite architectures, mobility solutions for aviation and maritime sectors, and increasing IoT-enabled satellite communications.
Who are the leading companies in the VSAT Market?
Key market participants include Orbit Communication Systems Ltd., L3Harris Technologies, Viasat Inc., Gilat Satellite Networks Ltd., EchoStar Corporation, Thales, Marlink Group, and NSSL Global.
What insights does a VSAT Market report provide?
The report provides analysis of market size, growth forecasts, solution segmentation, platform analysis, frequency band trends, application outlook, regional opportunities, competitive landscape, technological advancements, and strategic developments across the satellite communications industry.
Need a Tailored Report?
Customize this report to your needs
Get 10% FREE Customization
Customize This ReportPersonalize This Research
- Triangulate with your Own Data
- Get Data as per your Format and Definition
- Gain a Deeper Dive on a Specific Application, Geography, Customer or Competitor
- Any level of Personalization
Let Us Help You
- What are the Known and Unknown Adjacencies Impacting the VSAT Market
- What will your New Revenue Sources be?
- Who will be your Top Customer; what will make them switch?
- Defend your Market Share or Win Competitors
- Get a Scorecard for Target Partners

Custom Market Research Services
We Will Customise The Research For You, In Case The Report Listed Above Does Not Meet With Your Requirements
Get 10% Free CustomisationTESTIMONIALS


Growth opportunities and latent adjacency in VSAT Market