
4D Imaging Radar Market Size, Share & Trends

4D Imaging Radar Market Size, Share, Growth & Trends by Range (Short-Range, Medium-Range, Long-Range), Application (ADAS, Security & Surveillance, Patient Diagnostic & Monitoring, End User (Automotive, Aerospace & Defense, Healthcare, Industrial) - Global Forecast to 2030


4D IMAGING RADAR MARKET SIZE, SHARE & TRENDS
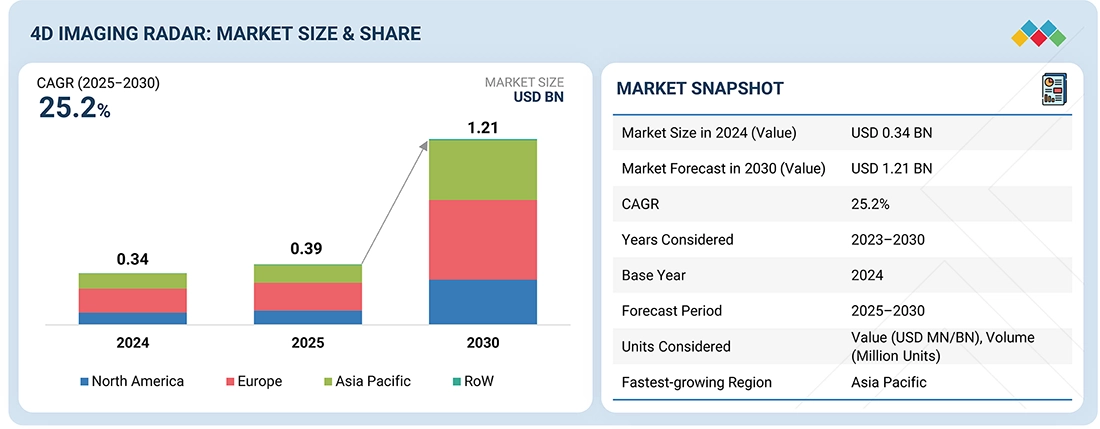
According to Marketsandmarkets, the global 4D imaging radar market size was valued at USD 0.39 billion in 2025 and is projected to reach USD 1.21 billion by 2030, growing at a CAGR of 25.2% from 2025 to 2030. The growth of the 4D imaging radar market is primarily driven by the increasing demand for enhanced vehicle safety, the rising adoption of autonomous and semi-autonomous vehicles, and advancements in sensor fusion technologies.
MARKET SNAPSHOT TABLE
| REPORT METRIC | DETAILS |
|---|---|
| Market Size in 2025 (Value) | USD 0.39 Billion |
| Market Forecast in 2030 (Value) | USD 1.21 Billion |
| Growth Rate | CAGR of 25.2% from 2025-2030 |
| Years Considered | 2023-2030 |
| Base Year | 2024 |
| Forecast Period | 2025-2030 |
| Units Considered | Value (USD Million), Volume (Million Units) |
| Report Coverage | Revenue forecast, company ranking, competitive landscape, growth factors, and trends. |
| Segments Covered |
|
| Regions Covered | North America, Asia Pacific, Europe, Rest of the World |
| Top Companies |
|
| Growth Drivers |
|
Market Size & Forecast
• 2025 Market Size: USD 0.39 Billion
• 2030 Projected Market Size: USD 1.21 Billion
• CAGR (2025-2030): 25.2%
• Short-range Radar : Highest market share
• Automotive Segment: Fastest growing market
KEY TAKEAWAYS
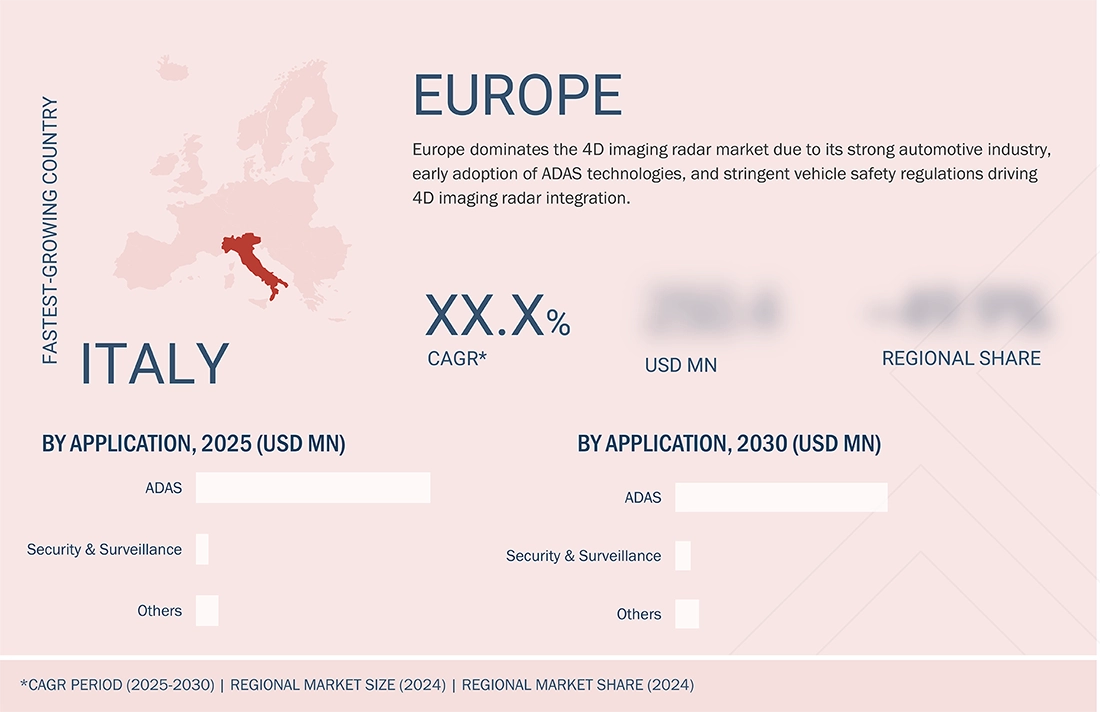
- The Europe 4D imaging radar market accounted for a 46.6% revenue share in 2024.
- By Range, short-range radar will hold the highest market share in the 4D imaging radar market in 2030.
- By application, the ADAS segment is expected to register the highest CAGR of 24.5%.
- By end user, the automotive segment is projected to grow at the fastest rate from 2025 to 2030.
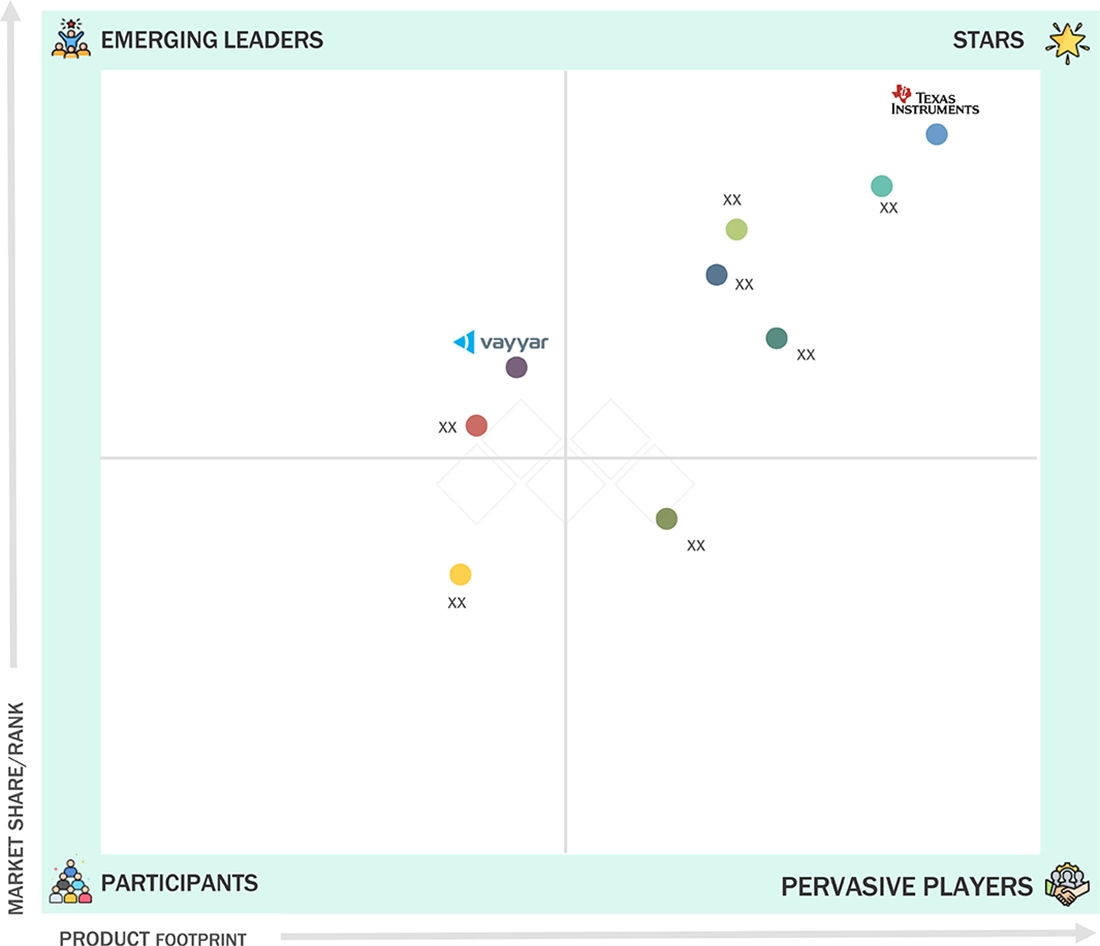
- Texas Instruments Incorporated (US), NXP Semiconductors (Netherlands), and Infineon Technologies AG (Germany) were identified as some of the star players in the 4D imaging radar market (global), given their strong market share and product footprint.
- Echodyne Corp. (US) and bitsensing Inc. (South Korea), among others, have distinguished themselves among startups and SMEs by securing strong footholds in specialized niche areas, underscoring their potential as emerging market leaders
The 4D imaging radar industry is growing due to rising demand for vehicle safety, autonomous and semi-autonomous driving, and advanced sensor fusion technologies. These radars provide high-resolution object detection and motion tracking in all weather conditions, complementing LiDAR and cameras for improved system reliability. Supportive government regulations on ADAS and autonomous systems are driving OEM investments. The adoption of 4D imaging radar is also expanding in aerospace, healthcare, and industrial automation, further boosting market growth and technology integration.
Source: Secondary Research, Interviews with Experts, MarketsandMarkets Analysis
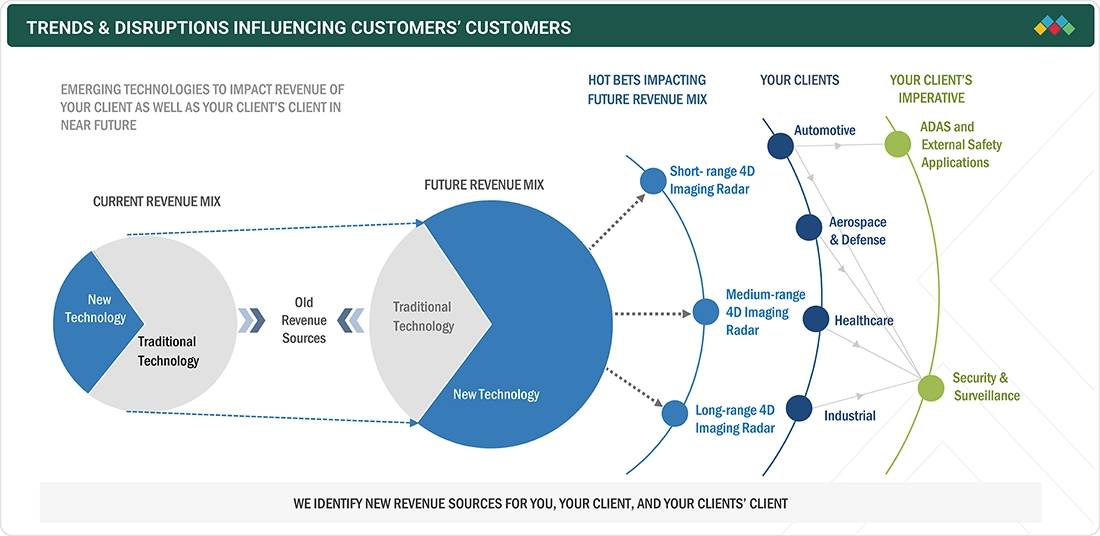
TRENDS & DISRUPTIONS IMPACTING CUSTOMERS' CUSTOMERS
In the 4D imaging radar market, short-, medium-, and long-range 4D imaging radar solutions are emerging as key growth drivers, creating opportunities across the automotive, aerospace & defense, healthcare, and industrial sectors. These technologies enable clients to address critical needs, such as advanced driver-assistance systems (ADAS), external safety applications, and security & surveillance, ultimately driving future revenue and strengthening market positioning.
Source: Secondary Research, Interviews with Experts, MarketsandMarkets Analysis
MARKET DYNAMICS
Level
-
Surge in demand for ADAS and autonomous driving features

-
Innovations in radar technology

Level
-
High cost of 4D imaging radar systems

-
Complexity of data processing and integration with existing systems

Level
-
Integration of 4D imaging radar into multi-sensor systems

-
Heightened demand for privacy-preserving sensing technologies

Level
-
Technical constraints and high-power consumption

-
Regulatory and standardization challenges

Source: Secondary Research, Interviews with Experts, MarketsandMarkets Analysis
Driver: Surge in demand for ADAS and autonomous driving features
The demand for autonomous vehicles and advanced driver-assistance systems (ADAS) is a pivotal driver accelerating the growth of the 4D imaging radar market size. As the automotive industry evolves toward higher levels of driving automation (particularly SAE Level 3 and above), automakers and technology companies are increasingly seeking robust, high-resolution sensing solutions capable of delivering real-time environmental data. Traditional radar systems, which provide basic 2D or 3D information, are outpaced by 4D imaging radar, which captures range, azimuth, elevation, and Doppler velocity.
Restraint: High cost of 4D imaging radar systems
One of the key restraints hindering the widespread adoption of 4D imaging radar is its high cost of development, production, and integration. Differing from conventional 2D or 3D radar systems, 4D imaging radar needs more transmitting and receiving antenna channels, high-performance digital signal processing units, and sophisticated computing capabilities with the ability to process massive amounts of data in real time. This complexity drives up manufacturing expense.
Opportunity: Integration of 4D imaging radar into multi-sensor systems
The integration of 4D imaging radar into multi-sensor systems, alongside LiDAR, cameras, and ultrasonic sensors, enhances autonomous vehicle perception, enabling the accurate detection, classification, and tracking of objects in real-time, even in poor visibility. Companies like Waymo, Cruise, and Tesla exemplify this trend. By improving safety, reliability, and operational efficiency, such sensor fusion can reduce accidents by up to 90%, driving demand in the 4D imaging radar market growth and establishing it as a key enabler for intelligent transportation and advanced vehicle automation.
Challenge: Technical constraints and high-power consumption
4D imaging radar systems face adoption challenges in compact, energy-constrained platforms like autonomous vehicles and drones due to technical complexity and high power consumption. Using multiple antennas, MIMO configurations, and advanced signal processing enables high-resolution, multi-dimensional imaging, but often exceeds 20 watts per module. This demands effective thermal management, limiting use in battery-dependent, embedded applications.
4D Imaging Radar Market Growth: COMMERCIAL USE CASES ACROSS INDUSTRIES
| COMPANY | USE CASE DESCRIPTION | BENEFITS |
|---|---|---|
 |
Provides 4D imaging radar sensors for advanced driver-assistance systems (ADAS), traffic monitoring, and autonomous vehicles | High-resolution object detection, improved vehicle safety, robust performance in adverse weather conditions |
 |
Offers 77 GHz 4D imaging radar solutions for automotive safety, collision avoidance, and adaptive cruise control | Enhanced accuracy in distance/velocity measurement, scalable solutions for mass-market vehicles, compliance with safety standards |
 |
Delivers radar chipsets integrated into ADAS and autonomous driving platforms for environment perception | Reliable long-range sensing, high angular resolution, energy-efficient radar ICs for next-gen mobility |
 |
Develops 4D imaging radar modules for autonomous driving, parking assistance, and blind-spot detection | Real-time situational awareness, seamless integration with vehicle safety systems, enabling higher automation levels |
|
|
Uses 4D imaging radar in combination with vision and AI for autonomous driving platforms | Redundancy to camera-based perception, improved decision-making for self-driving cars, enhanced safety in urban scenarios |
Logos and trademarks shown above are the property of their respective owners. Their use here is for informational and illustrative purposes only.
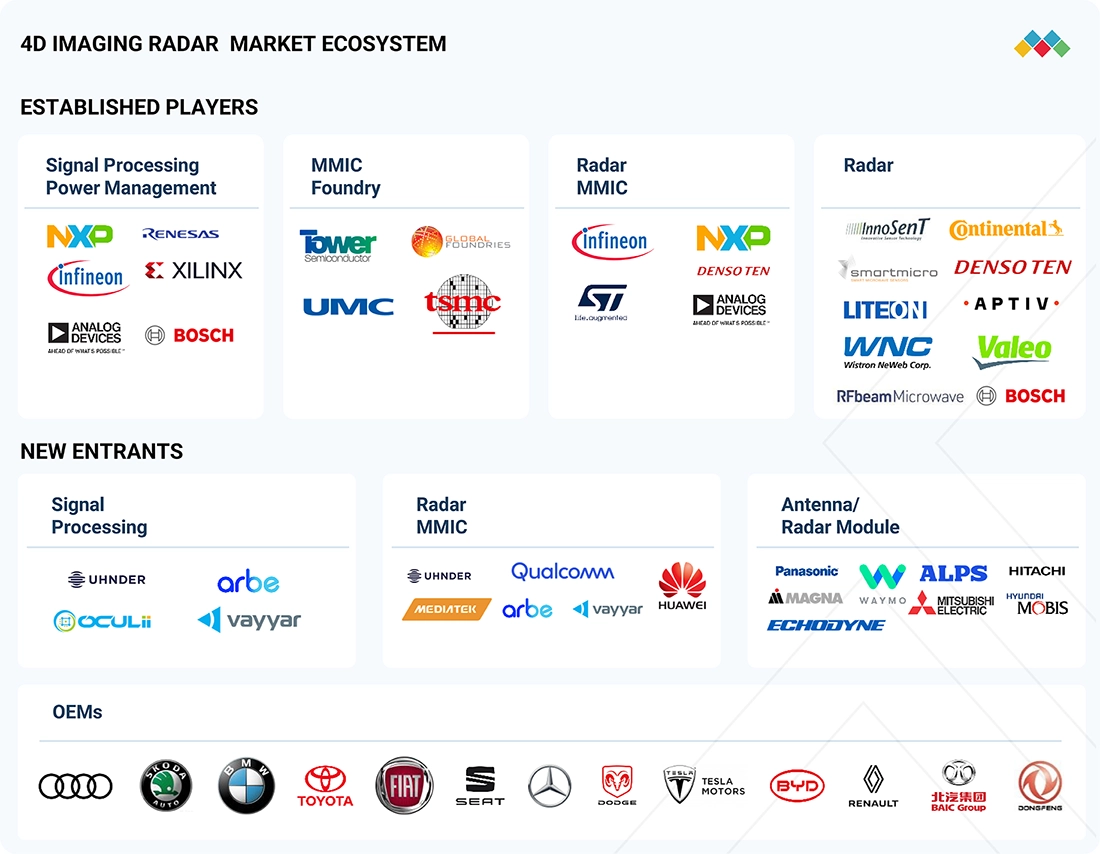
MARKET ECOSYSTEM
The 4D imaging radar companies ecosystem involves Signal Processing, Power Management, MMIC Foundry, Radar MMIC, Radar, and Original Equipment Providers. Each collaborates to advance the market by sharing knowledge, resources, and expertise to attain end innovation in this field. Manufacturers, such as Texas Instruments Incorporated (US), NXP Semiconductors (Netherlands), and Infineon Technologies AG (Germany), are at the core of the market and are responsible for developing 4D imaging radar SoCs for various applications.
Logos and trademarks shown above are the property of their respective owners. Their use here is for informational and illustrative purposes only.
MARKET SEGMENTS
Source: Secondary Research, Interviews with Experts, MarketsandMarkets Analysis
4D Imaging Radar Market, By Range
Short-range radar is expected to dominate the market in 2030. Short-range 4D radars deliver high-precision object detection and spatial awareness even in fog, rain, darkness, or direct sunlight. Companies like Arbe Robotics, Uhnder, Vayyar Imaging, Aptiv, and CUBTEK are advancing this technology, enabling compact, affordable, and software-defined radar systems for integration in automotive bumpers or industrial robots. The demand is further driven by the worldwide surge in ADAS and autonomous vehicle deployment, where reliable and accurate short-range sensing plays a critical role in safety during low-speed maneuvers and urban navigation.
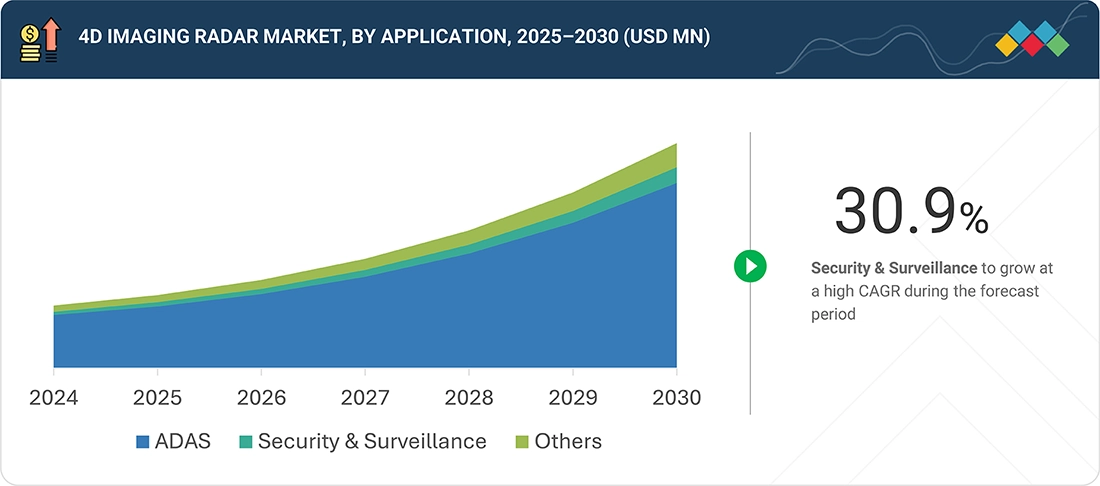
4D Imaging Radar Market, By Application
ADAS applications are expected to dominate the 4D imaging radar market due to increasing demand for advanced safety features, regulatory requirements for driver assistance systems, and growing consumer preference for enhanced driving experiences. 4D imaging radar offers accurate object detection, depth, and motion tracking, outperforming traditional sensors in poor weather and low visibility. Its integration into functions like collision avoidance, adaptive cruise control, and lane-keeping makes it essential for automakers, driving widespread adoption and market leadership.
4D Imaging Radar Market, By End User
The automotive sector will hold the largest market share in the 4D imaging radar market as automakers increasingly adopt advanced sensor technologies to enable ADAS and autonomous driving. Rising safety regulations, demand for collision avoidance, and consumer preference for enhanced driving safety are fueling adoption. 4D imaging radar’s ability to deliver high-resolution object detection, depth, and velocity tracking in all weather and lighting conditions makes it indispensable for vehicles, driving large-scale deployment, and cementing automotive as the dominant end-user segment.
REGION
Europe to hold largest market share in global 4D imaging radar market during forecast period
Europe is expected to hold the largest market share in the 4D imaging radar market share due to its strong automotive industry, strict safety regulations, and rapid adoption of advanced driver-assistance systems (ADAS). The European New Car Assessment Programme (Euro NCAP) mandates the inclusion of advanced safety features, further driving demand. Additionally, Europe’s investment in intelligent transportation infrastructure and innovation in sensor technologies positions the region as a global leader, ensuring significant adoption and market growth.
4D Imaging Radar Market Trends: COMPANY EVALUATION MATRIX
In the 4D imaging radar market matrix, Texas Instruments (Star) leads with a strong market share and an extensive product portfolio, offering high-performance 4D imaging radar chips that support ADAS, industrial automation, and smart infrastructure. Its established partnerships with leading automakers and system integrators, combined with proven scalability across short-, medium-, and long-range radar applications, reinforce its leadership position. Vayyar (Emerging Leader) is gaining prominence with innovative 4D imaging radar-on-chip solutions, enabling applications in automotive, healthcare, and security.
Source: Secondary Research, Interviews with Experts, MarketsandMarkets Analysis
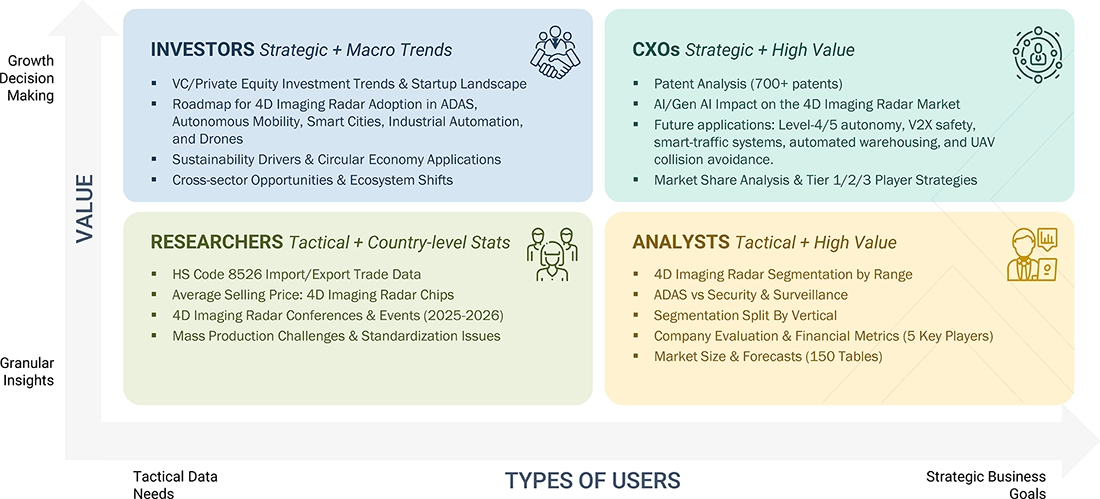
WHAT IS IN IT FOR YOU: 4D Imaging Radar Market REPORT CONTENT GUIDE
DELIVERED CUSTOMIZATIONS
We have successfully delivered the following deep-dive customizations:
| CLIENT REQUEST | CUSTOMIZATION DELIVERED | VALUE ADDS |
|---|---|---|
| Automotive OEMs (ADAS & Autonomous Vehicles) |
|
|
| Tier-1 Automotive Suppliers |
|
|
| Drone & UAV Manufacturers |
|
|
| Defense & Aerospace Agencies |
|
|
| Smart City & Infrastructure Providers |
|
|
RECENT DEVELOPMENTS
- December 224 : Infineon released final samples of its new state-of-the-art RASIC CTRX8191F, a 28nm radar MMIC enabling next-gen 4D and HD imaging radars for SAE L2+ to L4 autonomous driving. It supports a range of up to 380m with 8TX/8RX, improved SNR, low-cost waveguide antennas, and flexible waveform generation. The CARKIT development kit accelerates design with modular hardware, software tools, and multiple radar configurations.
- September 2024 : Arbe and Sensrad signed a framework agreement to supply 4D imaging radars, powered by Arbe’s chipset, to China-based Tianyi Transportation Technology. This agreement follows a year-long evaluation and implementation process of Sensrad’s radar solution, which leverages Arbe’s advanced radar chipset technology to enhance automotive safety and perception capabilities.
- April 2024 : Uhnder launched the S81 mass-market 4D imaging radar, making advanced safety features more accessible by significantly reducing costs. Using Digital Code Modulation (DCM), the compact single-chip solution lowers the barrier for ADAS adoption, bringing enhanced radar capabilities beyond high-end vehicles. With support for up to 96 MIMO channels and High Contrast Resolution (HCR), the S81 enables precise object detection, improving road safety.
Table of Contents
 Exclusive indicates content/data unique to MarketsandMarkets and not available with any competitors.
Methodology
The research process for this technical, market-oriented, and commercial study of the 4D imaging radar market included the systematic gathering, recording, and analysis of data about companies operating in the market. It involved the extensive use of secondary sources, directories, and databases (Factiva, Oanda, and OneSource) to identify and collect relevant information. In-depth interviews were conducted with various primary respondents, including experts from core and related industries and preferred manufacturers, to obtain and verify critical qualitative and quantitative information as well as to assess the growth prospects of the market. Key players in the 4D imaging radar market were identified through secondary research, and their market rankings were determined through primary and secondary research. This included studying annual reports of top players and interviewing key industry experts, such as CEOs, directors, and marketing executives.
Secondary Research
In the secondary research process, various secondary sources were used to identify and collect information for this study. These include annual reports, press releases, and investor presentations of companies, white papers, certified publications, and articles from recognized associations and government publishing sources. Research reports from a few consortiums and councils were also consulted to structure qualitative content. Secondary sources included corporate filings (such as annual reports, investor presentations, and financial statements); trade, business, and professional associations; white papers; Journals and certified publications; articles by recognized authors; gold-standard and silver-standard websites; directories; and databases. Data was also collected from secondary sources, such as the International Trade Centre (ITC) and the International Monetary Fund (IMF).
List of key secondary sources
|
Source |
Web Link |
|
Semiconductor Industry Association |
www.semiconductors.org |
|
Global Semiconductor Alliance |
www.gsaglobal.org |
|
European Semiconductor Industry Association |
www.eusemiconductors.eu |
|
The Taiwan Semiconductor Industry Association |
www.tsia.org |
|
US Department of Defense (DoD) |
www.defense.gov/ |
|
European Defence Agency (EDA) |
eda.europa.eu/ |
|
Federal Aviation Administration (FAA) |
www.faa.gov/ |
|
IEEE |
www.ieee.org |
|
Air Traffic Control Association (ATCA) |
www.atca.org/ |
Primary Research
Extensive primary research was accomplished after understanding and analyzing the 4D imaging radar market scenario through secondary research. Several primary interviews were conducted with key opinion leaders from both demand- and supply-side vendors across four major regions—North America, Europe, Asia Pacific, and RoW. Approximately 30% of the primary interviews were conducted with the demand side and 70% with the supply side. Primary data was collected through questionnaires, emails, and telephonic interviews. Various departments within organizations, such as sales, operations, and administration, were contacted to provide a holistic viewpoint in the report.

Note: Other designations include technology heads, media analysts, sales managers, marketing managers, and product managers.
The three tiers of the companies are based on their total revenues as of 2023?Tier 1: >USD 1 billion, Tier 2: USD 500 million–1 billion, and Tier 3: USD 500 million.
To know about the assumptions considered for the study, download the pdf brochure
Market Size Estimation
In the complete market engineering process, top-down and bottom-up approaches and several data triangulation methods have been used to perform the market size estimation and forecasting for the overall market segments and subsegments listed in this report. Extensive qualitative and quantitative analyses have been performed on the complete market engineering process to list key information/insights throughout the report. The following table explains the process flow of the market size estimation.
The key players in the market were identified through secondary research, and their rankings in the respective regions were determined through primary and secondary research. This entire procedure involved the study of the annual and financial reports of top players and interviews with industry experts such as chief executive officers, vice presidents, directors, and marketing executives for quantitative and qualitative key insights. All percentage shares, splits, and breakdowns were determined using secondary sources and verified through primary sources. All parameters that affect the markets covered in this research study were accounted for, viewed in extensive detail, verified through primary research, and analyzed to obtain the final quantitative and qualitative data. This data was consolidated, supplemented with detailed inputs and analysis from MarketsandMarkets, and presented in this report.
Bottom-Up Approach
- 25 companies offering 4D imaging radars were identified. Their offerings were mapped based on range, application, and end user.
- After understanding the different types of products offered by various manufacturers, the market was categorized into different segments based on the data gathered through primary and secondary sources.
- The global 4D imaging radar market size was derived through the data sanity method. For each type, the revenues of respective providers were analyzed through annual reports and press releases and summed up to derive the overall market size.
- For each company, a percentage was assigned to the overall revenue, or in some cases, to segmental revenue, to derive the revenue from the 4D imaging radar segment. The percentage for each company was assigned based on its product portfolio and range of 4D imaging radar-related offerings.
- For the projected market values, the Y-o-Y was set to show medium growth initially and high growth thereafter, considering the increasing penetration of 4D imaging radar in newer application areas.
- For the CAGR, the market trend analysis of 4D imaging radar was carried out by gauging the industry penetration rate and the demand and supply of 4D imaging radar products for different verticals.
- The estimates at every level were verified and crosschecked through discussions with key opinion leaders, including CXOs, directors, and operation managers, as well as domain experts in MarketsandMarkets.
- Various paid and unpaid information sources, such as annual reports, press releases, white papers, and databases, were studied.
Top-Down Approach
- Focusing on the top-line investment and spending made across various industry ecosystems, which are further categorized by new installations, device upgrades, and significant developments in key market areas
- Building and developing the information related to revenue generated through key products
- Carrying out multiple on-field discussions with key opinion leaders across each major company involved in the development of 4D imaging radar products
- Estimating the regional split using secondary sources, based on various factors such as the number of players in a specific country and region and types of products
4D Imaging Radar Market : Top-Down and Bottom-Up Approach

Data Triangulation
After arriving at the overall size of the 4D imaging radar market through the process explained above, the overall market has been split into several segments. Data triangulation procedures have been employed to complete the overall market engineering process and arrive at the exact statistics for all the segments, wherever applicable. The data has been triangulated by studying various factors and trends from both the demand and supply sides. The market has also been validated using both the top-down and bottom-up approaches.
Market Definition
4D imaging radar is an advanced sensor technology that enhances traditional 3D radar by adding vertical (elevation) information, enabling it to detect the height and precise position of objects. This high-resolution, long-range radar uses vertical and horizontal antenna arrays and digital beamforming to generate rich spatial data, allowing vehicles to distinguish complex roadway scenarios such as overhanging signs versus road obstacles with greater accuracy. It plays a crucial role in ADAS and autonomous driving (Levels 2–5) by improving object detection, road contour identification, and dense traffic navigation, often working in tandem with other sensors through sensor fusion.
Key Stakeholders
- Government and Defense Agencies
- Investors and Financial Institutions
- Radar System Manufacturers
- Technology & Component Suppliers
- Original Equipment Manufacturers (OEMs)
- Software & AI Solution Providers
- Regulatory Bodies
Report Objectives
- To define, describe, segment, and forecast the size of the 4D imaging radar market by range, application, end user, and region
- To forecast the size of the market segments for four major regions: North America, Europe, Asia Pacific, and RoW
- To give detailed information regarding drivers, restraints, opportunities, and challenges influencing the growth of the market
- To provide value chain analysis, ecosystem analysis, case study analysis, patent analysis, trade analysis, technology analysis, pricing analysis, key conferences and events, key stakeholders and buying criteria, Porter's five forces analysis, investment and funding scenario, and regulations pertaining to the market
- To strategically analyze micromarkets with regard to individual growth trends, prospects, and contributions to the total market
- To analyze opportunities for stakeholders by identifying high-growth segments of the market
- To strategically profile the key players, comprehensively analyze their market positions in terms of ranking and core competencies, and provide a competitive market landscape
- To analyze strategic approaches, such as product launches, acquisitions, agreements, and partnerships, in the 4D imaging radar market
Available customizations:
With the given market data, MarketsandMarkets offers customizations according to the company's specific needs. The following customization options are available for the report:
Company Information
- Detailed analysis and profiling of additional market players (up to 7)
Key Questions Addressed by the Report
What is the current size of the global 4D imaging radar market?
The global 4D imaging radar market is estimated at USD 0.39 billion in 2025. (MarketsandMarkets)
What is the projected market value of the 4D imaging radar market by 2030?
The market is projected to reach USD 1.21 billion by 2030, driven by increasing adoption in automotive, aerospace & defense, healthcare, and industrial applications. (MarketsandMarkets)
What is the expected CAGR of the 4D imaging radar market during 2025–2030?
The market is expected to grow at a CAGR of 25.2% from 2025 to 2030, making it one of the fastest-growing radar technology segments. (MarketsandMarkets)
What are the major growth drivers of the 4D imaging radar market?
Key growth drivers include rising demand for ADAS, increasing deployment of autonomous and semi-autonomous vehicles, advancements in sensor fusion technology, and stricter vehicle safety regulations globally. (MarketsandMarkets)
Which range segment holds the largest share of the 4D imaging radar market?
The short-range radar segment is expected to hold the highest market share by 2030 due to its extensive use in parking assistance, collision avoidance, and ADAS applications. (MarketsandMarkets)
Which application segment is expected to grow the fastest?
The Advanced Driver Assistance Systems (ADAS) segment is projected to register the highest CAGR of approximately 24.5% during the forecast period due to increasing vehicle safety requirements. (MarketsandMarkets)
Which end-user industry is expected to witness the highest growth?
The automotive industry is expected to be the fastest-growing end-user segment because of growing adoption of autonomous driving technologies and high-resolution sensing systems. (MarketsandMarkets)
Which region dominates the 4D imaging radar market?
Europe accounted for approximately 46.6% of the global market share in 2024 and is expected to maintain a leading position due to its strong automotive ecosystem and supportive autonomous driving regulations. (MarketsandMarkets)
Who are the leading companies operating in the 4D imaging radar market?
Key market participants include Texas Instruments Incorporated, NXP Semiconductors, Infineon Technologies AG, Robert Bosch GmbH, and Mobileye. (MarketsandMarkets)
What are the key trends and opportunities in the 4D imaging radar market?
Major trends include the development of high-resolution long-range radar, integration with AI and sensor fusion platforms, increased deployment in autonomous vehicles, and growing adoption in aerospace, healthcare, security, and industrial automation sect
Need a Tailored Report?
Customize this report to your needs
Get 10% FREE Customization
Customize This ReportPersonalize This Research
- Triangulate with your Own Data
- Get Data as per your Format and Definition
- Gain a Deeper Dive on a Specific Application, Geography, Customer or Competitor
- Any level of Personalization
Let Us Help You
- What are the Known and Unknown Adjacencies Impacting the 4D Imaging Radar Market
- What will your New Revenue Sources be?
- Who will be your Top Customer; what will make them switch?
- Defend your Market Share or Win Competitors
- Get a Scorecard for Target Partners

Custom Market Research Services
We Will Customise The Research For You, In Case The Report Listed Above Does Not Meet With Your Requirements
Get 10% Free CustomisationTESTIMONIALS

Tetsuya Ohhira
Business Development Manager-Technology Business
Nikon Corporation,
Leading Japanese MNC specializing in optics and imaging productswww.nikon.com
MarketsandMarkets™ response
is quick. Their attitude is flexible and positive. Analyst Insights are globally considered and
significant. Client Services quickly respond to our inquiry and demand. Their wide range of global
surveys help us make our strategic plan.
We hope Knowledge Store will be easier to search
for a report.
VP - Marketing & Business Development
Leading Provider of Process Control Solutions
We engaged with MarketsandMarkets on a study to perform an analysis and recommend a Go-To-Market strategy for metrology and process control in the semiconductor market. The study was tailored to our targets and needs with well-defined milestones. Our overall experience with the MarketsandMarkets team was very good throughout the project in all aspects including the analysis methodologies used, the quality and depth of primary and secondary data sets, the professionalism and flexibility of the team and the ability to meet the target schedule and milestones. We want to thank MarketsandMarkets team for a job well done.
Growth opportunities and latent adjacency in 4D Imaging Radar Market


Cameron
Apr, 2026
As a strategy lead in an automotive company, I want to understand whether 4D imaging radar can realistically replace or complement existing sensor stacks does this study provide detailed sensor fusion insights and performance comparisons?.
Ronald
Apr, 2026
Can this report help me understand how AI and edge processing are enhancing radar capabilities and what that means for long-term market differentiation.