Agricultural Lubricants Market

Agricultural Lubricants Market by Type (Mineral Oil, Synthetic, and Bio-based), Application (Engines, Gears & Transmission, Hydraulics, Greasing, and Implements), Region (Asia Pacific, North America, Europe, South America, and MEA) - Global Forecast to 2025

Report Code: CH 5816 Mar, 2020, by marketsandmarkets.com

The agricultural lubricants market is projected to reach USD 3.9 billion by 2025, at a CAGR of 5.5%. Rising farm mechanization around the world is driving the growth of the agricultural lubricants market. Expansions, joint ventures, and acquisitions, undertaken by many prominent players in the agricultural lubricants industry, are the key factors driving the growth of the agricultural lubricants market.

Governing bodies in emerging regions such as Asia-Oceania are implementing several subsidy programs for farmers. For instance, in India, the National Agricultural Development Program (NADP) provides farmers with subsidies ranging from 30% to 50% for the purchase of agricultural equipment, such as harvesters, power sprayers, paddy transplanters, threshers, tractors, power tillers, and other small equipment. This is leading to an increase in the use of modern agricultural equipment, which, in turn, is propelling the demand for agricultural lubricants and creating opportunities for its manufacturers, enabling the global expansion of their businesses.

Agricultural Lubricants Market

To know about the assumptions considered for the study, Request for Free Sample Report

Based on type, the bio-based lubricants segment of the agricultural lubricants market is projected to grow at the highest CAGR in terms of both, value and volume from 2020 to 2025.

Based on type, the bio-based lubricants segment is projected to grow at the highest CAGR in terms of both, value and volume during the forecast period. Bio-based lubricants are manufactured from plant-derived materials such as rapeseed, canola, sunflower, soybean, palm, and coconut. Some of the important and beneficial properties of bio-based lubricants are excellent lubrication, low friction coefficients, low evaporation rate, higher flash point, and high viscosity index.

Based on application, the engines segment is projected to dominate the agricultural lubricants market from 2020 to 2025 in terms of both, value and volume.

Based on end use, the agricultural lubricants market has been segmented into engines, gears & transmission, hydraulics, greasing, and implements. Based on application, the engines segment dominated the agricultural lubricants market in 2019 in terms of both, value and volume, followed by the gears & transmission segment. This large share can be attributed to the growth of the farm tractor market globally. Each tractor consists of at least one engine, and each engine has a consumption capacity of two to three liters for engine oil. No other part of the tractor consumes this amount of lubricant. Therefore, the engines application segment is the largest share of the agriculture lubricants market. The hydraulics segment is projected to record the fastest growth, witnessing a CAGR of 6.1% in terms of value, during the forecast period.

Agricultural Lubricants Market

The Asia Pacific region is projected to lead the agricultural lubricants market during the forecast period in terms of both, value and volume.

The Asia Pacific region is projected to lead the agricultural lubricants market from 2020 to 2025 in terms of both, value and volume. The demand for agricultural lubricants is increasing in Asia Pacific. The region represents the largest agricultural market worldwide, and it is also expected to witness the fastest growth. According to data provided by the UN Food and Agriculture Organization (FAO), in 2018, the population of Asia Pacific was approximately 4.3 billion and more than half of it depends on agriculture for a living. The large size of farms in the country provides benefits to the equipment market as higher capital can profitably be invested in automated technologies. The agricultural lubricant market in this region is also projected to continue its dominance in terms of both, value and volume from 2020 to 2025. The rising population and urbanization and the encouragement from Government to increase the use of farm equipment by providing subsides for the same is expected to promote the growth of the agricultural lubricants market in the region during the forecast period.

Key Market Players

Key players, such as Exxon Mobil Corporation (US), Royal Dutch Shell Plc (Netherlands), Chevron Corporation (US), Total SA (France), BP plc (UK), FUCHS PETROLUB SE (Germany), Phillips 66 (US), Exol Lubricants Limited (UK), Witham Oil & Paint Ltd (UK), Rymax Lubricants (Netherlands), Repsol SA (Spain), Cougar Lubricants International Ltd (UK), Schaeffer Manufacturing Co. (US), Pennine Lubricants Limited (UK), Frontier Performance Lubricants, Inc. (US), and Unil Lubricants (Belgium), have adopted expansions, joint ventures, acquisitions, new product launches, agreements, partnerships, contracts, and divestments as their strategies.

Please visit 360Quadrants to see the vendor listing of Top Lubricants companies

Agricultural Lubricants Market Report Scope

Report Metric

Details

Market Size Available for Years

2018–2025

Base Year Considered

2019

Forecast Period

2020–2025

Forecast Units

Value (USD Million) and Volume (KT and Tons)

Segments Covered

Type, Application, and Region

Geographies Covered

Asia Pacific, North America, Europe, Middle East & Africa, and South America

Companies Covered

Exxon Mobil Corporation (US), Royal Dutch Shell Plc (Netherlands), Chevron Corporation (US), Total SA (France), BP plc (UK), FUCHS PETROLUB SE (Germany), Phillips 66 (US), Exol Lubricants Limited (UK), Witham Oil & Paint Ltd (UK), Rymax Lubricants (Netherlands), Repsol SA (Spain), Cougar Lubricants International Ltd (UK), Schaeffer Manufacturing Co. (US), Pennine Lubricants Limited (UK), Frontier Performance Lubricants, Inc. (US), and Unil Lubricants (Belgium)—Total 16 major players covered

This research report categorizes the agricultural lubricants market based on type, application, and region.

On the basis of type, the agricultural lubricants market has been segmented as follows:

  • Mineral Oil
  • Synthetic
  • Bio-based

On the basis of Application, the agricultural lubricants market has been segmented as follows:

  • Engines
  • Gears & Transmission
  • Hydraulics
  • Greasing
  • Implements

On the basis of region, the agricultural lubricants market has been segmented as follows:

  • Asia Pacific
  • North America
  • Europe
  • Middle East & Africa
  • South America

Key Questions Addressed by the Report

  • How are the developments undertaken by various companies expected to affect the agricultural lubricants market in the mid- to long-term?
  • What are the upcoming industry end uses of agricultural lubricants?
  • What is the impact of changes in government policies on the agricultural lubricants market?
  • What is the estimated size of the agricultural lubricants market in 2020?
  • What are the different applications of agricultural lubricants?

Frequently Asked Questions (FAQ):

To speak to our analyst for a discussion on the above findings, click Speak to Analyst


TABLE OF CONTENTS

1 INTRODUCTION (Page No. - 19)
    1.1 OBJECTIVES OF THE STUDY
    1.2 MARKET DEFINITION
    1.3 SCOPE OF THE STUDY
           1.3.1 REGIONS COVERED
           1.3.2 YEARS CONSIDERED FOR THE STUDY
    1.4 CURRENCY CONSIDERED
    1.5 PACKAGE SIZE
    1.6 STAKEHOLDERS

2 RESEARCH METHODOLOGY (Page No. - 22)
    2.1 RESEARCH DATA
           2.1.1 SECONDARY DATA
                    2.1.1.1 Key secondary sources
           2.1.2 PRIMARY DATA
                    2.1.2.1 Key data from primary sources
                    2.1.2.2 Key industry insights
                    2.1.2.3 Breakdown of primary interviews
    2.2 MARKET SIZE ESTIMATION
           2.2.1 PRIMARY AND SECONDARY RESEARCH
    2.3 DATA TRIANGULATION
    2.4 RESEARCH ASSUMPTIONS AND LIMITATIONS
           2.4.1 ASSUMPTIONS
           2.4.2 LIMITATIONS

3 EXECUTIVE SUMMARY (Page No. - 30)

4 PREMIUM INSIGHTS (Page No. - 34)
    4.1 ATTRACTIVE OPPORTUNITIES IN THE AGRICULTURAL LUBRICANTS MARKET
    4.2 AGRICULTURAL LUBRICANTS MARKET, BY TYPE AND COUNTRY
    4.3 AGRICULTURAL LUBRICANTS MARKET, BY TYPE
    4.4 AGRICULTURAL LUBRICANTS MARKET, BY APPLICATION
    4.5 AGRICULTURAL LUBRICANTS MARKET GROWTH

5 MARKET OVERVIEW (Page No. - 37)
    5.1 INTRODUCTION
    5.2 MARKET DYNAMICS
           5.2.1 DRIVERS
                    5.2.1.1 Increasing labor cost and decreasing availability of agricultural labor
                    5.2.1.2 Increasing mechanization in agriculture
                    5.2.1.3 Government subsidies for agricultural equipment
           5.2.2 RESTRAINTS
                    5.2.2.1 High cost of synthetic and bio-based lubricants
           5.2.3 OPPORTUNITIES
                    5.2.3.1 Substantial scope for farm mechanization in China and India
           5.2.4 CHALLENGES
                    5.2.4.1 Skepticism among small-scale farmers about the use of advanced agricultural equipment
    5.3 PORTER’S FIVE FORCES ANALYSIS
           5.3.1 BARGAINING POWER OF SUPPLIERS
           5.3.2 THREAT OF NEW ENTRANTS
           5.3.3 THREAT OF SUBSTITUTES
           5.3.4 BARGAINING POWER OF BUYERS
           5.3.5 INTENSITY OF RIVALRY
    5.4 INDUSTRY OUTLOOK
           5.4.1 AGRICULTURE INDUSTRY

6 AGRICULTURAL LUBRICANTS MARKET, BY TYPE (Page No. - 43)
    6.1 INTRODUCTION
    6.2 MINERAL OIL LUBRICANTS
           6.2.1 LOW COST AND EASY AVAILABILITY DRIVE GROWTH OF MINERAL OIL LUBRICANTS
    6.3 SYNTHETIC LUBRICANTS
           6.3.1 ASIA PACIFIC DOMINATES SYNTHETIC LUBRICANTS SEGMENT
    6.4 BIO-BASED LUBRICANTS
           6.4.1 ENVIRONMENT-FRIENDLY NATURE OF BIO-BASED AGRICULTURAL LUBRICANTS DRIVES THEIR GROWTH

7 AGRICULTURAL LUBRICANTS MARKET, BY APPLICATION (Page No. - 49)
    7.1 INTRODUCTION
    7.2 ENGINES
           7.2.1 GROWING FARM TRACTORS MARKET FUELS CONSUMPTION OF AGRICULTURAL LUBRICANTS IN ENGINES
    7.3 GEARS & TRANSMISSION
           7.3.1 ASIA PACIFIC DOMINATES GEARS & TRANSMISSION SEGMENT
    7.4 HYDRAULICS
           7.4.1 STEADILY INCREASING WORLDWIDE FARM MECHANIZATION EXPECTED TO ENHANCE DEMAND FOR HYDRAULIC OIL
    7.5 GREASING
           7.5.1 ASIA PACIFIC IS THE LARGEST CONSUMER OF AGRICULTURAL LUBRICANTS FOR GREASING
    7.6 IMPLEMENTS
           7.6.1 ASIA PACIFIC IS PROJECTED TO GROW AT HIGHEST CAGR IN IMPLEMENTS SEGMENT

8 AGRICULTURAL LUBRICANTS MARKET, BY REGION (Page No. - 57)
    8.1 INTRODUCTION
    8.2 ASIA PACIFIC
           8.2.1 CHINA
                    8.2.1.1 China accounts for largest share in Asia Pacific agricultural lubricants market
           8.2.2 INDIA
                    8.2.2.1 India to be the fastest-growing country in Asia Pacific agricultural lubricants market
           8.2.3 JAPAN
                    8.2.3.1 Mineral oil lubricants segment estimated to lead Japanese agricultural lubricants market
           8.2.4 INDONESIA
                    8.2.4.1 Engines segment to grow at highest CAGR in Indonesian agricultural lubricants market
           8.2.5 PAKISTAN
                    8.2.5.1 Engines segment to lead agricultural lubricants market in Pakistan during the forecast period
           8.2.6 BANGLADESH
                    8.2.6.1 Hydraulics segment to grow at the highest CAGR in Bangladesh
           8.2.7 REST OF ASIA PACIFIC
    8.3 NORTH AMERICA
           8.3.1 US
                    8.3.1.1 Synthetic lubricants segment projected to grow at highest CAGR in the US agricultural lubricants market
           8.3.2 CANADA
                    8.3.2.1 Engines application segment to account for the largest share in Canada
           8.3.3 MEXICO
                    8.3.3.1 Mineral oil-based lubricants projected to lead the Mexican agricultural lubricants market
    8.4 EUROPE
           8.4.1 TURKEY
                    8.4.1.1 Turkey leads the agricultural lubricants market in Europe
           8.4.2 GERMANY
                    8.4.2.1 Mineral oil lubricants dominate the agricultural lubricants market in Germany
           8.4.3 FRANCE
                    8.4.3.1 France was the third-largest market for agricultural lubricants in 2018
           8.4.4 UK
                    8.4.4.1 Mineral oil lubricants projected to record fastest growth in the UK
           8.4.5 RUSSIA
                    8.4.5.1 Increasing demand for wheat, oats, potatoes, and legumes drives farm mechanization in Russia
           8.4.6 ITALY
                    8.4.6.1 Synthetic lubricants segment is projected to record the fastest growth in Italy
           8.4.7 POLAND
                    8.4.7.1 Growing awareness regarding mechanized farmlands contributes to market growth in Poland
           8.4.8 REST OF EUROPE
    8.5 MIDDLE EAST & AFRICA
           8.5.1 SOUTH AFRICA
                    8.5.1.1 South Africa projected to lead agricultural lubricants market in the Middle East & Africa
           8.5.2 SAUDI ARABIA
                    8.5.2.1 Gears & transmission is projected to be the second-largest application segment in Saudi Arabia
           8.5.3 EGYPT
                    8.5.3.1 Mineral oil-based lubricants account for largest share in Egypt
           8.5.4 UAE
                    8.5.4.1 Hydraulics segment projected to grow at highest CAGR in the UAE
           8.5.5 REST OF MIDDLE EAST & AFRICA
    8.6 SOUTH AMERICA
           8.6.1 BRAZIL
                    8.6.1.1 Brazil estimated to lead the agricultural lubricants market in South America
           8.6.2 ARGENTINA
                    8.6.2.1 Engines segment accounts for largest share in Argentina’s agricultural lubricants market
           8.6.3 CHILE
                    8.6.3.1 Bio-based agricultural lubricants projected to grow at highest CAGR in Chile
           8.6.4 REST OF SOUTH AMERICA

9 COMPETITIVE LANDSCAPE (Page No. - 115)
    9.1 OVERVIEW
    9.2 COMPETITIVE LANDSCAPE MAPPING, 2019
           9.2.1 VISIONARY LEADERS
           9.2.2 INNOVATORS
           9.2.3 DYNAMIC DIFFERENTIATORS
           9.2.4 EMERGING COMPANIES
    9.3 STRENGTH OF PRODUCT PORTFOLIO
    9.4 BUSINESS STRATEGY EXCELLENCE
    9.5 MARKET RANKING OF KEY PLAYERS
    9.6 COMPETITIVE SCENARIO
           9.6.1 EXPANSIONS
           9.6.2 JOINT VENTURES
           9.6.3 ACQUISITIONS
           9.6.4 NEW PRODUCT LAUNCHES
           9.6.5 AGREEMENTS
           9.6.6 PARTNERSHIPS
           9.6.7 CONTRACTS
           9.6.8 DIVESTMENTS

10 COMPANY PROFILES (Page No. - 128)
(Business Overview, Products Offered, Recent Developments, SWOT Analysis, MnM View)* 
     10.1 EXXON MOBIL CORPORATION
     10.2 ROYAL DUTCH SHELL PLC
     10.3 CHEVRON CORPORATION
     10.4 TOTAL S.A.
     10.5 BP P.L.C.
     10.6 FUCHS PETROLUB SE
     10.7 PHILLIPS 66
     10.8 EXOL LUBRICANTS LIMITED
     10.9 WITHAM OIL & PAINT LTD
     10.10 RYMAX LUBRICANTS
     10.11 REPSOL S.A.
     10.12 COUGAR LUBRICANTS INTERNATIONAL LTD
     10.13 SCHAEFFER MANUFACTURING CO.
     10.14 PENNINE LUBRICANTS LIMITED
     10.15 FRONTIER PERFORMANCE LUBRICANTS, INC.
     10.16 UNIL LUBRICANTS
     10.17 OTHER COMPANIES
             10.17.1 BAHRAIN PETROLEUM COMPANY (BAPCO)
             10.17.2 CONDAT
             10.17.3 BARDAHL MANUFACTURING CORPORATION
             10.17.4 DYADE LUBRICANTS
             10.17.5 GULF OIL LUBRICANTS INDIA LIMITED
             10.17.6 KLONDIKE LUBRICANTS
             10.17.7 LUBITEC LTD
             10.17.8 MOORLAND FUELS
             10.17.9 MORRIS LUBRICANTS
             10.17.10 NORMAC OILS LTD
             10.17.11 ROYAL PRECISION LUBRICANTS PTY LTD
             10.17.12 WISE SOLUTIONS
*Details on Business Overview, Products Offered, Recent Developments, SWOT Analysis, MnM View might not be captured in case of unlisted companies. 

11 APPENDIX (Page No. - 188)
     11.1 DISCUSSION GUIDE
     11.2 KNOWLEDGESTORE: MARKETSANDMARKETS’ SUBSCRIPTION PORTAL
     11.3 AVAILABLE CUSTOMIZATIONS
     11.4 RELATED REPORTS
     11.5 AUTHOR DETAILS


LIST OF TABLES (173 Tables)

TABLE 1 AGRICULTURAL LUBRICANTS MARKET
TABLE 2 CEREALS, TOTAL PRODUCTION, BY COUNTRY, 2014
TABLE 3 AGRICULTURAL LUBRICANTS MARKET, BY TYPE, 2018–2025 (USD MILLION)
TABLE 4 AGRICULTURAL LUBRICANTS MARKET, BY TYPE, 2018–2025 (KT)
TABLE 5 MINERAL OIL AGRICULTURAL LUBRICANTS MARKET, BY REGION, 2018–2025 (USD MILLION)
TABLE 6 MINERAL OIL AGRICULTURAL LUBRICANTS MARKET, BY REGION, 2018–2025 (KT)
TABLE 7 SYNTHETIC AGRICULTURAL LUBRICANTS MARKET, BY REGION, 2018–2025 (USD MILLION)
TABLE 8 SYNTHETIC AGRICULTURAL LUBRICANTS MARKET, BY REGION, 2018–2025 (KT)
TABLE 9 BIO-BASED AGRICULTURAL LUBRICANTS MARKET, BY REGION, 2018–2025 (USD MILLION)
TABLE 10 BIO-BASED AGRICULTURAL LUBRICANTS MARKET, BY REGION, 2018–2025 (KT)
TABLE 11 AGRICULTURAL LUBRICANTS MARKET, BY APPLICATION, 2018–2025 (USD MILLION)
TABLE 12 AGRICULTURAL LUBRICANTS MARKET, BY APPLICATION, 2018–2025 (KT)
TABLE 13 FARM TRACTORS MARKET, BY DRIVE TYPE, 2015–2022 (USD MILLION)
TABLE 14 FARM TRACTORS MARKET, BY DRIVE TYPE, 2015–2022 (THOUSAND UNITS)
TABLE 15 ENGINES: AGRICULTURAL LUBRICANTS MARKET, BY REGION, 2018–2025 (USD MILLION)
TABLE 16 ENGINES: AGRICULTURAL LUBRICANTS MARKET, BY REGION, 2018–2025 (KT)
TABLE 17 GEARS & TRANSMISSION: AGRICULTURAL LUBRICANTS MARKET, BY REGION, 2018–2025 (USD MILLION)
TABLE 18 GEARS & TRANSMISSION: AGRICULTURAL LUBRICANTS MARKET, BY REGION, 2018–2025 (KT)
TABLE 19 HYDRAULICS: AGRICULTURAL LUBRICANTS MARKET, BY REGION, 2018–2025 (USD MILLION)
TABLE 20 HYDRAULICS: AGRICULTURAL LUBRICANTS MARKET, BY REGION, 2018–2025 (KT)
TABLE 21 GREASING: AGRICULTURAL LUBRICANTS MARKET, BY REGION, 2018–2025 (USD MILLION)
TABLE 22 GREASING: AGRICULTURAL LUBRICANTS MARKET, BY REGION, 2018–2025 (KT)
TABLE 23 IMPLEMENTS: AGRICULTURAL LUBRICANTS MARKET, BY REGION, 2018–2025 (USD MILLION)
TABLE 24 IMPLEMENTS: AGRICULTURAL LUBRICANTS MARKET, BY REGION, 2018–2025 (KT)
TABLE 25 AGRICULTURAL LUBRICANTS MARKET, BY REGION, 2018–2025 (USD MILLION)
TABLE 26 AGRICULTURAL LUBRICANTS MARKET, BY REGION, 2018–2025 (KT)
TABLE 27 ASIA PACIFIC: AGRICULTURAL LUBRICANTS MARKET, BY COUNTRY, 2018–2025 (USD MILLION)
TABLE 28 ASIA PACIFIC: AGRICULTURAL LUBRICANTS MARKET, BY COUNTRY, 2018–2025 (KT)
TABLE 29 ASIA PACIFIC: AGRICULTURAL LUBRICANTS MARKET, BY TYPE, 2018–2025 (USD MILLION)
TABLE 30 ASIA PACIFIC: AGRICULTURAL LUBRICANTS MARKET, BY TYPE, 2018–2025 (KT)
TABLE 31 ASIA PACIFIC: AGRICULTURAL LUBRICANTS MARKET, BY APPLICATION, 2018–2025 (USD MILLION)
TABLE 32 ASIA PACIFIC: AGRICULTURAL LUBRICANTS MARKET, BY APPLICATION, 2018–2025 (KT)
TABLE 33 CHINA: AGRICULTURAL LUBRICANTS MARKET, BY TYPE, 2018–2025 (USD MILLION)
TABLE 34 CHINA: AGRICULTURAL LUBRICANTS MARKET, BY TYPE, 2018–2025 (KT)
TABLE 35 CHINA: AGRICULTURAL LUBRICANTS MARKET, BY APPLICATION, 2018–2025 (USD MILLION)
TABLE 36 CHINA: AGRICULTURAL LUBRICANTS MARKET, BY APPLICATION, 2018–2025 (KT)
TABLE 37 INDIA: FINANCIAL ASSISTANCE TO FARMERS FOR PROCUREMENT OF AGRICULTURAL MACHINERY AND EQUIPMENT
TABLE 38 INDIA: AGRICULTURAL LUBRICANTS MARKET, BY TYPE, 2018–2025 (USD MILLION)
TABLE 39 INDIA: AGRICULTURAL LUBRICANTS MARKET, BY TYPE, 2018–2025 (KT)
TABLE 40 INDIA: AGRICULTURAL LUBRICANTS MARKET, BY APPLICATION, 2018–2025 (USD MILLION)
TABLE 41 INDIA: AGRICULTURAL LUBRICANTS MARKET, BY APPLICATION, 2018–2025 (KT)
TABLE 42 JAPAN: AGRICULTURAL LUBRICANTS MARKET, BY TYPE, 2018–2025 (USD MILLION)
TABLE 43 JAPAN: AGRICULTURAL LUBRICANTS MARKET, BY TYPE, 2018–2025 (KT)
TABLE 44 JAPAN: AGRICULTURAL LUBRICANTS MARKET, BY APPLICATION, 2018–2025 (USD MILLION)
TABLE 45 JAPAN: AGRICULTURAL LUBRICANTS MARKET, BY APPLICATION, 2018–2025 (KT)
TABLE 46 INDONESIA: AGRICULTURAL LUBRICANTS MARKET, BY TYPE, 2018–2025 (USD MILLION)
TABLE 47 INDONESIA: AGRICULTURAL LUBRICANTS MARKET, BY TYPE, 2018–2025 (KT)
TABLE 48 INDONESIA: AGRICULTURAL LUBRICANTS MARKET, BY APPLICATION, 2018–2025 (USD MILLION)
TABLE 49 INDONESIA: AGRICULTURAL LUBRICANTS MARKET, BY APPLICATION, 2018–2025 (KT)
TABLE 50 PAKISTAN: AGRICULTURAL LUBRICANTS MARKET, BY TYPE, 2018–2025 (USD MILLION)
TABLE 51 PAKISTAN: AGRICULTURAL LUBRICANTS MARKET, BY TYPE, 2018–2025 (KT)
TABLE 52 PAKISTAN: AGRICULTURAL LUBRICANTS MARKET, BY APPLICATION, 2018–2025 (USD MILLION)
TABLE 53 PAKISTAN: AGRICULTURAL LUBRICANTS MARKET, BY APPLICATION, 2018–2025 (KT)
TABLE 54 BANGLADESH: AGRICULTURAL LUBRICANTS MARKET, BY TYPE, 2018–2025 (USD MILLION)
TABLE 55 BANGLADESH: AGRICULTURAL LUBRICANTS MARKET, BY TYPE, 2018–2025 (KT)
TABLE 56 BANGLADESH: AGRICULTURAL LUBRICANTS MARKET, BY APPLICATION, 2018–2025 (USD MILLION)
TABLE 57 BANGLADESH: AGRICULTURAL LUBRICANTS MARKET, BY APPLICATION, 2018–2025 (KT)
TABLE 58 REST OF ASIA PACIFIC: AGRICULTURAL LUBRICANTS MARKET, BY TYPE, 2018–2025 (USD MILLION)
TABLE 59 REST OF ASIA PACIFIC: AGRICULTURAL LUBRICANTS MARKET, BY TYPE, 2018–2025 (KT)
TABLE 60 REST OF ASIA PACIFIC: AGRICULTURAL LUBRICANTS MARKET, BY APPLICATION, 2018–2025 (USD MILLION)
TABLE 61 REST OF ASIA PACIFIC: AGRICULTURAL LUBRICANTS MARKET, BY APPLICATION, 2018–2025 (KT)
TABLE 62 NORTH AMERICA: AGRICULTURAL LUBRICANTS MARKET, BY COUNTRY, 2018–2025 (USD MILLION)
TABLE 63 NORTH AMERICA: AGRICULTURAL LUBRICANTS MARKET, BY COUNTRY, 2018–2025 (KT)
TABLE 64 NORTH AMERICA: AGRICULTURAL LUBRICANTS MARKET, BY TYPE, 2018–2025 (USD MILLION)
TABLE 65 NORTH AMERICA: AGRICULTURAL LUBRICANTS MARKET, BY TYPE, 2018–2025 (KT)
TABLE 66 NORTH AMERICA: AGRICULTURAL LUBRICANTS MARKET, BY APPLICATION, 2018–2025 (USD MILLION)
TABLE 67 NORTH AMERICA: AGRICULTURAL LUBRICANTS MARKET, BY APPLICATION, 2018–2025 (KT)
TABLE 68 US: AGRICULTURAL LUBRICANTS MARKET, BY TYPE, 2018–2025 (USD MILLION)
TABLE 69 US: AGRICULTURAL LUBRICANTS MARKET, BY TYPE, 2018–2025 (KT)
TABLE 70 US: AGRICULTURAL LUBRICANTS MARKET, BY APPLICATION, 2018–2025 (USD MILLION)
TABLE 71 US: AGRICULTURAL LUBRICANTS MARKET, BY APPLICATION, 2018–2025 (KT)
TABLE 72 CANADA: AGRICULTURAL LUBRICANTS MARKET, BY TYPE, 2018–2025 (USD MILLION)
TABLE 73 CANADA: AGRICULTURAL LUBRICANTS MARKET, BY TYPE, 2018–2025 (KT)
TABLE 74 CANADA: AGRICULTURAL LUBRICANTS MARKET, BY APPLICATION, 2018–2025 (USD MILLION)
TABLE 75 CANADA: AGRICULTURAL LUBRICANTS MARKET, BY APPLICATION, 2018–2025 (KT)
TABLE 76 MEXICO: AGRICULTURAL LUBRICANTS MARKET, BY TYPE, 2018–2025 (USD MILLION)
TABLE 77 MEXICO: AGRICULTURAL LUBRICANTS MARKET, BY TYPE, 2018–2025 (KT)
TABLE 78 MEXICO: AGRICULTURAL LUBRICANTS MARKET, BY APPLICATION, 2018–2025 (USD MILLION)
TABLE 79 MEXICO: AGRICULTURAL LUBRICANTS MARKET, BY APPLICATION, 2018–2025 (KT)
TABLE 80 EUROPE: AGRICULTURAL LUBRICANTS MARKET, BY COUNTRY, 2018-2025 (USD MILLION)
TABLE 81 EUROPE: AGRICULTURAL LUBRICANTS MARKET, BY COUNTRY, 2018-2025 (KT)
TABLE 82 EUROPE: AGRICULTURAL LUBRICANTS MARKET, BY TYPE, 2018-2025 (USD MILLION)
TABLE 83 EUROPE: AGRICULTURAL LUBRICANTS MARKET, BY TYPE, 2018-2025 (KT)
TABLE 84 EUROPE: AGRICULTURAL LUBRICANTS MARKET, BY APPLICATION, 2018-2025 (USD MILLION)
TABLE 85 EUROPE: AGRICULTURAL LUBRICANTS MARKET, BY APPLICATION, 2018-2025 (KT)
TABLE 86 TURKEY: AGRICULTURAL LUBRICANTS MARKET, BY TYPE, 2018-2025 (USD MILLION)
TABLE 87 TURKEY: AGRICULTURAL LUBRICANTS MARKET, BY TYPE, 2018-2025 (KT)
TABLE 88 TURKEY: AGRICULTURAL LUBRICANTS MARKET, BY APPLICATION, 2018-2025 (USD MILLION)
TABLE 89 TURKEY: AGRICULTURAL LUBRICANTS MARKET, BY APPLICATION, 2018-2025 (KT)
TABLE 90 GERMANY: AGRICULTURAL LUBRICANTS MARKET, BY TYPE, 2018-2025 (USD MILLION)
TABLE 91 GERMANY: AGRICULTURAL LUBRICANTS MARKET, BY TYPE, 2018-2025 (KT)
TABLE 92 GERMANY: AGRICULTURAL LUBRICANTS MARKET, BY APPLICATION, 2018-2025 (USD MILLION)
TABLE 93 GERMANY: AGRICULTURAL LUBRICANTS MARKET, BY APPLICATION, 2018-2025 (KT)
TABLE 94 FRANCE: AGRICULTURAL LUBRICANTS MARKET, BY TYPE, 2018-2025 (USD MILLION)
TABLE 95 FRANCE: AGRICULTURAL LUBRICANTS MARKET, BY TYPE, 2018-2025 (KT)
TABLE 96 FRANCE: AGRICULTURAL LUBRICANTS MARKET, BY APPLICATION, 2018-2025 (USD MILLION)
TABLE 97 FRANCE: AGRICULTURAL LUBRICANTS MARKET, BY APPLICATION, 2018-2025 (KT)
TABLE 98 UK: AGRICULTURAL LUBRICANTS MARKET, BY TYPE, 2018-2025 (USD MILLION)
TABLE 99 UK: AGRICULTURAL LUBRICANTS MARKET, BY TYPE, 2018-2025 (KT)
TABLE 100 UK: AGRICULTURAL LUBRICANTS MARKET, BY APPLICATION, 2018-2025 (USD MILLION)
TABLE 101 UK: AGRICULTURAL LUBRICANTS MARKET, BY APPLICATION, 2018-2025 (KT)
TABLE 102 RUSSIA: AGRICULTURAL LUBRICANTS MARKET, BY TYPE, 2018-2025 (USD MILLION)
TABLE 103 RUSSIA: AGRICULTURAL LUBRICANTS MARKET, BY TYPE, 2018-2025 (KT)
TABLE 104 RUSSIA: AGRICULTURAL LUBRICANTS MARKET, BY APPLICATION, 2018-2025 (USD MILLION)
TABLE 105 RUSSIA: AGRICULTURAL LUBRICANTS MARKET, BY APPLICATION, 2018-2025 (KT)
TABLE 106 ITALY: AGRICULTURAL LUBRICANTS MARKET, BY TYPE, 2018-2025 (USD MILLION)
TABLE 107 ITALY: AGRICULTURAL LUBRICANTS MARKET, BY TYPE, 2018-2025 (KT)
TABLE 108 ITALY: AGRICULTURAL LUBRICANTS MARKET, BY APPLICATION, 2018-2025 (USD MILLION)
TABLE 109 ITALY: AGRICULTURAL LUBRICANTS MARKET, BY APPLICATION, 2018-2025 (KT)
TABLE 110 POLAND: AGRICULTURAL LUBRICANTS MARKET, BY TYPE, 2018-2025 (USD MILLION)
TABLE 111 POLAND: AGRICULTURAL LUBRICANTS MARKET, BY TYPE, 2018-2025 (KT)
TABLE 112 POLAND: AGRICULTURAL LUBRICANT MARKET, BY APPLICATION, 2018-2025 (USD MILLION)
TABLE 113 POLAND: AGRICULTURAL LUBRICANTS MARKET, BY APPLICATION, 2018-2025 (KT)
TABLE 114 REST OF EUROPE: AGRICULTURAL LUBRICANTS MARKET, BY TYPE, 2018-2025 (USD MILLION)
TABLE 115 REST OF EUROPE: AGRICULTURAL LUBRICANTS MARKET, BY TYPE, 2018-2025 (KT)
TABLE 116 REST OF EUROPE: AGRICULTURAL LUBRICANTS MARKET, BY APPLICATION, 2018-2025 (USD MILLION)
TABLE 117 REST OF EUROPE: AGRICULTURAL LUBRICANTS MARKET, BY APPLICATION, 2018-2025 (KT)
TABLE 118 MIDDLE EAST & AFRICA: AGRICULTURAL LUBRICANTS MARKET, BY COUNTRY, 2018–2025 (USD MILLION)
TABLE 119 MIDDLE EAST & AFRICA: AGRICULTURAL LUBRICANTS MARKET, BY COUNTRY, 2018–2025 (KT)
TABLE 120 MIDDLE EAST & AFRICA: AGRICULTURAL LUBRICANTS MARKET, BY TYPE, 2018–2025 (USD MILLION)
TABLE 121 MIDDLE EAST & AFRICA: AGRICULTURAL LUBRICANTS MARKET, BY TYPE, 2018–2025 (KT)
TABLE 122 MIDDLE EAST & AFRICA: AGRICULTURAL LUBRICANTS MARKET, BY APPLICATION, 2018–2025 (USD MILLION)
TABLE 123 MIDDLE EAST & AFRICA: AGRICULTURAL LUBRICANTS MARKET, BY APPLICATION, 2018–2025 (KT)
TABLE 124 SOUTH AFRICA: AGRICULTURAL LUBRICANTS MARKET, BY TYPE, 2018–2025 (USD MILLION)
TABLE 125 SOUTH AFRICA: AGRICULTURAL LUBRICANTS MARKET, BY TYPE, 2018–2025 (KT)
TABLE 126 SOUTH AFRICA: AGRICULTURAL LUBRICANTS MARKET, BY APPLICATION, 2018–2025 (USD MILLION)
TABLE 127 SOUTH AFRICA: AGRICULTURAL LUBRICANTS MARKET, BY APPLICATION, 2018–2025 (KT)
TABLE 128 SAUDI ARABIA: AGRICULTURAL LUBRICANTS MARKET, BY TYPE, 2018–2025 (USD MILLION)
TABLE 129 SAUDI ARABIA: AGRICULTURAL LUBRICANTS MARKET, BY TYPE, 2018–2025 (KT)
TABLE 130 SAUDI ARABIA: AGRICULTURAL LUBRICANTS MARKET, BY APPLICATION, 2018–2025 (USD MILLION)
TABLE 131 SAUDI ARABIA: AGRICULTURAL LUBRICANTS MARKET, BY APPLICATION, 2018–2025 (KT)
TABLE 132 EGYPT: AGRICULTURAL LUBRICANTS MARKET, BY TYPE, 2018–2025 (USD MILLION)
TABLE 133 EGYPT: AGRICULTURAL LUBRICANTS MARKET, BY TYPE, 2018–2025 (KT)
TABLE 134 EGYPT: AGRICULTURAL LUBRICANTS MARKET, BY APPLICATION, 2018–2025 (USD MILLION)
TABLE 135 EGYPT: AGRICULTURAL LUBRICANTS MARKET, BY APPLICATION, 2018–2025 (KT)
TABLE 136 UAE: AGRICULTURAL LUBRICANTS MARKET, BY TYPE, 2018–2025 (USD MILLION)
TABLE 137 UAE: AGRICULTURAL LUBRICANTS MARKET, BY TYPE, 2018–2025 (KT)
TABLE 138 UAE: AGRICULTURAL LUBRICANTS MARKET, BY APPLICATION, 2018–2025 (USD MILLION)
TABLE 139 UAE: AGRICULTURAL LUBRICANTS MARKET, BY APPLICATION, 2018–2025 (KT)
TABLE 140 REST OF MIDDLE EAST & AFRICA: AGRICULTURAL LUBRICANTS MARKET, BY TYPE, 2018–2025 (USD MILLION)
TABLE 141 REST OF MIDDLE EAST & AFRICA: AGRICULTURAL LUBRICANTS MARKET,BY TYPE, 2018–2025 (KT)
TABLE 142 REST OF MIDDLE EAST & AFRICA: AGRICULTURAL LUBRICANTS MARKET, BY APPLICATION, 2018–2025 (USD MILLION)
TABLE 143 REST OF MIDDLE EAST & AFRICA: AGRICULTURAL LUBRICANTS MARKET, BY APPLICATION, 2018–2025 (KT)
TABLE 144 SOUTH AMERICA: AGRICULTURAL LUBRICANTS MARKET, BY COUNTRY, 2018–2025 (USD MILLION)
TABLE 145 SOUTH AMERICA: AGRICULTURAL LUBRICANTS MARKET, BY COUNTRY, 2018–2025 (KT)
TABLE 146 SOUTH AMERICA: AGRICULTURAL LUBRICANTS MARKET, BY TYPE, 2018–2025 (USD MILLION)
TABLE 147 SOUTH AMERICA: AGRICULTURAL LUBRICANTS MARKET, BY TYPE, 2018–2025 (KT)
TABLE 148 SOUTH AMERICA: AGRICULTURAL LUBRICANTS MARKET, BY APPLICATION, 2018–2025 (USD MILLION)
TABLE 149 SOUTH AMERICA: AGRICULTURAL LUBRICANTS MARKET, BY APPLICATION, 2018–2025 (KT)
TABLE 150 BRAZIL: AGRICULTURAL LUBRICANTS MARKET, BY TYPE, 2018–2025 (USD MILLION)
TABLE 151 BRAZIL: AGRICULTURAL LUBRICANTS MARKET, BY TYPE, 2018–2025 (KT)
TABLE 152 BRAZIL: AGRICULTURAL LUBRICANTS MARKET, BY APPLICATION, 2018–2025 (USD MILLION)
TABLE 153 BRAZIL: AGRICULTURAL LUBRICANTS MARKET, BY APPLICATION, 2018–2025 (KT)
TABLE 154 ARGENTINA: AGRICULTURAL LUBRICANTS MARKET, BY TYPE, 2018–2025 (USD MILLION)
TABLE 155 ARGENTINA: AGRICULTURAL LUBRICANTS MARKET, BY TYPE, 2018–2025 (KT)
TABLE 156 ARGENTINA: AGRICULTURAL LUBRICANTS MARKET, BY APPLICATION, 2018–2025 (USD MILLION)
TABLE 157 ARGENTINA: AGRICULTURAL LUBRICANTS MARKET, BY APPLICATION, 2018–2025 (KT)
TABLE 158 CHILE: AGRICULTURAL LUBRICANTS MARKET, BY TYPE, 2018–2025 (USD MILLION)
TABLE 159 CHILE: AGRICULTURAL LUBRICANTS MARKET, BY TYPE, 2018–2025 (KT)
TABLE 160 CHILE: AGRICULTURAL LUBRICANTS MARKET, BY APPLICATION, 2018–2025 (USD MILLION)
TABLE 161 CHILE: AGRICULTURAL LUBRICANTS MARKET, BY APPLICATION, 2018–2025 (KT)
TABLE 162 REST OF SOUTH AMERICA: AGRICULTURAL LUBRICANTS MARKET, BY TYPE, 2018–2025 (USD MILLION)
TABLE 163 REST OF SOUTH AMERICA: AGRICULTURAL LUBRICANTS MARKET, BY TYPE, 2018–2025 (KT)
TABLE 164 REST OF SOUTH AMERICA: AGRICULTURAL LUBRICANTS MARKET, BY APPLICATION, 2018–2025 (USD MILLION)
TABLE 165 REST OF SOUTH AMERICA: AGRICULTURAL LUBRICANTS MARKET, BY APPLICATION, 2018–2025 (KT)
TABLE 166 EXPANSIONS, 2017–2020
TABLE 167 JOINT VENTURES, 2017-2020
TABLE 168 ACQUISITIONS, 2017-2020
TABLE 169 NEW PRODUCT LAUNCHES, 2017-2020
TABLE 170 AGREEMENTS, 2017-2020
TABLE 171 PARTNERSHIPS, 2017-2020
TABLE 172 CONTRACTS, 2017-2020
TABLE 173 DIVESTMENTS, 2017-2020


LIST OF FIGURES (33 Figures)

FIGURE 1 AGRICULTURAL LUBRICANTS MARKET: RESEARCH DESIGN
FIGURE 2 MARKET SIZE ESTIMATION
FIGURE 3 MARKET SIZE ESTIMATION: BY APPLICATION
FIGURE 4 FORECAST NUMBER CALCULATION
FIGURE 5 AGRICULTURAL LUBRICANTS MARKET: DATA TRIANGULATION
FIGURE 6 MINERAL OIL LUBRICANTS PROJECTED TO BE THE LARGEST TYPE SEGMENT DURING THE FORECAST PERIOD (USD MILLION)
FIGURE 7 ENGINES PROJECTED TO BE THE LARGEST APPLICATION OF AGRICULTURAL LUBRICANTS MARKET BETWEEN 2020 AND 2025 (USD MILLION)
FIGURE 8 ASIA PACIFIC ESTIMATED TO ACCOUNT FOR THE LARGEST SHARE OFTHE AGRICULTURAL LUBRICANTS MARKET IN 2020
FIGURE 9 AGRICULTURAL LUBRICANTS MARKET IS PROJECTED TO WITNESS SLUGGISH GROWTH DURING THE FORECAST PERIOD
FIGURE 10 MINERAL OIL LUBRICANTS AND CHINA EXPECTED TO LEAD THE ASIA PACIFIC MARKET FOR AGRICULTURAL LUBRICANTS IN 2020 (KT)
FIGURE 11 MINERAL OIL SEGMENT IS PROJECTED TO LEAD AGRICULTURAL LUBRICANTS MARKET DURING THE FORECAST PERIOD (KT)
FIGURE 12 ENGINES SEGMENT IS PROJECTED TO LEAD THE AGRICULTURAL LUBRICANTS MARKET DURING THE FORECAST PERIOD (KT)
FIGURE 13 AGRICULTURAL LUBRICANTS MARKET IN ASIA PACIFIC IS PROJECTED TO GROW AT THE HIGHEST CAGR DURING THE FORECAST PERIOD (KT)
FIGURE 14 DRIVERS, RESTRAINTS, OPPORTUNITIES, AND CHALLENGES: AGRICULTURAL LUBRICANTS MARKET
FIGURE 15 AGRICULTURAL LUBRICANTS MARKET: PORTER’S FIVE FORCES ANALYSIS
FIGURE 16 MINERAL OIL SEGMENT PROJECTED TO LEAD THE AGRICULTURAL LUBRICANTS MARKET DURING THE FORECAST PERIOD (USD MILLION)
FIGURE 17 ENGINES SEGMENT PROJECTED TO LEAD THE AGRICULTURAL LUBRICANTS MARKET DURING THE FORECAST PERIOD (USD MILLION)
FIGURE 18 AGRICULTURAL LUBRICANTS MARKET, BY REGION (USD MILLION)
FIGURE 19 ASIA PACIFIC: AGRICULTURAL LUBRICANTS MARKET SNAPSHOT
FIGURE 20 NORTH AMERICA: AGRICULTURAL LUBRICANTS MARKET SNAPSHOT
FIGURE 21 EUROPE: AGRICULTURAL LUBRICANTS MARKET SNAPSHOT
FIGURE 22 COMPANIES ADOPTED BOTH ORGANIC AND INORGANIC GROWTH STRATEGIES BETWEEN JANUARY 2017 AND FEBRUARY 2020
FIGURE 23 AGRICULTURAL LUBRICANTS MARKET: COMPETITIVE LANDSCAPE MAPPING, 2019
FIGURE 24 PRODUCT PORTFOLIO ANALYSIS OF TOP PLAYERS IN AGRICULTURAL LUBRICANTS MARKET
FIGURE 25 BUSINESS STRATEGY EXCELLENCE OF TOP PLAYERS IN AGRICULTURAL LUBRICANTS MARKET
FIGURE 26 EXXON MOBIL CORPORATION: COMPANY SNAPSHOT
FIGURE 27 ROYAL DUTCH SHELL PLC: COMPANY SNAPSHOT
FIGURE 28 CHEVRON CORPORATION: COMPANY SNAPSHOT
FIGURE 29 TOTAL S.A.: COMPANY SNAPSHOT
FIGURE 30 BP P.L.C.: COMPANY SNAPSHOT
FIGURE 31 FUCHS PETROLUB SE: COMPANY SNAPSHOT
FIGURE 32 PHILLIPS 66: COMPANY SNAPSHOT
FIGURE 33 REPSOL S.A.: COMPANY SNAPSHOT

The study involved four major activities for estimating the current size of the agricultural lubricants market. Exhaustive secondary research was done to collect information on the agricultural lubricants market, its peer markets, and its parent market. The next step was to validate these findings, assumptions, and sizing with industry experts across the agricultural lubricants value chain through primary research. Both top-down and bottom-up approaches were employed to estimate the complete market size. Thereafter, market breakdown and data triangulation were used to estimate the market size of the segments and subsegments of the agricultural lubricants market.

Secondary Research

As part of the secondary research process, various secondary sources such as Hoovers, Bloomberg, BusinessWeek, and Dun & Bradstreet have been referred to for identifying and collecting information for this study. These secondary sources included annual reports, press releases & investor presentations of companies, white papers, certified publications, articles by recognized authors, authenticated directories, and databases.

Secondary research was mainly conducted to obtain key information about the supply chain of the industry, the monetary chain of the market, total pool of players, and market classification and segmentation according to industry trends to the bottom-most level, regional markets, and key developments undertaken from both market- and technology-oriented perspectives.

Primary Research

The agricultural lubricants market comprises several stakeholders, such as raw material suppliers, processors, end-product manufacturers, and regulatory organizations, in the supply chain.

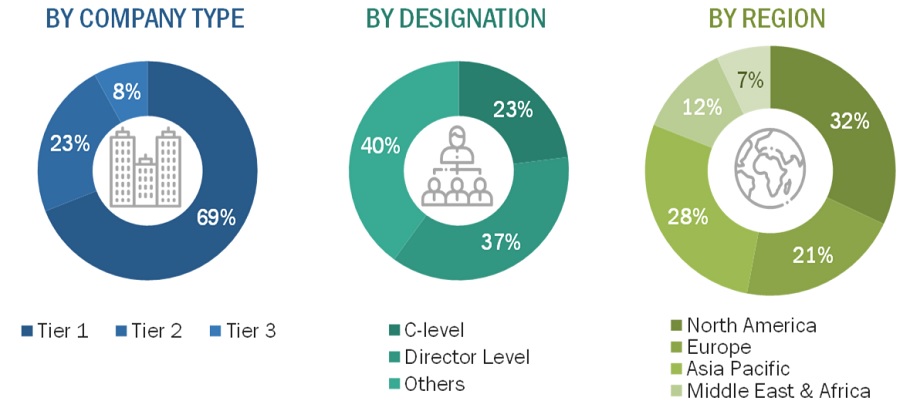
As part of the primary research process, various primary sources from both supply and demand sides were interviewed to obtain qualitative and quantitative information for this report on the agricultural lubricants market. Primary sources from the supply side included industry experts, such as Chief Executive Officers (CEOs), vice presidents, marketing directors, technology and innovation directors, and related key executives from various key companies and organizations operating in the agricultural lubricants market. Primary sources from the demand side included directors, marketing heads, and purchase managers from various end-use industries. Following is the breakdown of the primary respondents.

Agricultural Lubricants Market

To know about the assumptions considered for the study, download the pdf brochure

Market Size Estimation

Both top-down and bottom-up approaches were used to estimate and validate the total size of the agricultural lubricants market. These methods were also used extensively to estimate the size of the various segments and subsegments of the market. The research methodology used to estimate the market size includes the following:

  • The key players in the industry and markets were identified through extensive secondary research.
  • The industry’s supply chain and market size, in terms of value and volume, have been determined through primary and secondary research processes.
  • All percentage shares, splits, and breakdowns have been determined using secondary sources and verified through primary sources.

Data Triangulation

After arriving at the overall market size using the market size estimation processes as explained above, the market was split into several segments and subsegments. In order to complete the overall market engineering process and arrive at the exact statistics of each market segment and subsegment, data triangulation and market breakdown procedures were employed wherever applicable. The data was triangulated by studying various factors and trends from both, demand and supply sides. In addition to this, the market size was validated using both top-down and bottom-up approaches.

Report Objectives

  • To analyze and forecast the size of the global agricultural lubricants market in terms of value and volume
  • To define, segment, and estimate the global agricultural lubricants market by type, application, and region
  • To project the size of the market segments in terms of volume and value with respect to five main regions; namely, Asia Pacific, North America, Europe, Middle East & Africa, and South America
  • To provide detailed information regarding the crucial factors that influence the growth of the market (drivers, restraints, opportunities, and challenges)
  • To analyze opportunities for stakeholders in the agricultural lubricants market and provide a competitive landscape of the market
  • To analyze competitive developments, such as expansions, joint ventures, acquisitions, new product launches, agreements, partnerships, contracts, and divestments, in the agricultural lubricants market
  • To strategically profile key players and comprehensively analyze their market share and core competencies

Available Customizations

With the given market data, MarketsandMarkets offers customizations according to the company’s specific needs.

The following customization options are available for the report:

Regional Analysis

  • Further breakdown of the North America, Europe, and Asia Pacific agricultural lubricants market

Product Analysis

  • Product matrix, which gives a detailed comparison of the product portfolios of competing companies

Company Information

  • Detailed analysis and profiles of additional market players (up to five)
Custom Market Research Services

We will customize the research for you, in case the report listed above does not meet with your exact requirements. Our custom research will comprehensively cover the business information you require to help you arrive at strategic and profitable business decisions.

Request Customization
Report Code
CH 5816
Published ON
Mar, 2020
Choose License Type
BUY NOW
  • SHARE
X
Request Customization
Speak to Analyst
Speak to Analyst
OR FACE-TO-FACE MEETING
PERSONALIZE THIS RESEARCH
  • Triangulate with your Own Data
  • Get Data as per your Format and Definition
  • Gain a Deeper Dive on a Specific Application, Geography, Customer or Competitor
  • Any level of Personalization
REQUEST A FREE CUSTOMIZATION
LET US HELP YOU!
  • What are the Known and Unknown Adjacencies Impacting the Agricultural Lubricants Market
  • What will your New Revenue Sources be?
  • Who will be your Top Customer; what will make them switch?
  • Defend your Market Share or Win Competitors
  • Get a Scorecard for Target Partners
CUSTOMIZED WORKSHOP REQUEST
+1-888-600-6441
  • Call Us
  • +1-888-600-6441 (Corporate office hours)
  • +1-888-600-6441 (US/Can toll free)
  • +44-800-368-9399 (UK office hours)
CONNECT WITH US
ABOUT TRUST ONLINE
©2023 MarketsandMarkets Research Private Ltd. All rights reserved
DMCA.com Protection Status Website Feedback