
Artificial Intelligence in Drug Discovery Market Size, Growth, Share & Trends Analysis

Artificial Intelligence in Drug Discovery Market by Process (Target, Lead), Use Case (Design & Optimisation: Vaccine, Antibody; Disease understanding, PK/PD), Therapy (Cancer, CNS, CVS), Tool (ML:DL (CNN, GAN)), End User & Region - Global Forecast to 2029


OVERVIEW

Source: Secondary Research, Interviews with Experts, MarketsandMarkets Analysis
The artificial intelligence in drug discovery market is projected to reach USD 6.89 billion by 2029 from USD 1.86 billion in 2024, at a CAGR of 29.9% from 2024 to 2029. The growth of the artificial intelligence in drug discovery market is driven by rising demand to shorten R&D cycles, increasing use of machine learning for target identification and molecule screening, and the expanding availability of large biological datasets. AI tools improve prediction accuracy, reduce development costs, and accelerate early research stages. Growing collaborations between pharma, biotech, and tech companies further support rapid adoption of AI in drug discovery.
KEY TAKEAWAYS
-
By RegionThe North America artificial intelligence in drug discovery market accounted for a 44.8% revenue share in 2023.
-
By ProcessBy process, the Hit-to-lead Identification/Lead Generation segment accounted for the largest share of 29.2% of the Al in drug discovery market in 2023.
-
By Use CaseBy use case, the De novo drug design accounted for the largest market share of 31.7% in 2023.
-
By Therapeutic AreaBy therapeutic area, the oncology segment is expected to dominate the market.
-
By Player TypeBy player type, the end-to-end solution providers segment accounted for the largest share of AI in drug discovery market.
-
By AI ToolBy AI tool, the machine learning segment is expected to grow at the highest CAGR.
-
By DeploymentBy Deployment, the cloud-based deployment segment accounted for the largest share for the Al in drug discovery market.
-
By End UserBy end user, the the pharmaceutical & biotechnology companies segment accounted for the largest market share.
-
Competitive LandscapeNVIDIA Corporation (US), Schrödinger, Inc.(US), and Insilico Medicine (US) were identified as some of the star players in the AI in drug discovery market (global), given their strong market share and product footprint.
-
Competitive LandscapePredictive Oncology (US), IQVIA Inc.(US), and Cytoreason Ltd. (Canada), among others, have distinguished themselves among startups and SMEs by securing strong footholds in specialized niche areas, underscoring their potential as emerging market leaders
The artificial intelligence (AI) in drug discovery market is growing rapidly as biopharma companies use advanced algorithms to accelerate target identification, optimize lead compounds, and reduce development costs. AI-driven platforms enable faster in-silico screening, improve prediction accuracy, and streamline early-stage R&D. Rising investment in AI partnerships, expanding use of multi-omic data, and increasing demand for efficient drug development are driving wider adoption of intelligent discovery solutions.
TRENDS & DISRUPTIONS IMPACTING CUSTOMERS' CUSTOMERS
The impact on consumers’ business in the Artificial Intelligence (AI) in Drug Discovery market is driven by rising demand for faster, data-driven R&D that improves target identification and accelerates drug development. Key end users include pharmaceutical companies, biotech firms, and CROs, all of whom are increasingly adopting AI for predictive modeling, virtual screening, and automated data analysis. The growing use of deep learning, generative AI, and molecular simulations enhances research efficiency, reduces development risks, and strengthens overall performance for AI-based drug discovery solution providers.

Source: Secondary Research, Interviews with Experts, MarketsandMarkets Analysis
MARKET DYNAMICS
Level
-
Rising need to reduce time and cost of drug discovery and development

-
Growing utilization of Al to predict drug-target interactions for cancer therapy

Level
-
Shortage of Al workforce and ambiguous regulatory guidelines for medical software

Level
-
Leveraging Al for accelerated biotech drug discovery

-
Focus on developing human-aware Al systems

Level
-
Limited availability of quality data sets

-
Lack of advanced Al tools and training data sets

Source: Secondary Research, Interviews with Experts, MarketsandMarkets Analysis
Driver: Rising need to reduce time and cost of drug discovery and development
The AI in Drug Discovery market is driven by the need to reduce the long timelines and high costs of traditional drug development, which can take 10-15 years, cost up to USD 2.8 billion, and still face up to 90% clinical failure rates. With increasing late-stage attrition, stringent regulations, and rising trial costs, pharma and biotech companies are turning to AI to enhance R&D efficiency. AI and ML models help predict toxicity and pharmacokinetics early, eliminating weak candidates and cutting development time. Companies are also launching advanced AI platforms to accelerate discovery, such as Aurigene.Al, which integrates simulations, generative models, and CADD to rapidly identify candidates. Illumina’s AI tools, including Complete Long Reads and PrimateAI-3D, further support faster and more accurate genomic analysis. Together, these innovations highlight AI’s expanding role in reducing risk and boosting productivity in drug discovery.
Restraint: Shortage of Al workforce and ambiguous regulatory guidelines for medical software
The AI in Drug Discovery market faces restraints due to a shortage of skilled AI professionals and unclear regulatory guidelines for medical software. Developing and integrating AI systems requires expertise in ML, deep learning, cognitive computing, and data processing, yet the lack of standardized training and certifications limits workforce availability. AI providers also struggle with low technology awareness among users and difficulty deploying solutions. Regulatory oversight adds further complexity, as agencies like the FDA and EU authorities continue to refine how AI-based software, including decision-support tools, should be classified and evaluated. Ambiguous and evolving rules, case-by-case assessments, and the challenge of proving accuracy and safety comparable to human performance create uncertainty for developers. These factors collectively slow adoption and hinder market growth.
Opportunity: Leveraging Al for accelerated biotech drug discovery
The rapidly growing biotechnology industry presents strong opportunities for AI in Drug Discovery, as biotech firms increasingly adopt advanced computational tools to accelerate therapeutic development. In the US alone, there were 2,363 biotechnology businesses in 2023, marking a 5% increase from 2022, reflecting expanding investment and R&D activity. Companies such as Evaxion Biotech, which uses AI-driven immunology to develop cancer and infectious disease therapies, and AbCellera, which applies AI to accelerate antibody discovery, highlight this trend. Tech leaders like Google are also enabling faster target identification and multiomics analysis through dedicated AI suites. As biopharmaceuticals continue to grow rapidly due to their strong efficacy, AI is set to further enhance discovery speed and efficiency, creating substantial market opportunities.
Challenge: Limited availability of quality data sets
The AI in Drug Discovery market is constrained by the limited availability of high-quality datasets, which are essential for training accurate AI and ML models. Most valuable data remains siloed within pharmaceutical companies and CROs as confidential assets, forcing startups and academic groups to rely on lower-quality public data. Even when large firms generate extensive datasets, they often lack critical metadata or remain inaccessible, reducing AI’s ability to model diseases effectively. While strategies like federated learning, data augmentation, synthetic data, and data-sharing initiatives such as the Pistoia Alliance are helping, access gaps and scalability challenges persist. As a result, data scarcity remains a significant barrier to AI-driven drug discovery.
ARTIFICIAL INTELLIGENCE IN DRUG DISCOVERY MARKET SIZE, GROWTH, SHARE & TRENDS ANALYSIS: COMMERCIAL USE CASES ACROSS INDUSTRIES
| COMPANY | USE CASE DESCRIPTION | BENEFITS |
|---|---|---|
 |
AI supercomputing platforms enabling large-scale molecular simulation, generative drug design, protein folding prediction, and accelerated computation for discovery workflows. | Significant reduction in computation time, enhanced accuracy of molecular predictions, and faster identification of viable drug candidates. |
 |
AI-enhanced physics-based computational platform for molecular modeling, virtual screening, and lead optimization. | Higher predictive precision, improved structural insights, and accelerated optimization of compounds with better efficacy and safety profiles. |
 |
End-to-end AI platform combining generative chemistry, target discovery, and clinical trial prediction for new therapeutics. | Reduced R&D costs, faster drug pipeline creation, and improved probability of success through AI-guided design. |
 |
Automated drug discovery platform using AI, high-content imaging, and phenomics to map cell behavior and identify therapeutic candidates. | Rapid identification of novel mechanisms, improved hit discovery, and accelerated advancement from discovery to preclinical stages. |
 |
AI-driven precision drug design integrating multimodal biological data, automated synthesis, and patient-centric modeling. | Faster development of tailored therapeutics, improved accuracy in predicting clinical outcomes, and higher success rates in the early drug discovery phase. |
Logos and trademarks shown above are the property of their respective owners. Their use here is for informational and illustrative purposes only.
MARKET ECOSYSTEM
The AI in drug discovery market ecosystem comprises players such as Schrödinger, Exscientia, and Insilico Medicine that provide advanced platforms for target identification, molecular design, and AI-driven predictive modeling. These technologies accelerate hit discovery, optimize lead candidates, and enhance R&D decision-making. Cloud and big data partners improve scalability and simulation performance, while pharmaceutical companies, biotech firms, and CROs rely on these tools to streamline development pipelines. Growing collaborations between tech innovators and life science stakeholders continue to drive breakthroughs in AI-enabled drug discovery.

Logos and trademarks shown above are the property of their respective owners. Their use here is for informational and illustrative purposes only.
MARKET SEGMENTS

Source: Secondary Research, Interviews with Experts, MarketsandMarkets Analysis
AI in Drug Discovery Market, By Process
Based on process, the hit-to-lead identification/lead generation segment accounted for the largest share of 29.2% of the Al in drug discovery market in 2023. This is due to the growing adoption of AI-driven virtual screening, predictive modeling, and generative chemistry tools that significantly accelerate the identification of viable lead compounds. AI enables rapid evaluation of large chemical libraries, improves hit quality, and reduces experimental workload. As a result, biopharma companies increasingly rely on AI platforms to shorten timelines and enhance the efficiency of early-stage discovery.
AI in Drug Discovery Market, By Use Case
In 2023, the De novo drug design accounted for the largest market share of 31.7% in 2023. This dominance is driven by the the increasing use of AI algorithms such as generative models and deep learning to create entirely new molecular structures with optimized drug-like properties. These technologies enable rapid exploration of large chemical spaces, reduce dependence on existing compound libraries, and enhance the efficiency of early discovery. Consequently, pharmaceutical and biotech companies are adopting AI-driven de novo design to accelerate innovation and identify promising candidates.
AI in Drug Discovery Market, By Therapeutic Area
In 2023, oncology segment accounted for the largest share of the AI in drug discovery market. This is largely due to the growing need for more effective cancer therapies and the high volume of genomic, clinical, and molecular data generated in oncology research. AI tools help identify novel targets, predict drug responses, and design precision treatments more efficiently than traditional methods. As cancer remains a leading global health burden, biopharma companies are increasingly leveraging AI to accelerate the development of targeted and personalized oncology drugs.
AI in Drug Discovery Market, By Player Type
By player type, the end-to-end solution providers segment accounted for the largest share of the AI in drug discovery market due to its ability to offer fully integrated platforms that streamline the entire R&D workflow. These providers combine data management, target identification, molecular design, predictive modeling, and optimization tools within a single ecosystem, reducing the need for multiple vendors. Their comprehensive capabilities enable faster decision-making, improved accuracy, and greater operational efficiency, leading pharmaceutical and biotech companies to increasingly adopt end-to-end AI solutions.
AI in Drug Discovery Market, By AI Tool
By AI Tool, the machine learning segment is expected to dominate the market, growing at the highest CAGR during the forecast period due to its strong ability to analyze vast chemical and biological datasets, uncover complex patterns, and accurately predict drug behavior. ML models enhance target identification, optimize lead compounds, and reduce experimental failures by improving decision-making at early discovery stages. As adoption of deep learning, generative models, and predictive analytics accelerates, machine learning continues to drive faster, more efficient drug development.
AI in Drug Discovery Market, By Deployment
By Deployment, the cloud-based deployment segment accounted for the largest share of the AI in drug discovery market. This is driven by the need for scalable computing power, seamless data integration, and cost-efficient access to advanced AI tools without heavy on-premise infrastructure. Cloud platforms enable faster model training, real-time collaboration, and secure storage of large genomic and chemical datasets. As drug discovery workflows become increasingly data-intensive, organizations are adopting cloud-based solutions to enhance flexibility, speed, and overall R&D productivity.
AI in Drug Discovery Market, By End User
By end user, the pharmaceutical and biotechnology companies segment accounted for the largest share in 2023, driven by the growing need to accelerate R&D, reduce development costs, and improve drug discovery success rates. These companies increasingly rely on AI to enhance target identification, optimize lead compounds, and predict safety and efficacy earlier in the pipeline. The rising adoption of AI-based platforms, expanding investments in digital transformation, and strong focus on developing precision and biologic therapies further support their leading market position.
REGION
Asia Pacific to be fastest-growing region in global AI in drug discovery market during forecast period
The Asia Pacific AI in drug discovery market is expected to register the highest CAGR during the forecast period, driven by rapid growth in pharmaceutical R&D, strong government support for AI adoption, and increasing investment in biotechnology across countries such as China, Japan, South Korea, and India. Regional pharma and biotech firms are leveraging AI to accelerate target identification, optimize lead compounds, and reduce development costs. Expanding digital infrastructure, rising collaborations with global tech and life science companies, and a growing focus on precision therapies further strengthen the region’s momentum in AI-enabled drug discovery.

ARTIFICIAL INTELLIGENCE IN DRUG DISCOVERY MARKET SIZE, GROWTH, SHARE & TRENDS ANALYSIS: COMPANY EVALUATION MATRIX
Nvidia Corporation (Star) holds a leading position in the AI in drug discovery market with its advanced AI computing platforms and GPU-accelerated frameworks that enhance molecular simulation, predictive modeling, and large-scale compound screening. Its strong partnerships with pharmaceutical and biotechnology companies and its high-performance computing capabilities reinforce its leadership. Microsoft Corporation (Emerging Leader) is rapidly expanding its presence through cloud-based AI solutions that support large-scale data integration, model training, target identification, and accelerated drug development, positioning it as a key innovator advancing next-generation therapeutics.

Source: Secondary Research, Interviews with Experts, MarketsandMarkets Analysis
KEY MARKET PLAYERS
- NVIDIA Corporation (US)
- Schrödinger, Inc. (US)
- Insilico Medicine (US)
- Recursion (US)
- Exscientia (UK)
- Google (US)
- BenevolentAI (UK)
- Microsoft (US)
- Atomwise Inc. (US)
- Illumina, Inc. (US)
- Numedii, Inc. (US)
- Xtalpi Inc. (US)
- Iktos (France)
- Tempus (US)
- DEEP GENOMICS (Canada)
- Verge Genomics (US)
- BenchSci (Canada)
- Insitro (US)
- Valo Health (US)
- BPGBio, Inc. (US)
- Merck KGaA (Germany)
- IQVIA (US)
- Tencent Holdings Limited (China)
- Predictive Oncology, Inc. (US)
- CytoReason (Israel)
- Owkin, Inc. (US)
- Cloud Pharmaceuticals (US)
- Evaxion Biotech (Denmark)
- Standigm (South Korea)
- BIOAGE (US)
- Envisagenics (US)
- Abcellera (US)
- Centella (India)
MARKET SCOPE
| REPORT METRIC | DETAILS |
|---|---|
| Market Size in 2023 (Value) | USD 1.39 Billion |
| Market Forecast in 2029 (Value) | USD 6.89 Billion |
| Growth Rate | CAGR of 29.9% from 2024-2029 |
| Years Considered | 2022-2029 |
| Base Year | 2023 |
| Forecast Period | 2024-2029 |
| Units Considered | Value (USD Million/Billion) |
| Report Coverage | Revenue forecast, company ranking, competitive landscape, growth factors, and trends |
| Segments Covered |
|
| Regions Covered | North America, Europe, Asia Pacific, Latin America, Middle East & Africa |
WHAT IS IN IT FOR YOU: ARTIFICIAL INTELLIGENCE IN DRUG DISCOVERY MARKET SIZE, GROWTH, SHARE & TRENDS ANALYSIS REPORT CONTENT GUIDE

DELIVERED CUSTOMIZATIONS
We have successfully delivered the following deep-dive customizations:
| CLIENT REQUEST | CUSTOMIZATION DELIVERED | VALUE ADDS |
|---|---|---|
| Competitive Landscape Mapping | Profiles of leading AI drug-discovery players (e.g., Insilico Medicine, Schrödinger, Exscientia, Atomwise, Recursion) covering target identification, molecule design, and predictive modeling capabilities. | Supports benchmarking, identifies differentiation levers, and informs strategic partnerships and investment decisions. |
| Market Entry & Growth Strategy | Assessment of AI adoption across pharma/biotech, therapeutic focus areas, collaboration trends, and regional maturity in computational R&D ecosystems. | Reduces entry risk, guides prioritization of high-value markets and therapeutic segments, and supports scalable expansion planning. |
| Regulatory & Risk Analysis | Review of regulatory expectations for AI-assisted discovery workflows, data integrity, model explainability, and compliance with HIPAA/GDPR for biological and patient data. | Strengthens regulatory readiness, mitigates data/privacy risks, and enhances credibility with pharma partners. |
| Technology Adoption Trends | Insights into AI for generative molecule design, virtual screening, ADMET prediction, multi-omics integration, and ML-driven optimization of lead candidates. | Informs R&D roadmap, strengthens product positioning, and supports targeted investment in high-impact discovery technologies. |
RECENT DEVELOPMENTS
- September 2024 : Insilico Medicine collaborated with Inimmune to leverage its proprietary Al platform, Chemistry42, in accelerating the discovery and development of next-generation immunotherapeutics.
- August 2024 : Recursion and Exscientia plc announced an agreement, combining their technologies to enhance small molecule drug discovery. The integrated Recursion OS will enhance drug discovery through patient- centric target discovery, Al-driven design, quantum mechanics modeling, automated chemical synthesis, and more.
- June 2023 : BenevolentAl collaborated with the Sheffield Institute for Translational Neuroscience (SITraN) at the University of Sheffield on this program, utilizing its patient-derived motor neuron/iAstrocyte co-culture systems and in vivo model expertise.
Table of Contents
 Exclusive indicates content/data unique to MarketsandMarkets and not available with any competitors.
Methodology
The study involved significant activities to estimate the current size of the artificial intelligence (AI) in drug discovery market. Exhaustive secondary research was done to collect information on artificial intelligence (AI) in drug discovery market. The next step was to validate these findings, assumptions, and sizing with industry experts across the value chain using primary research. Different approaches, such as top-down and bottom-up, were employed to estimate the total market size. After that, the market breakup and data triangulation procedures were used to estimate the market size of the segments and subsegments of the artificial intelligence (AI) in drug doscovery market.
Secondary Research
This research study involved the wide use of secondary sources, directories, and databases such as Dun & Bradstreet, Bloomberg Businessweek, and Factiva; white papers, annual reports, and companies’ house documents; investor presentations; and the SEC filings of companies. The market for the companies offering AI in drug discovery solutions is arrived at by secondary data available through paid and unpaid sources, analyzing the product portfolios of the major companies in the ecosystem, and rating the companies by their performance and quality. Various sources were referred to in the secondary research process to identify and collect information for this study. The secondary sources include annual reports, press releases, investor presentations of companies, white papers, journals, certified publications, and articles from recognized authors, directories, and databases.
Various secondary sources were referred to in the secondary research process to identify and collect information related to the study. These sources included annual reports, press releases, investor presentations of AI in drug discovery vendors, forums, certified publications, and whitepapers. The secondary research was used to obtain critical information on the industry’s value chain, the total pool of key players, market classification, and segmentation from the market and technology-oriented perspectives.
Primary Research
In the primary research process, various sources from both the supply and demand sides were interviewed to obtain qualitative and quantitative information for this report. Primary sources are mainly industry experts from the core and related industries and preferred suppliers, manufacturers, distributors, technology developers, researchers, and organizations related to all segments of this industry’s value chain. In-depth interviews were conducted with various primary respondents, including key industry participants, subject-matter experts (SMEs), C-level executives of key market players, and industry consultants, among other experts, to obtain and verify the critical qualitative and quantitative information as well as assess prospects.
Primary research was conducted to identify segmentation types, industry trends, key players, and key market dynamics such as drivers, restraints, opportunities, challenges, industry trends, and strategies adopted by key players.
After the complete market engineering (calculations for market statistics, market breakdown, market size estimations, market forecasting, and data triangulation), extensive primary research was conducted to gather information and verify and validate the critical numbers arrived at. Primary research was also undertaken to identify the segmentation types, industry trends, competitive landscape of AI in drug discovery solutions offered by various market players, and key market dynamics, such as drivers, restraints, opportunities, challenges, industry trends, and key player strategies.
In the complete market engineering process, the top-down and bottom-up approaches and several data triangulation methods were extensively used to perform the market estimation and market forecasting for the overall market segments and subsegments listed in this report. Extensive qualitative and quantitative analysis was performed on the complete market engineering process to list the key information/insights throughout the report.
Breakdown of the Primary Respondents:
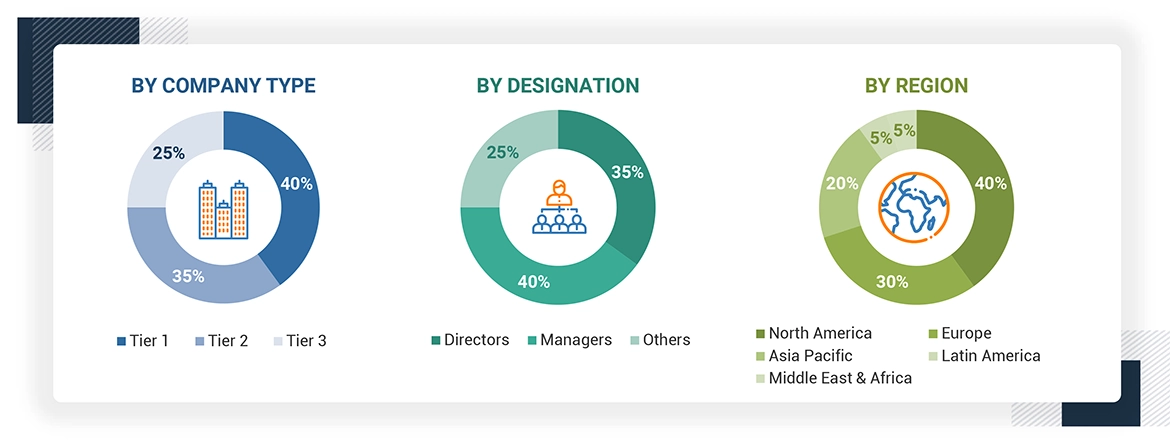
*Others include sales managers, marketing managers, and product managers.
Note: Tiers are defined based on a company’s total revenue, as of 2023: Tier 1 = >USD 1 billion, Tier 2 = USD 500 million to USD 1 billion, and Tier 3 = < USD 500 million.
To know about the assumptions considered for the study, download the pdf brochure
Market Size Estimation
Both top-down and bottom-up approaches were used to estimate and validate the total size of the artificial intelligence (AI) in drug discovery market. These methods were also used extensively to estimate the size of various subsegments in the market. The research methodology used to estimate the market size includes the following:
- The key players in the industry and markets have been identified through extensive secondary research.
- The industry’s supply chain and market size, in terms of value, have been determined through primary and secondary research processes.
- All percentage shares, splits, and breakdowns have been determined using secondary sources and verified through primary sources.
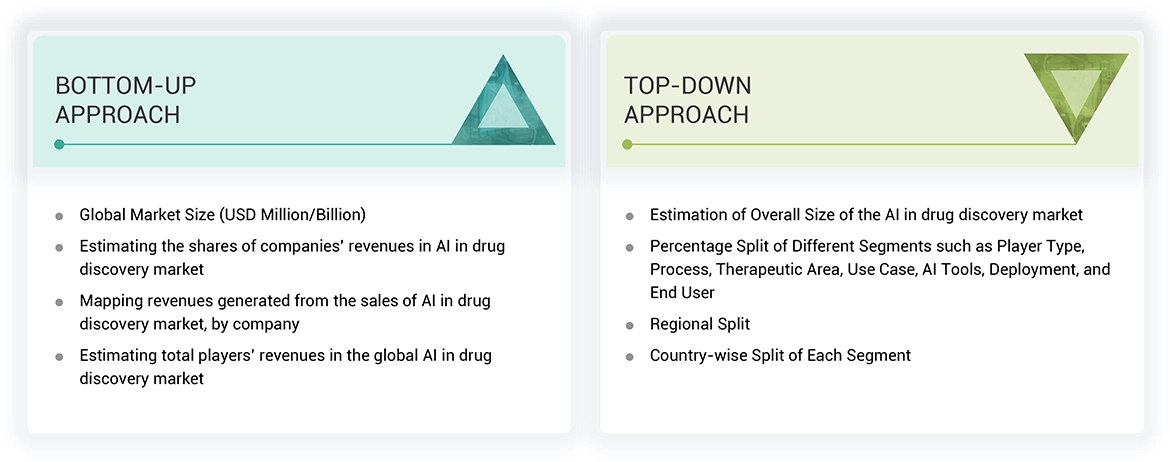
Data Triangulation
After arriving at the overall market size—using the market size estimation processes—the market was split into several segments and subsegments. To complete the overall market engineering process and arrive at the exact statistics of each market segment and sub-segment, the data triangulation and market breakdown procedures were employed, wherever applicable. The data was triangulated by studying various factors and trends from both the demand and supply sides in the artificial intelligence (AI) in drug discovery market.
Market Definition
Artificial intelligence (AI) in drug discovery is the use of Al algorithms and techniques to improve the efficiency and effectiveness of the drug discovery process. Al can be used to automate tasks, analyze large datasets, and generate new insights that would be difficult or impossible to obtain using traditional methods. Al algorithms, particularly machine learning and deep learning models, are employed to analyze vast datasets on genetics, molecular structures, and biological interactions. These Al systems can predict potential drug candidates, assess their safety profiles, and optimize the drug development process.
AI in drug discovery enables faster target identification and in silico drug design. It identifies patterns in data to predict which compounds will be successful medicines. Al is still in the early stages of development in drug discovery, but it has the potential to revolutionize the process by automating tasks and analyzing large datasets. Al can create significant value in drug discovery through three main drivers: time and cost savings, increased probability of success, and novelty of both the molecular target and optimized therapeutic agent.
Stakeholders
- AI Solution Providers
- AI Platform Providers
- Technology Providers
- AI System Providers
- Platform Providers
- System Integrators
- Pharmaceutical Companies
- Biotechnology Companies and Start-ups
- Drug Discovery Ventures
- Contract Development and Manufacturing Organizations (CDMOs)
- Contract Research Organizations (CROs)
- Research Centers and Universities
- Academic Institutes
- Forums, Alliances, and Associations
- Distributors
- Venture Capitalists
- Government Organizations
- Institutional Investors and Investment Banks
- Investors/Shareholders
- Consulting Companies in the Drug Discovery Sector and Regulatory Consultants
- Raw Material and Component Manufacturers
- Hardware Manufacturers and Suppliers
- Data Providers
- Regulatory Agencies
- Healthcare Providers
- Patient Advocacy Groups
- Ethical and Legal Experts
Report Objectives
- To define, describe, and forecast the global artificial intelligence (AI) in drug discovery market based on by process, use case, therapeutic area, player type, tools, deployment, end user, and region
- To provide detailed information regarding the factors influencing the growth of the market (such as the drivers, restraints, opportunities, and challenges)
- To strategically analyze micromarkets with respect to individual growth trends, prospects, and contributions to the overall artificial intelligence (AI) in drug discovery market
- To analyze market opportunities for stakeholders and provide details of the competitive landscape for market leaders
- To forecast the size of the artificial intelligence (AI) in drug discovery market in five main regions (along with their respective key countries): North America, Europe, the Asia Pacific, Latin America, and the Middle East & Africa
- To provide key industry insights such as supply chain analysis, regulatory analysis, patent analysis, and impact of generative AI
- To profile key players and comprehensively analyze their product portfolios, market positions, and core competencies in the market
- To track and analyze competitive developments such as product & service launches; expansions; partnerships, agreements, and collaborations; and acquisitions in the artificial intelligence (AI) in drug discovery market
- To track and analyze competitive developments such as product launches and enhancements, investments, partnerships, collaborations, agreements, joint ventures, funding, acquisitions, expansions, conferences, FDA clearances, sales contracts, alliances, and R&D activities of the leading players in the market
- To benchmark players within the artificial intelligence (AI) in drug discovery market using the Company Evaluation Matrix framework, which analyzes market players on various parameters within the broad categories of business strategy, market share, and product offering
Key Questions Addressed by the Report
- On-premise
- Cloud-based
- SaaS-based
- Pharmaceutical & Biotechnology Companies
- Contract Research Organizations
- Research Centers, Academic Institutes, & Government Organizations
Need a Tailored Report?
Customize this report to your needs
Get 10% FREE Customization
Customize This ReportPersonalize This Research
- Triangulate with your Own Data
- Get Data as per your Format and Definition
- Gain a Deeper Dive on a Specific Application, Geography, Customer or Competitor
- Any level of Personalization
Let Us Help You
- What are the Known and Unknown Adjacencies Impacting the Artificial Intelligence in Drug Discovery Market
- What will your New Revenue Sources be?
- Who will be your Top Customer; what will make them switch?
- Defend your Market Share or Win Competitors
- Get a Scorecard for Target Partners

Custom Market Research Services
We Will Customise The Research For You, In Case The Report Listed Above Does Not Meet With Your Requirements
Get 10% Free CustomisationGrowth opportunities and latent adjacency in Artificial Intelligence in Drug Discovery Market


Anthony
Jun, 2022
Which market segment is expected to shape the future of the AI in Drug Discovery Market?.
Adam
Jun, 2022
Which are the most innovative companies in AI in Drug Discovery Market?.
Mathew
Jun, 2022
What are the new trends and advancements in the AI in Drug Discovery Market?.