
AI Inference Platform-as-a-Service (PaaS) Market Size, Share & Trends

AI Inference Platform-as-a-Service (PaaS) Market Size, Share, Growth & Trends by Deployment (Private Cloud, Public Cloud, Hybrid Cloud), Application (Gen AI, Machine Learning, NLP, Computer Vision), Vertical (BFSI, IT & Telecom, Retail & E-commerce), Region - Global Forecast to 2030


AI INFERENCE PLATFORM-AS-A-SERVICE (PAAS) MARKET SIZE, SHARE & TRENDS
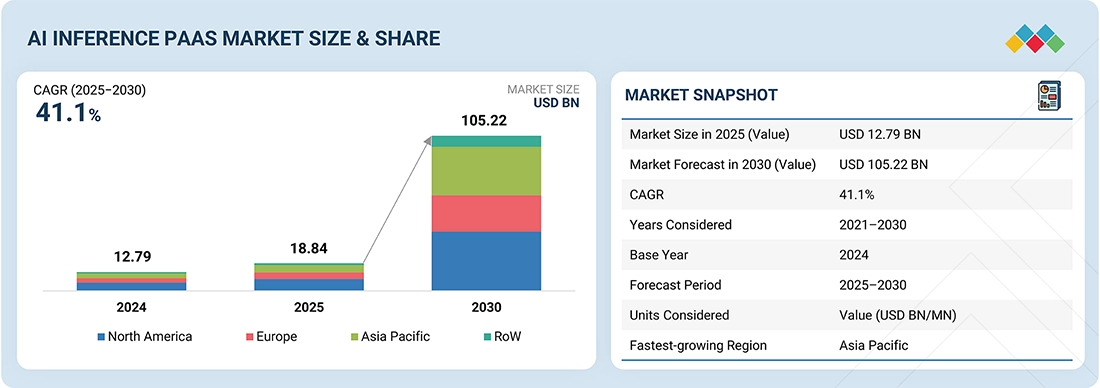
According to Marketsandmarkets, the global AI inference PaaS market size was valued at USD 18.84 billion in 2025 and is projected to reach USD 105.22 billion in 2030, growing at a CAGR of 41.1% from 2025 to 2030. AI inference PaaS is a cloud-based service that enables enterprises to deploy, manage, and scale AI inference workloads without the need for on-premises infrastructure. The market growth is due to the surging adoption of generative AI and large language models (LLMs), which demand scalable, low-latency inference capabilities. Additionally, the shift toward cloud-native architectures and the rising need for real-time decision-making across industries are accelerating adoption.
MARKET SNAPSHOT TABLE
| REPORT METRIC | DETAILS |
|---|---|
| Market Size in 2025 (Value) | USD 18.84 Billion |
| Market Forecast in 2030 (Value) | USD 105.22 Billion |
| Growth Rate | CAGR of 41.1% from 2025-2030 |
| Years Considered | 2021-2030 |
| Base Year | 2024 |
| Forecast Period | 2025-2030 |
| Units Considered | Value (USD Million/Billion) |
| Report Coverage | Revenue forecast, company ranking, competitive landscape, growth factors, and trends |
| Top Companies |
|
| Growth Drivers |
|
| Segments Covered |
|
| Regional Scope | North America, Europe, Asia Pacific, and RoW |
Market Size & Forecast
KEY TAKEAWAYS
- The North America AI Inference PaaS market accounted for accounted for 43.4% revenue share in 2024.
- By deployment, hybrid cloud segment is expected to grow at the highest CAGR of 47.5%.
- By application, generative AI segment is projected to grow at the fastest rate from 2025 to 2030.
- By vertical, the BFSI segment is expected to dominate the market.
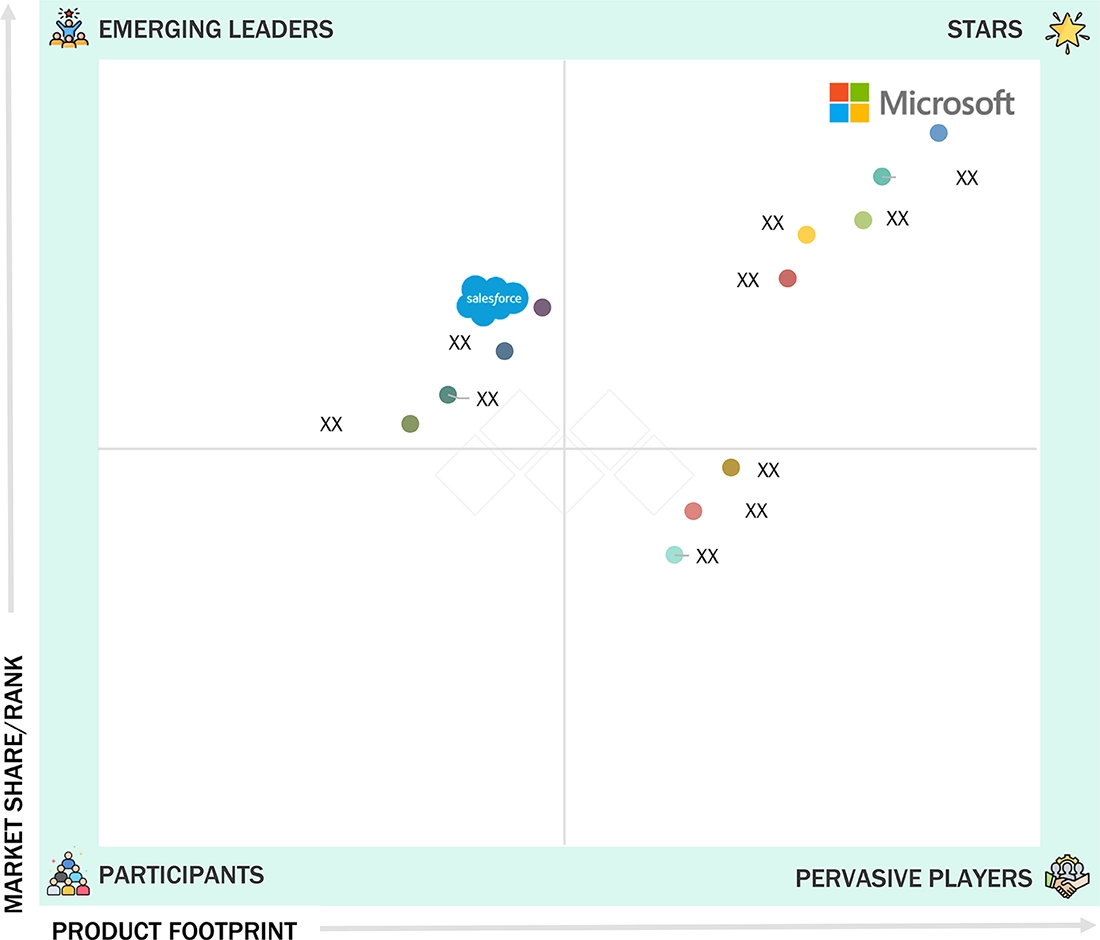
- Microsoft, Amazon Web Services, Inc., and Google were identified as some of the star players in the AI inference PaaS market, given their strong market share and product footprint.
- Salesforce, C3.ai, and Cloudflare among others, have distinguished themselves among startups and SMEs by securing strong footholds in specialized niche areas, underscoring their potential as emerging market leaders.
The AI inference PaaS industry is set to grow rapidly over the next decade, fueled by the rising demand for cost-efficient and scalable AI deployment across industries. As organizations increasingly prioritize faster time-to-market, reduced infrastructure complexity, and flexible consumption-based pricing, AI inference PaaS is emerging as the preferred model for operationalizing advanced AI applications. The convergence of cloud-native technologies, edge AI, and industry-specific SaaS platforms is expected to unlock new growth avenues, while strategic investments by hyperscalers and regional cloud providers ensure continued market expansion.
Source: Secondary Research, Interviews with Experts, MarketsandMarkets Analysis
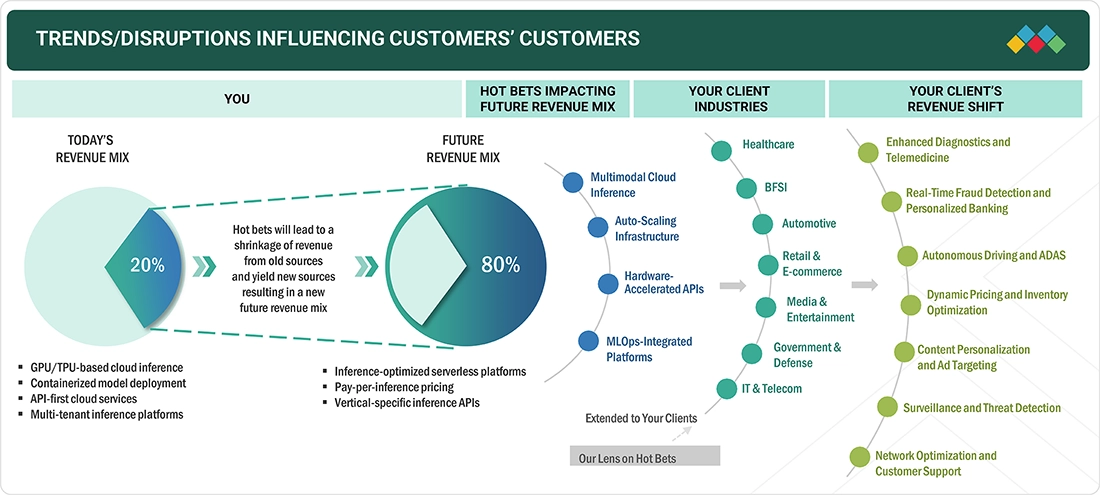
TRENDS & DISRUPTIONS IMPACTING CUSTOMERS' CUSTOMERS
The AI inference PaaS landscape is significantly shifting as enterprises move from traditional GPU/TPU-based inference models toward serverless, auto-scaling, and pay-per-inference platforms. This disruption is influenced by the need for agility, cost efficiency, and scalability as workloads diversify across multimodal AI, large language models, and industry-specific APIs. Businesses that previously relied on static, containerized deployments face a new paradigm where hardware-accelerated APIs, inference-optimized runtimes, and integrated MLOps pipelines are the differentiators. These technologies reduce operational complexity while improving performance and throughput, enabling enterprises to deliver AI at scale with predictable economics. These technology shifts are reshaping industry revenue models and business processes.
Source: Secondary Research, Interviews with Experts, MarketsandMarkets Analysis
AI INFERENCE PAAS MARKET DYNAMICS
Level
-
Surging adoption of generative AI and large language models

-
Increasing preference for cloud-native AI architectures

Level
-
High cost of AI accelerators and service pricing volatility

-
Vendor lock-in concerns

Level
-
Availability of on-demand inference for SMEs and startups

-
Rise in sovereign AI and regional cloud partnerships

Level
-
Latency and bandwidth issues in cloud-only setups

-
Complexities in managing AI models in dynamic production environments

Source: Secondary Research, Interviews with Experts, MarketsandMarkets Analysis
Driver: Surging adoption of generative AI and large language models
The rapid commercialization of generative AI and LLM-driven applications creates unprecedented demand for scalable inference platforms. Enterprises increasingly offload these resource-intensive workloads to PaaS providers, leveraging elastic compute to accelerate deployment while reducing infrastructure complexity. This surge in enterprise AI adoption is a primary catalyst driving market expansion.
Restraint: High cost of AI accelerators and service pricing volatility
The economics of inference remain constrained by the premium pricing of GPUs, TPUs, and specialized AI accelerators. Additionally, cloud service providers often pass on cost fluctuations, resulting in unpredictable pricing structures. This volatility creates procurement challenges for enterprises, limiting adoption in cost-sensitive sectors and slowing market penetration.
Opportunity: Availability of on-demand inference for SMEs and startups
AI inference delivered as a flexible, pay-as-you-go service unlocks adoption among SMEs and startups lacking access to dedicated infrastructure. By lowering entry barriers, PaaS democratizes AI deployment, enabling smaller players to integrate advanced capabilities into their products and services. This segment represents a high-growth opportunity for providers to expand their customer base.
Challenge: Latency and bandwidth issues in cloud-only setups
Cloud-only inference models often struggle with latency and bandwidth bottlenecks, particularly in use cases requiring real-time responsiveness. However, advances in edge deployment, hybrid architectures, and model optimization are steadily addressing this gap. Providers that can reliably minimize latency while scaling inference workloads will convert this challenge into a competitive differentiator.
AI Inference Platform-as-a-Service (PaaS) Market Share: COMMERCIAL USE CASES ACROSS INDUSTRIES
| COMPANY | USE CASE DESCRIPTION | BENEFITS |
|---|---|---|
 |
Migrated ML inference from Amazon EKS to Amazon SageMaker, using multi-model endpoints and serverless inference to improve GPU utilization and scalability | Up to 66% cost savings with multi-model endpoints | 80% cost reduction with serverless inference | improved latency, availability, and scalability |
 |
Adopted NVIDIA Triton Inference Server on Azure GPUs to unify multiple AI frameworks, optimize throughput with TensorRT, and leverage A100 GPUs | Accelerated AI model deployment | improved throughput | reduced latency | simplified infrastructure management for 1.5M+ global customers |
 |
Enhanced customer self-service by integrating Oracle Digital Assistant with OCI Generative AI and OpenSearch for fast, accurate support responses | Higher first-time resolution rates | reduced inquiry volumes | improved customer satisfaction | freed human agents for complex cases |
|
|
Leveraged OCI Data Science and AI Infrastructure to train and deploy AI models for analyzing high-energy physics data from the Large Hadron Collider | Cost and energy-efficient AI model training | scalable model reuse across research projects, enabling faster scientific discoveries |
|
|
Adopted Oracle AI Infrastructure with RDMA networking and OCI Kubernetes Engine for efficient AI model training, inference, and scaling | Improved performance and efficiency in AI workloads | seamless scalability | reliable delivery of customer-facing AI applications |
Logos and trademarks shown above are the property of their respective owners. Their use here is for informational and illustrative purposes only.
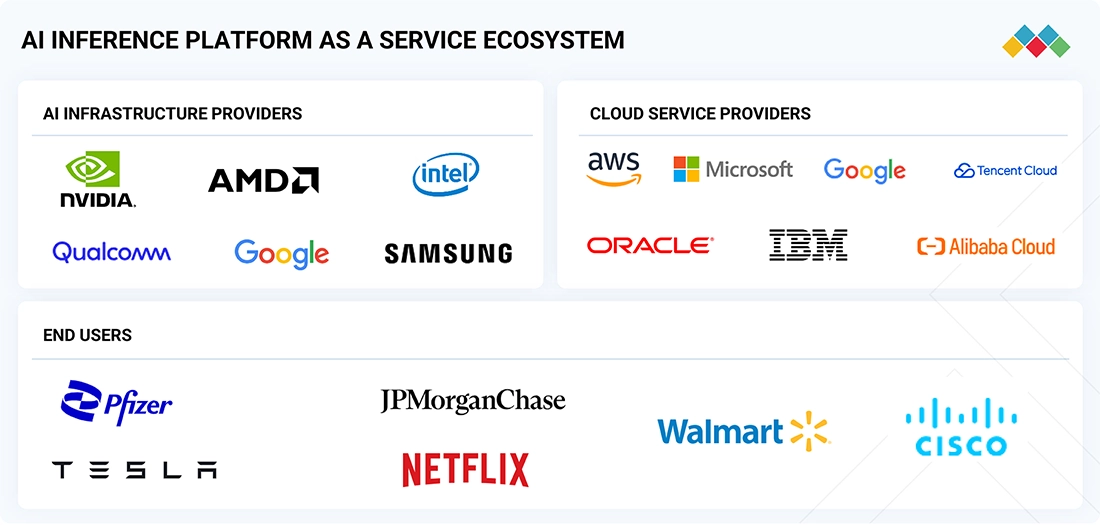
AI INFERENCE PAAS MARKET ECOSYSTEM
The ecosystem for the AI inference PaaS market growth is a dynamic and interconnected network that drives the deployment and utilization of AI inference solutions across various industries. This ecosystem comprises three key participants: AI infrastructure providers, cloud service providers, and end users, each playing a critical role in enabling scalable, efficient, and accessible AI inference capabilities. The synergy among these participants ensures that cutting-edge hardware, robust cloud platforms, and diverse industry applications work seamlessly to meet the growing demand for real-time AI processing.
Logos and trademarks shown above are the property of their respective owners. Their use here is for informational and illustrative purposes only.
AI INFERENCE PAAS MARKET SHARE SEGMENTS
Source: Secondary Research, Interviews with Experts, MarketsandMarkets Analysis
AI Inference PaaS Market Trends, By Deployment
The public cloud segment accounted for the largest share of the AI inference PaaS market growth, driven by its scalability, cost efficiency, and ease of deployment for enterprises of all sizes. Public cloud platforms provide flexible consumption-based models and seamless integration with AI accelerators, making them the preferred choice for inference workloads. Enterprises increasingly leverage public cloud platforms to deploy inference models at scale, benefiting from advanced GPU and TPU resources offered by hyperscalers.
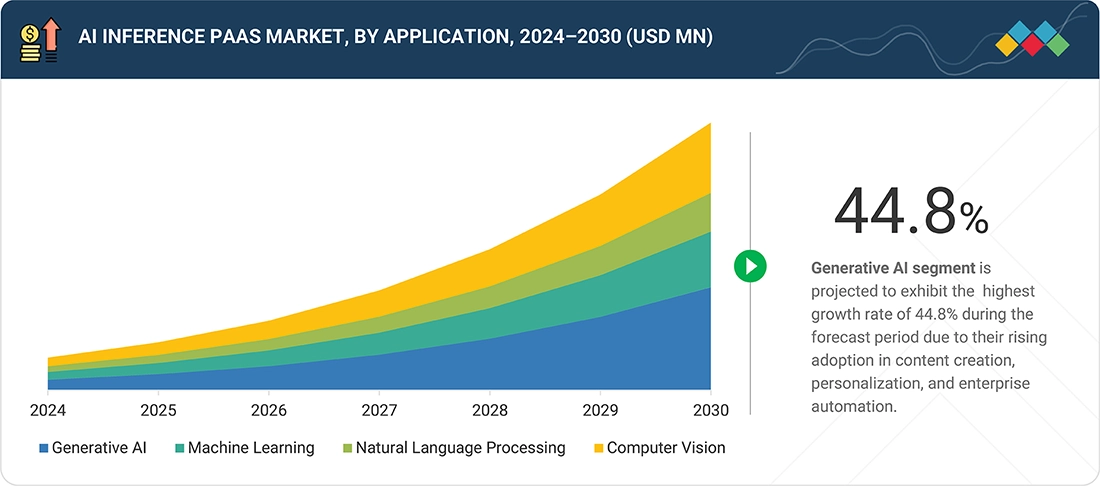
AI Inference PaaS Market, By Application
Generative AI applications dominated the AI inference PaaS market, fueled by the rapid adoption of large language models, transformer-based architectures, and generative adversarial networks (GANs). Enterprises across industries are adopting generative AI for content creation, conversational AI, code generation, and design automation, creating significant inference demand. The rise of foundation models and generative AI integration into SaaS platforms further reinforces the leadership of this segment.
AI Inference PaaS Market, By Vertical
The BFSI sector held the largest market share, driven by its extensive adoption of AI inference platforms for fraud detection, credit risk assessment, algorithmic trading, and hyper-personalized financial services. Banks and insurers increasingly deploy AI models on cloud-based inference platforms to process massive transaction datasets in real time. Growing regulatory compliance needs and the importance of secure, scalable AI deployments have further cemented BFSI’s leadership in the market.
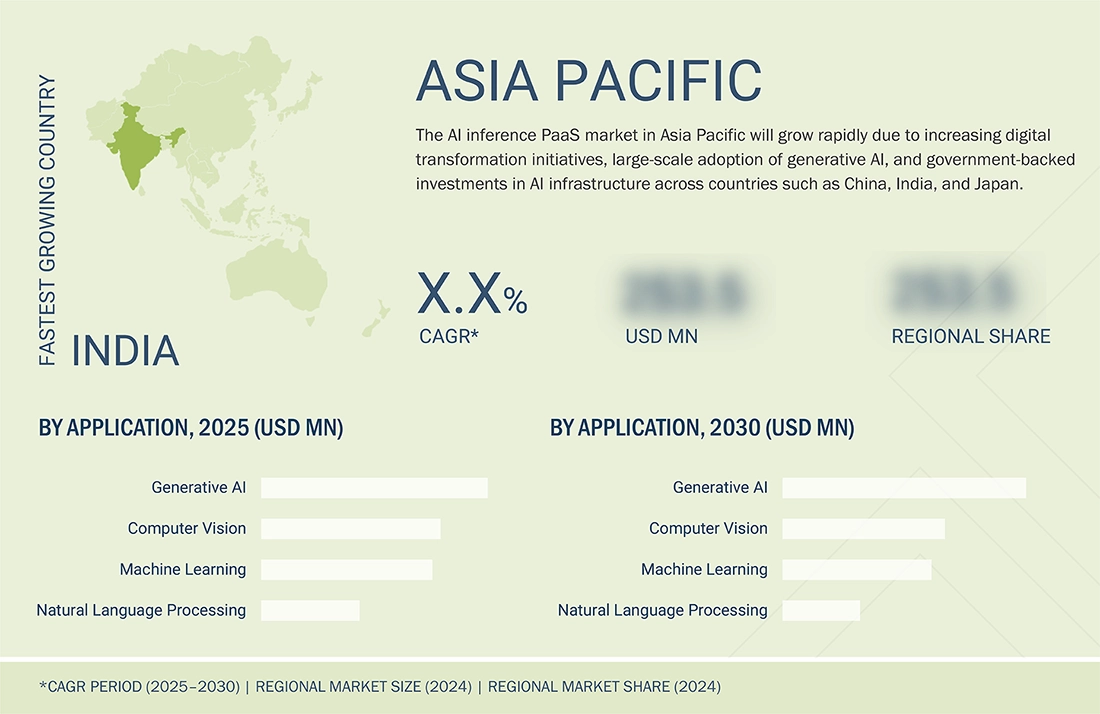
AI INFERENCE PAAS MARKET BY REGION
Asia Pacific to be fastest-growing region in global AI Inference PaaS market share during forecast period
Asia Pacific is expected to grow at the highest rate during the forecast period, supported by rapid industrialization, expanding hyperscale data centers, and sovereign AI initiatives across China, India, Japan, and South Korea. The region benefits from strong government support, increasing investments in cloud infrastructure, and rising AI adoption across the BFSI, healthcare, and telecom industries. The strong presence of regional cloud providers and government-backed AI programs positions the region as the fastest-growing market.
AI Inference Platform-as-a-Service (PaaS) Market: COMPANY EVALUATION MATRIX
The company evaluation matrix for the AI inference PaaS market highlights the positioning of leading players based on their market presence, technological capabilities, and strategic growth initiatives. In the AI inference PaaS market matrix, Microsoft leads with its strong market presence and cloud-native AI capabilities, offering scalable solutions for generative AI, machine learning, and LLM workloads. Salesforce, Inc. is gaining traction by integrating AI inference into its CRM and enterprise platforms, enabling personalized customer experiences and driving adoption across business applications.
Source: Secondary Research, Interviews with Experts, MarketsandMarkets Analysis
KEY MARKET PLAYERS - AI inference PaaS Companies
WHAT IS IN IT FOR YOU: AI Inference Platform-as-a-Service (PaaS) Market REPORT CONTENT GUIDE
DELIVERED CUSTOMIZATIONS
We have successfully delivered the following deep-dive customizations:
| CLIENT REQUEST | CUSTOMIZATION DELIVERED | VALUE ADDS |
|---|---|---|
| Global Cloud Service Provider |
|
|
| GenAI Startup |
|
|
| Telecom Operator |
|
|
| Healthcare IT Provider |
|
|
| Investment Firm |
|
|
RECENT DEVELOPMENTS
- July 2025 : Amazon Web Services, Inc. introduced advanced customization capabilities for SageMaker AI Nova models—Nova Micro, Nova Lite, and Nova Pro. These features enable tailored model development across pre-training, supervised fine-tuning, and alignment, and they are offered as ready-to-use SageMaker recipes with seamless deployment to Amazon Bedrock for flexible inference options.
- June 2025 : Oracle and NVIDIA Corporation collaborated to accelerate AI innovation for enterprises and developers. NVIDIA AI Enterprise is natively available through the Oracle Cloud Infrastructure (OCI) Console, providing access to over 160 AI tools for training and inference.
- May 2025 : Google Cloud and Red Hat expanded their partnership to enhance enterprise AI through open source innovation. The partnership integrates Red Hat’s AI technologies with Google Cloud’s infrastructure and Gemma models, launching the llm-d open source project with Google as a founding contributor.
- January 2025 : Microsoft extended its strategic partnership with OpenAI, introducing a joint effort on the Stargate project. Key elements include Microsoft’s continued access to OpenAI’s IP for products like Copilot, exclusivity of OpenAI’s APIs on Azure via the Azure OpenAI Service, and mutual revenue-sharing agreements.
- January 2025 : IBM and CoreWeave partnered to provide one of the first NVIDIA GB200 Grace Blackwell Superchip-enabled AI supercomputers, featuring GB200 NVL72 systems and NVIDIA Quantum-2 InfiniBand networking. IBM will use CoreWeave’s cloud platform to train its next-generation Granite AI models, optimizing performance, safety, speed, and cost-efficiency for enterprise applications.
Table of Contents
 Exclusive indicates content/data unique to MarketsandMarkets and not available with any competitors.
Methodology
The study involved four major activities in estimating the current size of the AI inference PaaS market. Exhaustive secondary research collected information on the market, peer, and parent markets. The next step was to validate these findings, assumptions, and sizing with industry experts across the value chain through primary research. Both top-down and bottom-up approaches were employed to estimate the complete market size. After that, market breakdown and data triangulation techniques were used to estimate the market size of segments and subsegments.
Secondary Research
The secondary research process has referred to various secondary sources to identify and collect necessary information for this study. The secondary sources include annual reports, press releases, and investor presentations of companies; white papers; journals and certified publications; and articles from recognized authors, websites, directories, and databases. Secondary research was conducted to obtain critical information about the industry’s supply chain, the market’s value chain, the total pool of key players, market segmentation according to industry trends (to the bottom-most level), regional markets, and key developments from market- and technology-oriented perspectives. Secondary data was collected and analyzed to determine the overall market size, which was further validated through primary research.
Primary Research
Extensive primary research was conducted after gaining knowledge about the current scenario of the AI inference PaaS market through secondary research. Several primary interviews were conducted with experts from the demand and supply sides across four major regions: North America, Europe, Asia Pacific, and RoW. This primary data was collected through questionnaires, emails, and telephone interviews.
 Market Size, and Share")
Notes: Other designations include technology heads, media analysts, sales managers, marketing managers, and product managers.
The three tiers of the companies are based on their total revenues as of 2024; Tier 1: >USD 1 billion, Tier 2: USD 500 million–1 billion, and Tier 3: USD 500 million.
To know about the assumptions considered for the study, download the pdf brochure
Market Size Estimation
In the complete market engineering process, the top-down and bottom-up approaches and several data triangulation methods were used to estimate and forecast the overall market segments and subsegments listed in this report. Key players in the market were identified through secondary research, and their market shares in respective regions were determined through primary and secondary research. This entire procedure includes the study of annual and financial reports of the top market players and extensive interviews for key insights (quantitative and qualitative) with industry experts (CEOs, VPs, directors, and marketing executives).
All percentage shares, splits, and breakdowns were determined using secondary sources and verified through primary sources. All the parameters affecting the markets covered in this research study were accounted for, viewed in detail, verified through primary research, and analyzed to obtain the final quantitative and qualitative data. This data was consolidated and supplemented with detailed inputs and analysis from MarketsandMarkets and presented in this report.
AI Inference Platform-as-a-Service (PaaS) Market: Top-Down and Bottom-Up Approach
 Market Top Down and Bottom Up Approach")
Data Triangulation
After arriving at the overall market size, the market was split into several segments and subsegments using the market size estimation processes explained above. Data triangulation and market breakdown procedures were employed to complete the entire market engineering process and determine the exact statistics of each market segment and subsegment. The data was triangulated by studying various factors and trends from the demand and supply sides in the AI inference PaaS market.
Market Definition
AI inference PaaS encompasses cloud-based platforms that deliver scalable environments for running applications, such as generative AI, machine learning, computer vision, and natural language processing. These technologies are increasingly applied across verticals such as healthcare, BFSI, automotive, retail & e-commerce, media & entertainment, government, and telecom to drive personalized services, predictive insights, and operational efficiency. Supported by deployment models spanning public, private, and hybrid cloud, AI inference PaaS provides enterprises with flexible, cost-efficient, and secure access to advanced AI capabilities while eliminating the need for complex infrastructure management.
Key Stakeholders
- Cloud Service Providers
- GPU & AI Accelerator Hardware Manufacturers
- Software & Platform Providers
- Enterprise Users
- Developers & Researchers
- Cloud Orchestration & Management Providers
- Data Center Operators
- Telecom & Networking Companies
- Regulatory Bodies & Industry Associations
- Systems Integrators
- Consulting Firms
- AI Startups
- Hyperscale Cloud Operators
- Edge Computing Providers
- AI Framework Developers
- Managed Service Providers
- Academic & Research Institutions
Report Objectives
- To define, describe, and forecast the size of the AI inference PaaS market, by deployment, application, and vertical, in terms of value
- To forecast the market size for various segments with respect to four main regions, namely North America, Europe, Asia Pacific, and the Rest of the World (RoW), in terms of value
- To provide detailed information regarding major drivers, restraints, opportunities, and challenges influencing the growth of the market
- To provide value chain analysis, ecosystem analysis, case study analysis, patent analysis, technology analysis, pricing analysis, key conferences and events, key stakeholders and buying criteria, Porter’s Five Forces analysis, regulations, investment and funding scenario, and the impact of the 2025 US tariff pertaining to the market
- To strategically analyze micromarkets1 with respect to individual growth trends, prospects, and contributions to the total market
- To analyze opportunities for various stakeholders by identifying high-growth segments of the AI inference PaaS market
- To strategically profile key players and comprehensively analyze their market rank and core competencies, along with detailing the competitive landscape for market leaders
- To analyze competitive developments, such as partnerships, collaborations, strategic investments, mergers & acquisitions, and product launches, in the AI inference PaaS market
- To analyze the impact of the macroeconomic outlook for each region covered under the study
Customization Options:
With the given market data, MarketsandMarkets offers customizations according to the specific requirements of companies. The following customization options are available for the report:
Country-wise Information:
- Country-wise breakdown for North America, Europe, Asia Pacific, and RoW
Company Information:
- Detailed analysis and profiling of additional market players (up to five)
Key Questions Addressed by the Report
What is the current size of the global AI Inference Platform-as-a-Service (PaaS) market?
The global AI Inference Platform-as-a-Service (PaaS) market is estimated to be USD 18.84 billion in 2025. The market covers cloud-based platforms that enable enterprises to deploy, manage, and scale AI inference workloads without managing dedicated infrastructure. (MarketsandMarkets)
What will be the projected size of the AI Inference PaaS market by 2030?
The AI Inference Platform-as-a-Service market is projected to reach USD 105.22 billion by 2030. (MarketsandMarkets)
What is the CAGR of the AI Inference PaaS market?
The market is expected to grow at a CAGR of 41.1% from 2025 to 2030, driven by rapid enterprise adoption of generative AI, large language models (LLMs), and cloud-native AI deployment. (MarketsandMarkets)
What are the major growth drivers of the AI Inference PaaS industry?
Key growth drivers include increasing adoption of generative AI and LLM applications, demand for scalable low-latency AI inference, cloud-native AI architectures, real-time decision-making requirements, and reduced infrastructure complexity for enterprises. (MarketsandMarkets)
What are the major trends shaping the AI Inference PaaS market?
Major trends include serverless AI inference, hybrid cloud AI deployment, edge AI integration, inference-optimized runtimes, MLOps automation, AI APIs, and pay-per-inference consumption models. (MarketsandMarkets)
Which industries and applications are driving AI Inference PaaS adoption?
Major industries adopting AI inference PaaS include BFSI, IT & telecom, healthcare, automotive, retail & e-commerce, media & entertainment, and government & defense. Key applications include generative AI, machine learning, natural language processing (NLP), and computer vision. (MarketsandMarkets)
Which companies are major players in the AI Inference PaaS market?
Leading companies include Microsoft, Amazon Web Services (AWS), Google Cloud, Oracle, and IBM. Other emerging players include Salesforce, C3.ai, and Cloudflare. (MarketsandMarkets)
Which deployment segment dominates the AI Inference PaaS market?
The public cloud segment is expected to hold the largest market share due to scalability, cost efficiency, flexible pricing models, and access to AI accelerators such as GPUs and TPUs. The hybrid cloud segment is expected to grow at the highest CAGR of 47.5% during 2025–2030. (MarketsandMarkets)
Which region leads the global AI Inference PaaS market?
North America accounted for 43.4% revenue share in 2024, supported by strong enterprise AI adoption, hyperscale cloud providers, and high investment in generative AI technologies. Asia Pacific is expected to be the fastest-growing region due to expanding cloud infrastructure, sovereign AI initiatives, and increasing AI adoption in countries such as China, India, Japan, and South Korea. (MarketsandMarkets)
What does the MarketsandMarkets AI Inference PaaS market report cover?
The report covers market size forecasts, competitive analysis, trends, growth drivers, challenges, opportunities, and segmentation by deployment (public cloud, private cloud, hybrid cloud), application (Gen AI, machine learning, NLP, computer vision), verticals, and regions. The report includes 303 pages and 270 market tables with analysis from 2021–2030. (MarketsandMarkets)
Need a Tailored Report?
Customize this report to your needs
Get 10% FREE Customization
Customize This ReportPersonalize This Research
- Triangulate with your Own Data
- Get Data as per your Format and Definition
- Gain a Deeper Dive on a Specific Application, Geography, Customer or Competitor
- Any level of Personalization
Let Us Help You
- What are the Known and Unknown Adjacencies Impacting the AI Inference Platform-as-a-Service (PaaS) Market
- What will your New Revenue Sources be?
- Who will be your Top Customer; what will make them switch?
- Defend your Market Share or Win Competitors
- Get a Scorecard for Target Partners

Custom Market Research Services
We Will Customise The Research For You, In Case The Report Listed Above Does Not Meet With Your Requirements
Get 10% Free CustomisationTESTIMONIALS

Tetsuya Ohhira
Business Development Manager-Technology Business
Nikon Corporation,
Leading Japanese MNC specializing in optics and imaging productswww.nikon.com
MarketsandMarkets™ response
is quick. Their attitude is flexible and positive. Analyst Insights are globally considered and
significant. Client Services quickly respond to our inquiry and demand. Their wide range of global
surveys help us make our strategic plan.
We hope Knowledge Store will be easier to search
for a report.
VP - Marketing & Business Development
Leading Provider of Process Control Solutions
We engaged with MarketsandMarkets on a study to perform an analysis and recommend a Go-To-Market strategy for metrology and process control in the semiconductor market. The study was tailored to our targets and needs with well-defined milestones. Our overall experience with the MarketsandMarkets team was very good throughout the project in all aspects including the analysis methodologies used, the quality and depth of primary and secondary data sets, the professionalism and flexibility of the team and the ability to meet the target schedule and milestones. We want to thank MarketsandMarkets team for a job well done.
Growth opportunities and latent adjacency in AI Inference Platform-as-a-Service (PaaS) Market


Maria
Apr, 2026
Will I get forecasts segmented by deployment type, like cloud vs. on-premise?.
Lloyd
Apr, 2026
I like how the report identifies growth opportunities in emerging sectors..