
GPU Server Market Size, Share & Trends 2025-2030

GPU Server Market Size, Share & Trends by Deployment (On-premises, Cloud-based), Form Factor (Rack-mounted Server, Blade Server, Tower Server), Function (Training, Inference), Cooling Technology, Application, End-user Industry and Region - Global Forecast to 2030


GPU SERVER MARKET SIZE, SHARE & TRENDS
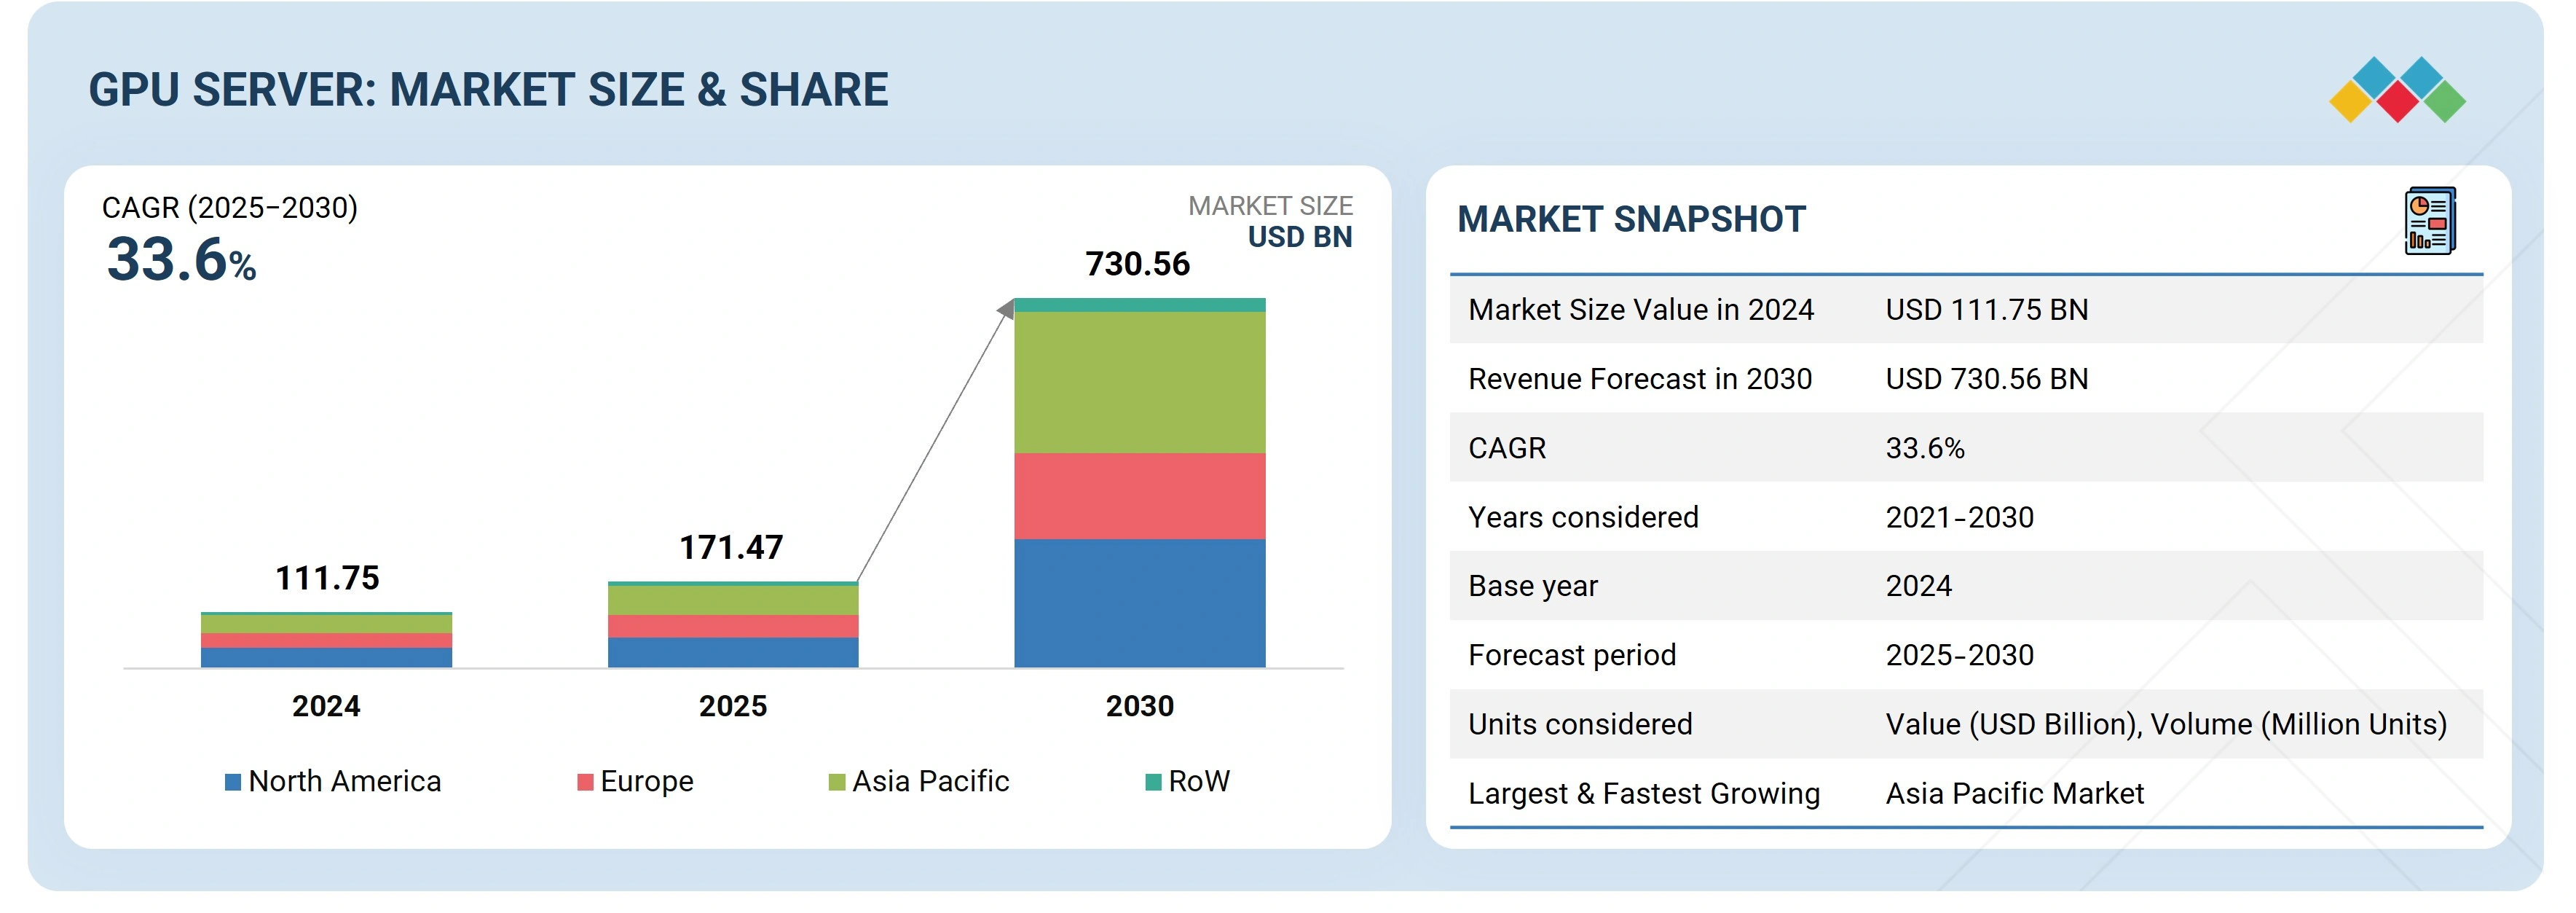
According to Marketsandmarkets, the GPU server market size was valued at USD 171.47 billion in 2025 and is projected to grow USD 730.56 billion by 2030, growing at a CAGR of 33.6% from 2025 to 2030. This growth is inspired by the increase in data traffic and the need for high computing power, machine learning (ML), and intensive teaching algorithms, as businesses and industry increasingly depend on AI technologies for data analysis, automation, and decision-making.
MARKET SNAPSHOT TABLE
| REPORT METRIC | DETAILS |
|---|---|
| Market Size in 2025 (Value) | USD 171.47 Billion |
| Market Forecast in 2030 (Value) | USD 730.56 Billion |
| Growth Rate | CAGR of 33.6% from 2025–2030 |
| Years Considered | 2021–2030 |
| Base Year | 2024 |
| Forecast Period | 2025–2030 |
| Units Considered | Value (USD Billion/Billion), Volume (In thousand/million units) |
| Report Coverage | Revenue forecast, company ranking, competitive landscape, growth factors, and trends |
| Top Companies |
|
| Growth Driver |
|
| Segments Covered | By Function: Training and Inference; By Form Factor: Rack mounted servers, Blade servers, and Tower servers; By Colling Technology: Air cooling, Liquid cooling, and Hybrid Cooling; By Deployment: On-premises and Cloud; By Application: Generative AI, Mach |
| Regional Scope | North America, Europe, Asia Pacific, and RoW |
Market Size & Forecast
• 2025 Market Size: USD 171.47 Billion
• 2030 Projected Market Size: USD 730.56 Billion
• CAGR (2025-2030): 33.6%
• Air cooling Segment: Largest Market Share
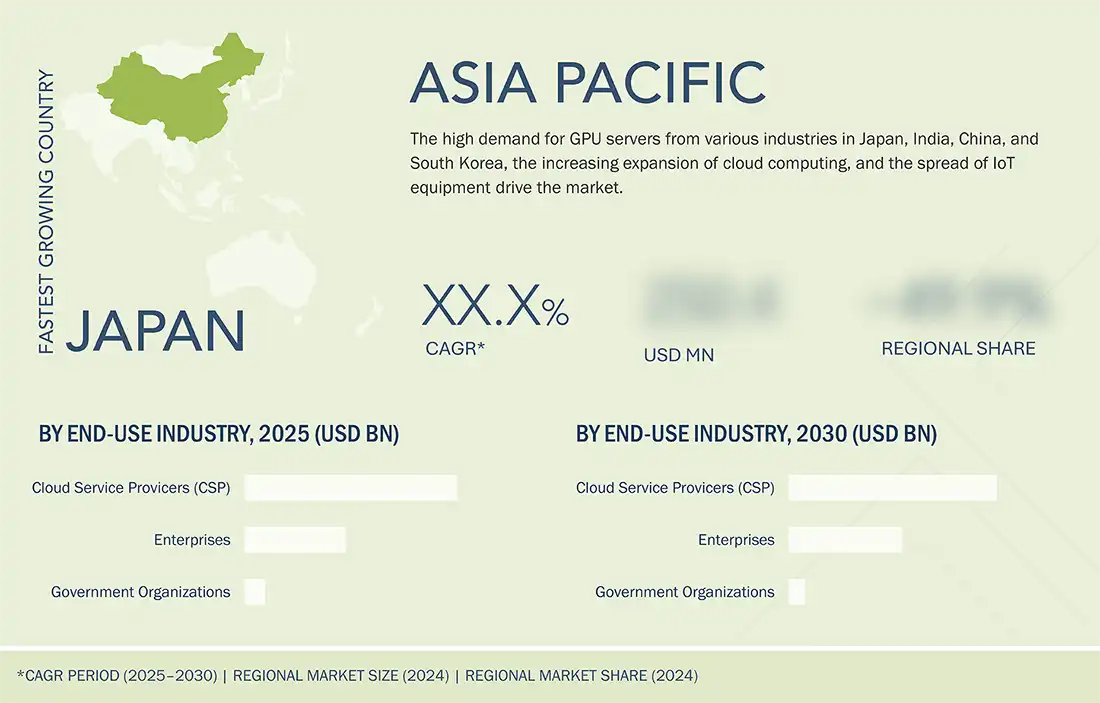
• Asia Pacific: Highest CAGR
KEY TAKEAWAYS
- The Asia Pacific GPU server market is expected to register the highest CAGR during the forecast period.
- By function, the training segment is expected to register the highest CAGR of 31.4% during forecast period.
- By cooling technology, air cooling segment holds the largest market share in 2024
- By form factor, rack-mounted servers is expected to register the highest CAGR of 35.6% during forecast period.
- By application, machine learning segments accounted for a 35.7% revenue share in 2024
- By end user, enterprise segments is expected to register the highest CAGR during the forecast period.
- Company Dell Inc., Hewlett Packard Enterprise Development LP, and Lenovo were identified as some of the star players in the GPU server market (global), given their strong market share and product footprint.
- Companies MiTAC Computing Technology Corporation, Penguin Computing, Inc., among others, have distinguished themselves among startups and SMEs by securing strong footholds in specialised niche areas, underscoring their potential as emerging market leaders
The GPU server industry is projected to grow rapidly over the next decade, due to increasing investment in data centers, creating opportunities for the GPU server market. As these expansions occur, the demand for high-demonstration computing infrastructure to support AI workload will only increase. CSPs such as AWS and Microsoft are investing heavily in upgrading their data center infrastructure to accommodate the growing demand for AI-based applications. The increasing adoption of machine learning (ML) and Deep Learning algorithms is a major driver for the GPU server market.
Source: Secondary Research, Interviews with Experts, MarketsandMarkets Analysis
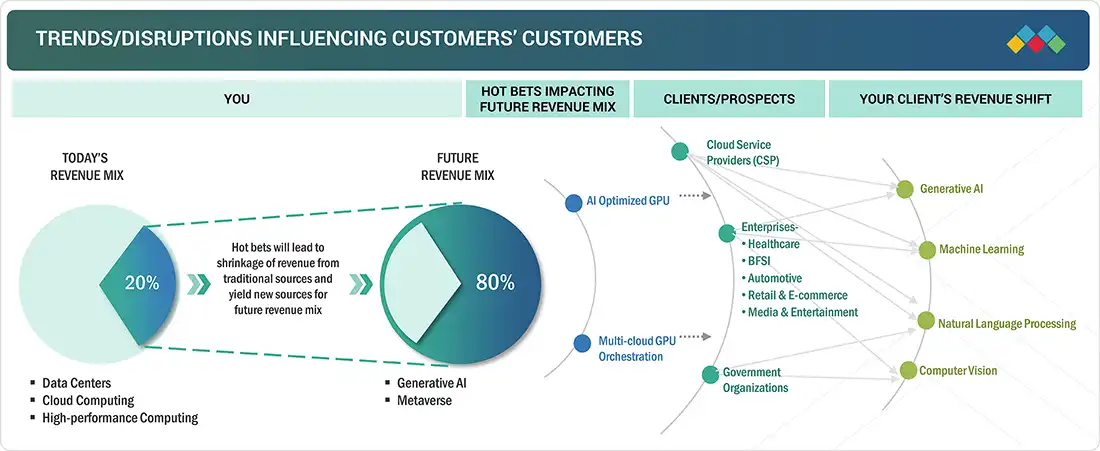
TRENDS & DISRUPTIONS IMPACTING CUSTOMERS' CUSTOMERS
The disruptions and emerging trends impacting customers' businesses in the GPU server market include increasing demand for generative AI, machine learning, and computer vision across various industries and sectors.
Source: Secondary Research, Interviews with Experts, MarketsandMarkets Analysis
MARKET DYNAMICS
Level
-
§Proliferation of connected devices

-
Increasing adoption of machine learning and deep learning algorithms

Level
-
§Shortage of AI hardware experts and skilled workforce

-
Power consumption and cooling challenges for high-density GPU servers

Level
-
§Deployment of AI in healthcare systems

-
Increasing investments in data centers by cloud service providers

Level
-
Data security and privacy concerns

Source: Secondary Research, Interviews with Experts, MarketsandMarkets Analysis
Driver: Increasing adoption of machine learning and deep learning algorithms
The growing adoption of machine learning and deep learning algorithms is a major driver for the GPU server market. Businesses and industries depend more on data analysis, automation, and decision-making AI technologies. Due to massive datasets and complex models, machine learning and deep learning workloads demand significant computational resources. Since AI healthcare, finance, and retail have become integral to commercial operations, companies require a strong, scalable AI infrastructure to handle these demands. In healthcare, AI algorithms analyze therapy images, predict the outbreak of the disease, and personalize treatment plans. In the financial sector, machine learning algorithms are used for fraud detection, risk management, and algorithmic trading.
Restraint: Power consumption and cooling challenges for high-density AI servers
Electricity consumption and cooling challenges associated with high-density GPU servers impose significant restrictions on the GPU server market, especially as the complexity of the AI model and the amount of processed data continue to increase. Demand for advanced AI workloads, such as deep learning training, large-scale simulation, and real-time data processing, requires adequate computational power, which is often provided by GPUs designed for parallel processing.
Opportunity: Increasing investments in data centers by cloud service providers
Increasing investment in data centers by CSPS offers significant development opportunities for the GPU server market, as this expansion enhances the demand for high-performance computing infrastructure required to support AI workloads. CSPs like AWS and Microsoft are investing heavily in upgrading their data center infrastructure to accommodate the growing demand for AI-based applications.
Challenge: Data security and privacy concerns
Data privacy concerns associated with AI-based platforms present a significant challenge to the GPU server market. AI platforms often require large datasets to train the algorithm, frequently involving individual and sensitive information. The collection, storage, and processing of this data raises important privacy issues, as there is a risk of unauthorized access, data violations, and misuse of personal information. Additionally, the complexity and ambiguity of the AI system can make it challenging to ensure compliance with data safety regulations such as the General Data Protection Regulation (GDPR) in Europe.
GPU Server Market: COMMERCIAL USE CASES ACROSS INDUSTRIES
| COMPANY | USE CASE DESCRIPTION | BENEFITS |
|---|---|---|
 |
GPU server for healthcare, BFSI, automotive, and others | Rapid data transfer, reducing the total cost of ownership, helping enterprises to accelerate their AI/ML strategies |
 |
GPU server for healthcare, BFSI, automotive, manufacturing, telecommunication, defense, and others | Robust security and scalability features, faster decision making, boosting productivity |
 |
GPU cloud server for data center and AI research industry | Ideal for handling computational task and enhance cloud deployment |
 |
GPU server for healthcare, BFSI, automotive, and others | Ideal for workloads like natural language processing, image recognition, recommendation systems, and scientific research. |
 |
GPU server for healthcare, BFSI, automotive, retail, telecommunication, government, and others | Virtualized GPU Resource Allocation, Scalable compute for automotive and manufacturing digital twin environments. |
Logos and trademarks shown above are the property of their respective owners. Their use here is for informational and illustrative purposes only.
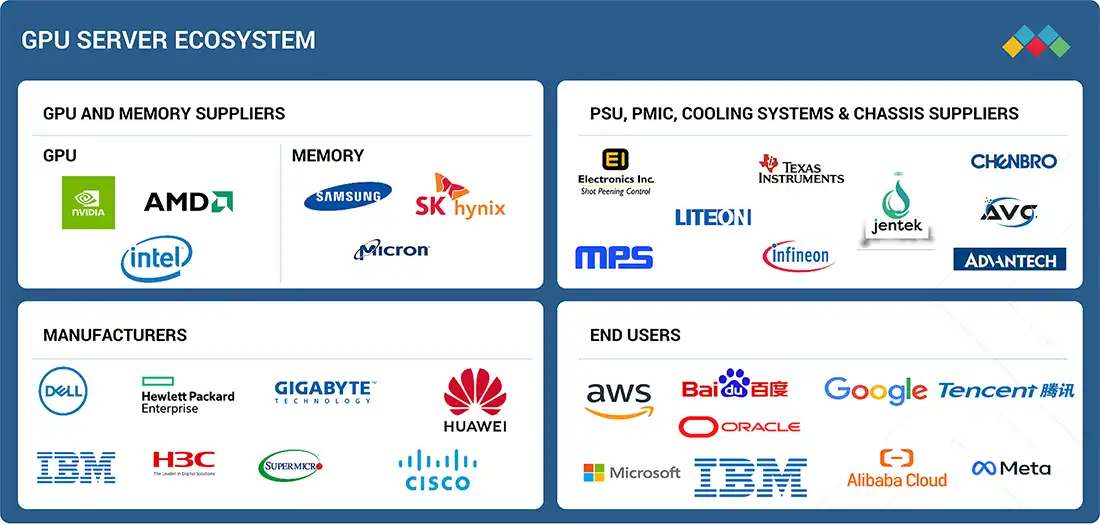
MARKET ECOSYSTEM
The GPU server ecosystem includes research and development, raw material providers, GPU server manufacturers, system integrators, and applications. In the connected supplier ecosystem, different GPU server technologies have been mentioned: electrochemical, optical, thermal, piezoelectric, nanomechanical, and others. A few of the companies involved across the GPU servers ecosystem are NVIDIA Corporation (US), Dell Inc. (US), Hewlett Packard Enterprise Development LP (US), Lenovo (Hong Kong), Huawei Technologies Co., Ltd. (China), IBM (US), H3C Technologies Co., Ltd. (China), Cisco Systems, Inc. (US), Fujitsu (Japan), and INSPUR Co., Ltd. (China), and others.
Logos and trademarks shown above are the property of their respective owners. Their use here is for informational and illustrative purposes only.
MARKET SEGMENTS
Source: Secondary Research, Interviews with Experts, MarketsandMarkets Analysis
GPU Server Market, By Function
The inference segment is projected to witness the highest CAGR in the GPU server market during the forecast period, due to the rapid proliferation of AI-driven applications and the increasing shift of workloads from centralized training to real-time, distributed inference. Unlike training, which occurs periodically, inference happens continuously across billions of transactions in healthcare, automotive, retail, and finance industries, driving higher demand for scalable GPU servers.
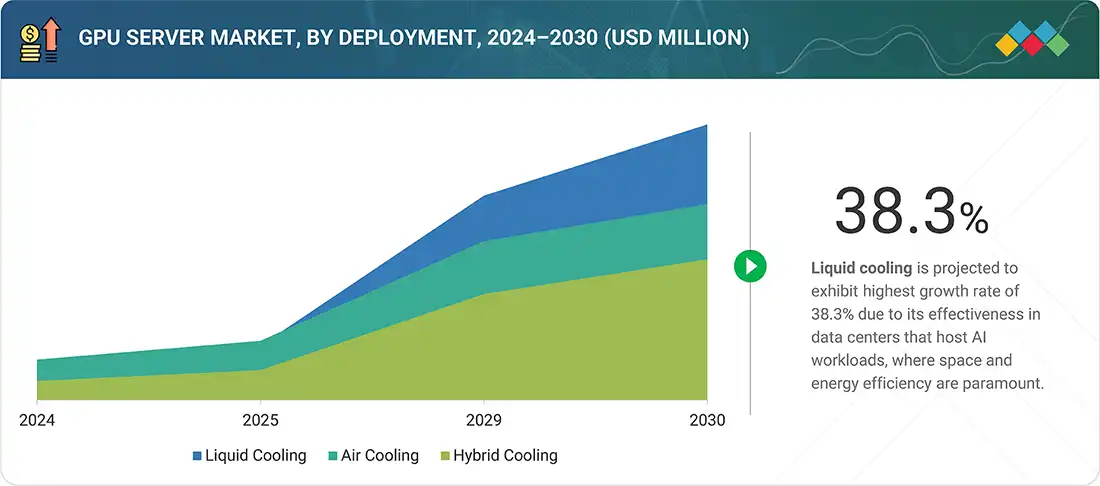
GPU Server Market, By Cooling Technology
The liquid cooling segment is expected to hold the largest share of the GPU server market by 2030. Liquid cooling technology is rapidly reshaping the server cooling landscape due to the increasing cooling demands of high-performance computing (HPC) and AI workloads. Liquid cooling is gaining traction due to its effectiveness in data centers that host AI workloads, where space and energy efficiency are paramount.
GPU Server Market, By Deployment
The cloud segment captured the highest market share in the GPU Server market during the forecast period. The widespread deployment of AI technologies in different verticals fuels the need for AI-based cloud services provided by cloud service providers (CSPs). GPU servers enable these providers to analyze and process immense volumes of data at unprecedented velocities. Cloud service providers (CSPs) are the key drivers of growth in the GPU server market as they offer businesses, developers, and research institutions elastic, on-demand GPU capabilities.
GPU Server Market, By Form Factor
In 2024, the rack-mounted server segment accounted for the largest share of the GPU server market, due to its widespread adoption in large-scale data centers and its ability to handle complex AI workloads. They offer superior scalability and are often preferred by enterprises running extensive AI and ML applications that require flexibility in adding or upgrading hardware.
GPU Server Market, By Application
The generative AI segment holds the largest share in 2024. Generative AI is gaining significant attention due to its ability to create new data, content, and solutions from existing information. This includes various models such as rule-based systems, statistical models, deep learning frameworks, and more advanced architectures like Generative Adversarial Networks (GANs) and autoencoders. Furthermore, the explosive growth in GenAI adoption across industries, from content creation and marketing to code generation, drug discovery, and customer service automation, pushes organizations to invest heavily in GPU infrastructure.
GPU Server Market, By End-user
Between 2025 and 2030, the enterprise segment is expected to register the highest CAGR in the GPU server market. The enterprises segment in the GPU server market includes healthcare, BFSI (banking, financial services, and insurance), automotive, retail and e-commerce, media and entertainment. With their high processing power, the AL-based GPU servers enable real-time analytics, allowing businesses to make data-driven decisions quickly and effectively. Significant progress in AI Hardware has been made to enable companies to integrate AI into their primary operations.
REGION
Asia Pacific to hold the largest market share in the global GPU server market during the forecast period
The Asia Pacific region is projected to grow at the highest CAGR in the GPU server market during the forecast period. Asia Pacific has witnessed significant AI research, development, and deployment advancements. Countries like China, Japan, South Korea, and Singapore are investing substantially in AI research and infrastructure, fostering strong collaborations among academia, industry, and government.
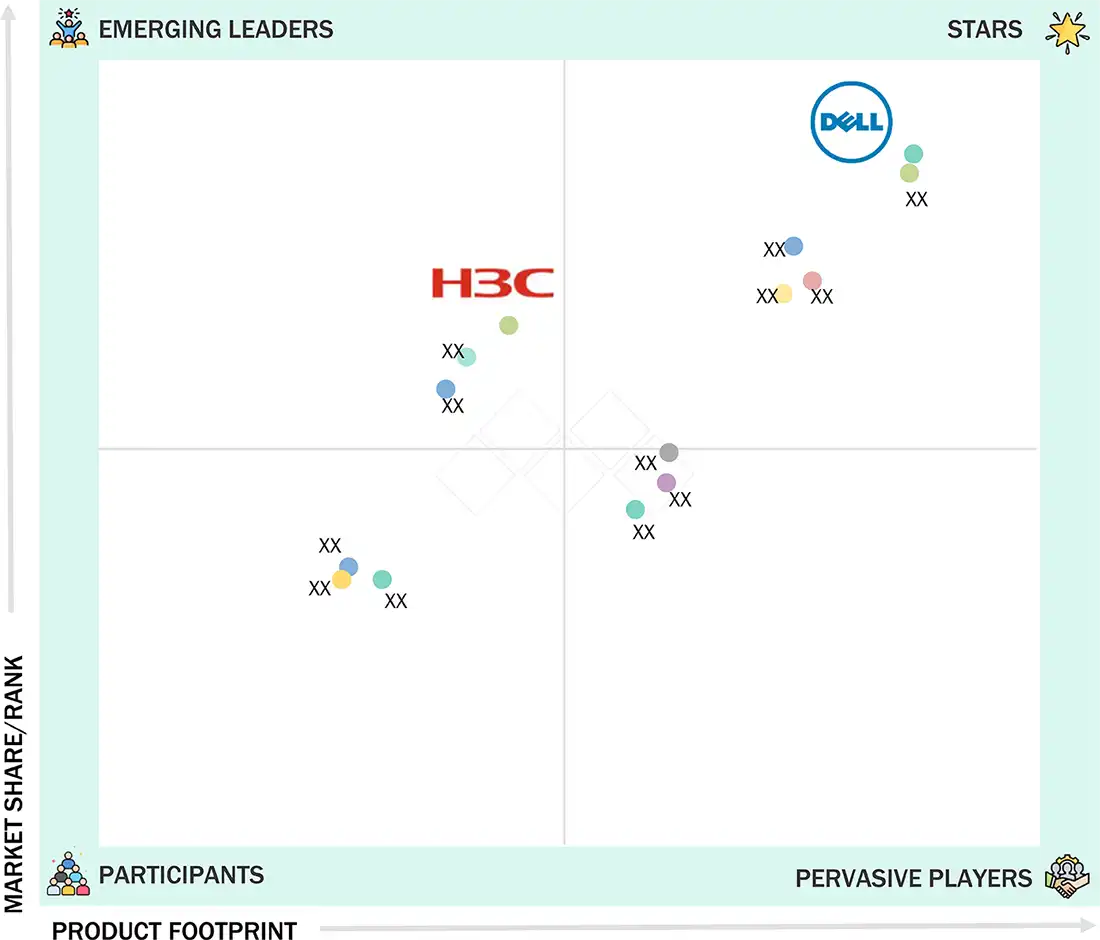
GPU Server Market: COMPANY EVALUATION MATRIX
In the GPU server market matrix, Dell Inc. (Star) leads with a strong market presence and an extensive product portfolio, enabling widespread adoption across CSPs, enterprises, and government organizations. H3C Technologies Co., Ltd. (Emerging Leader) is steadily gaining traction with innovative GPU server-focused healthcare, BFSI, Automotive, and others. While Dell Inc. dominates through scale and an established customer base, H3C Technologies Co., Ltd. demonstrates solid growth potential to advance toward the leaders' quadrant.
Source: Secondary Research, Interviews with Experts, MarketsandMarkets Analysis
KEY MARKET PLAYERS - Top GPU Server Companies
WHAT IS IN IT FOR YOU: GPU Server Market REPORT CONTENT GUIDE
DELIVERED CUSTOMIZATIONS
We have successfully delivered the following deep-dive customizations:
| CLIENT REQUEST | CUSTOMIZATION DELIVERED | VALUE ADDS |
|---|---|---|
| North America-based Cloud Service Provider | • Benchmarking GPU server adoption across hyperscalers (AWS, Azure, GCP, IBM, Oracle) | • Identified cost competitiveness vs hyperscaler peers |
| Competitive & Supplier Landscape | • Mapping of leading GPU server OEMs (NVIDIA, AMD, Intel, Dell, HPE, Supermicro) across regions | • Clear view of competitive intensity and white-space opportunities |
RECENT DEVELOPMENTS
- October 2024: : ADLINK (Taiwan) and SimProBot (US)signed a memorandum of understanding (MOU) to collaborate on building an on-premises AI workstation solution for enterprises. By combining ADLINK's AI GPU servers and Tallgeese AI software, the solution can deliver robust AI computing capabilities for businesses.
- September 2024 : Dell Inc. (US) and Red Hat (US) collaborated to make Red Hat Enterprise Linux AI (RHEL AI) the preferred platform for AI workloads on Dell PowerEdge servers. This partnership simplifies AI deployment by continuously testing and validating hardware, including NVIDIA GPUs, for seamless development and deployment of AI models, helping enterprises accelerate their AI/ML strategies across business applications.
- August 2024 : IBM (US) and Intel (US) partnered to introduce Intel Gaudi 3 AI accelerators on IBM Cloud. This integration will scale cost-efficient enterprise AI for both hybrid and on-premises environments. The partnership also includes the inclusion of Gaudi 3 in IBM's WatsonX AI platform, emphasizing performance, security, and price for AI innovations.
- June 2024 : Hewlett Packard Enterprise Development LP (US) and NVIDIA Corporation (US) announced, 'NVDia AI Computing by HPE, a portfolio of AI Solutions, is designed to accelerate generic AI adoption. The major offer, HPE private cloud AL, integrates NVIDIA AI computing with HPE clouds and storage, providing an energy-skilled, scalable solution for AI workloads. This collaboration includes global partners such as Deloitte and Infosys to support enterprises.
- October 2024 : Super Micro launched its H14 server chain, with AMD EPYC 9005 CPU and AMD Instinct Mi325X GPUS, AL, Cloud, and Edge Workloads. New systems, including hyper and flexwin, increase performance with CPU, AVX-512 support, and skilled cooling options, receive 2.44x rapid processing compared to the pre-model, which enables an AI-ready, power-skilled, and compact data center upgrade.
Table of Contents
 Exclusive indicates content/data unique to MarketsandMarkets and not available with any competitors.
Methodology
The study involved major activities in estimating the current size of the GPU server market. Exhaustive secondary research was done to collect information on GPU servers. The next step was to validate these findings, assumptions, and sizing with industry experts across the value chain using primary research. Different approaches, such as top-down and bottom-up, were employed to estimate the total market size. After that, the market breakup and data triangulation procedures were used to estimate the market size of the segments and subsegments of the GPU server.
Secondary Research
In the secondary research process, various secondary sources were referred to identify and collect information relevant to this study. Secondary sources included annual reports, press releases, and investor presentations of companies; white papers, certified publications, and articles from recognized authors; directories; and databases. Secondary research was mainly carried out to obtain critical information about the industry’s supply chain, value chain, the total pool of key players, and market classification and segmentation according to industry trends, geographic markets, and key developments from both market- and technology-oriented perspectives. Secondary sources included corporate filings (such as annual reports, investor presentations, and financial statements); trade, business, and professional associations; white papers; IoT technologies journals and certified publications; articles by recognized authors; gold- and silver-standard websites; directories; and databases. Data was also collected from secondary sources, such as the Semiconductor Industry Association, Global Semiconductor Alliance, and Taiwan Semiconductor Industry Association.
Secondary research was mainly used to obtain critical information about the supply chain of the industry, the value chain of the market, the total pool of key players, market classification and segmentation according to industry trends to the bottom-most level, geographic markets, and key developments from both the market and technology-oriented perspectives. Secondary data has been gathered and analyzed to determine the overall market size, which has also been validated by primary research.
Primary Research
Extensive primary research was conducted after understanding and analyzing the current scenario of the GPU server market through secondary research. Several primary interviews were held with key opinion leaders from the demand and supply sides in four key regions: North America, Europe, Asia Pacific, and the rest of the world. Nearly 25% of the primary interviews were held with the demand side and 75% with the supply side. The primary data was gathered primarily through telephonic interviews, which were 80% of the total primary interviews. Surveys and e-mails were also utilized to gather data.

Note: Three tiers of companies are defined based on their total revenue as of 2024; tier 1: revenue more than or equal to USD 500 million, tier 2: revenue between USD 100 million and USD 500 million, and tier 3: revenue less than or equal to USD 100 million. Other designations include sales and marketing executives and researchers, as well as members of various GPU server organizations.
To know about the assumptions considered for the study, download the pdf brochure
Market Size Estimation
This report implemented both the top-down and bottom-up approaches to estimate and validate the size of the GPU server market and various other dependent submarkets. Secondary research identified key players in this market, and their market shares in the respective regions were determined through primary and secondary research.
This entire research methodology included the study of annual and financial reports of top companies, as well as interviews with experts (such as CEOs, VPs, directors, and marketing executives) for key insights (both quantitative and qualitative). All percentage shares, splits, and breakdowns were determined using secondary sources and verified through primary sources. All the possible parameters that affect the market covered in this research study were accounted for, viewed in detail, verified through primary research, and analyzed to obtain the final quantitative and qualitative data. This data was consolidated and supplemented with detailed inputs and analysis from MarketsandMarkets and presented in this report. The figures given below show the overall market size estimation process employed for this study.
Bottom-Up Approach
- Key players in the GPU server market were identified through secondary research, and their global market share was determined through primary and secondary research.
- The research methodology included a study of annual and quarterly financial reports, regulatory filings of major market players (public), and interviews with industry experts for detailed market insights.
- All GPU server penetration rates, percentage shares, splits, and breakdowns for the GPU server market were determined using secondary sources and verified through primary sources.
- All key macro indicators affecting the revenue growth of the market segments and subsegments were accounted for, viewed in extensive detail, verified through primary research, and analyzed to obtain validated and verified quantitative and qualitative data.
- The gathered market data was consolidated, enhanced with detailed inputs, analyzed, and presented in this report.
Top-Down Approach
- Focusing on top-line investments and expenditures being made in various end user ecosystems.
- Building and developing the information related to the market revenue generated by key GPU server manufacturers.
- Conduct multiple on-field discussions with the key opinion leaders involved in the development of GPU server products for various end users.
- Estimating geographic splits using secondary sources based on various factors, such as the number of players in a specific country and region, and the level of solutions offered to end users.
GPU Server Market : Top-Down and Bottom-Up Approach

Data Triangulation
After arriving at the overall size of the GPU server market from the estimation process explained above, the market was split into several segments and subsegments. The data triangulation and market breakdown procedures were employed (wherever applicable) to complete the overall market engineering process and arrive at the exact statistics for all segments and subsegments. The data was triangulated by studying various factors and trends from both the demand and supply sides. The size of the GPU server market was validated using both top-down and bottom-up approaches.
Market Definition
The GPU server refers to the global domain that comprises the avenues for developing, producing, deploying, and utilizing servers to equip GPU acceleration for computing. CPU servers are very different from GPU servers. On the contrary, GPU servers embrace parallel processing systems and hence are used for HPC, AI, ML, deep learning, data analytics, scientific simulations, graphics rendering, and blockchain mining. GPU servers are utilized heavily in world industries such as Healthcare, BFSI, Media & Entertainment, Automotive, Cloud Computing, Government, and Research Institutions. The market ranges from several types of GPU servers-Entry level, Midrange, and High-end, to various deployment models-On-premises, Cloud, and Hybrid. Rising requirements for AI Workloads, GenAI Models, and Real-time Data Processing are the key drivers of market growth, thereby leading to global demand for capable, high-performance GPU Server Infrastructure.
Key Stakeholders
- Government, financial institutions, and investment communities
- Analysts and strategic business planners
- Semiconductor product designers and fabricators
- Application providers
- AI platform providers
- Server OEM/ODM
- Business providers
- Professional service/solution providers
- Research organizations
- Technology standard organizations, forums, alliances, and associations
- Technology investors
Report Objectives
- To define, describe, segment, and forecast the GPU server market size, by function, cooling technology, form factor, deployment, application, and end-user Industry, in terms of value
- To forecast the market, based on function, in terms of volume
- To assess the market size of four key regions, namely, North America, Europe, Asia Pacific, and the RoW, in terms of value
- To present detailed information regarding the major factors influencing the growth of the market (drivers, restraints, opportunities, and challenges)
- To provide an ecosystem analysis, Investment and funding analysis, case study analysis, patent analysis, technology analysis, key conferences and events, ASP analysis, Porter’s Five Forces analysis, Key stakeholders and buying criteria, and regulations pertaining to the market
- To offer a comprehensive overview of the value chain of the GPU server market ecosystem
- To critically analyze micromarkets with respect to individual growth trends, prospects, and contributions to the total market
- To strategically profile the key players and comprehensively analyze their market shares and core competencies
- To assess the opportunities in the market for stakeholders and describe the competitive landscape of the market
- To analyze competitive developments in the market, such as collaborations, partnerships, product developments, and research and development (R&D)
- Inclusion of the Macroeconomic Impact market
Available customizations:
With the market data given, MarketsandMarkets offers customizations according to the company’s specific needs. The following customization options are available for the report:
Company Information
- Detailed analysis and profiling of additional market players (up to 7)
Key Questions Addressed by the Report
What is the current size of the GPU Server market?
The global GPU Server market is valued at approximately USD 174.3 billion in 2025. (Grand View Research)
What is the projected market size of GPU servers?
The market is expected to reach around USD 1,545.2 billion by 2033. (Grand View Research)
What is the CAGR of the GPU Server market?
The market is projected to grow at a CAGR of 31.5% (2026–2033). (Grand View Research)
What are the key growth drivers of the GPU Server market?
Growth is driven by AI/ML adoption, deep learning workloads, big data analytics, cloud computing expansion, and HPC demand. (Grand View Research)
Which application segment dominates the GPU Server market?
The Artificial Intelligence & Machine Learning (AI/ML) segment holds the largest share due to high demand for accelerated computing. (Grand View Research)
Which region leads the GPU Server market?
North America holds the largest market share (around 37.2% in 2025) due to strong AI infrastructure investment. (Grand View Research)
Which region is growing the fastest?
Asia Pacific is the fastest-growing region, driven by rapid digital transformation and cloud adoption. (Grand View Research)
Who are the key companies in the GPU Server market?
Major players include NVIDIA, Dell Technologies, HPE, Lenovo, Cisco, Intel, AMD, IBM, Huawei, and Supermicro. (Grand View Research)
What are the key market trends?
Trends include AI-native infrastructure, GPU-accelerated cloud servers, liquid cooling systems, and hybrid cloud deployments. (Grand View Research)
What does the GPU Server market report include?
The report covers GPU type, server type, deployment, application, end-use industries, regional analysis, and forecasts up to 2033. (Grand View Research)
Need a Tailored Report?
Customize this report to your needs
Get 10% FREE Customization
Customize This ReportPersonalize This Research
- Triangulate with your Own Data
- Get Data as per your Format and Definition
- Gain a Deeper Dive on a Specific Application, Geography, Customer or Competitor
- Any level of Personalization
Let Us Help You
- What are the Known and Unknown Adjacencies Impacting the GPU Server Market
- What will your New Revenue Sources be?
- Who will be your Top Customer; what will make them switch?
- Defend your Market Share or Win Competitors
- Get a Scorecard for Target Partners

Custom Market Research Services
We Will Customise The Research For You, In Case The Report Listed Above Does Not Meet With Your Requirements
Get 10% Free CustomisationTESTIMONIALS

Tetsuya Ohhira
Business Development Manager-Technology Business
Nikon Corporation,
Leading Japanese MNC specializing in optics and imaging productswww.nikon.com
MarketsandMarkets™ response
is quick. Their attitude is flexible and positive. Analyst Insights are globally considered and
significant. Client Services quickly respond to our inquiry and demand. Their wide range of global
surveys help us make our strategic plan.
We hope Knowledge Store will be easier to search
for a report.
VP - Marketing & Business Development
Leading Provider of Process Control Solutions
We engaged with MarketsandMarkets on a study to perform an analysis and recommend a Go-To-Market strategy for metrology and process control in the semiconductor market. The study was tailored to our targets and needs with well-defined milestones. Our overall experience with the MarketsandMarkets team was very good throughout the project in all aspects including the analysis methodologies used, the quality and depth of primary and secondary data sets, the professionalism and flexibility of the team and the ability to meet the target schedule and milestones. We want to thank MarketsandMarkets team for a job well done.


Growth opportunities and latent adjacency in GPU Server Market