Automotive Suspension Market by Architecture (MacPherson Strut, Double Wishbone, Multilink, Twist Beam, Leaf Spring, Air Suspension), System, Actuation, Component, Vehicle (ICE, Electric, Off- Highway), Aftermarket & Region - Global Forecast to 2033

icon1
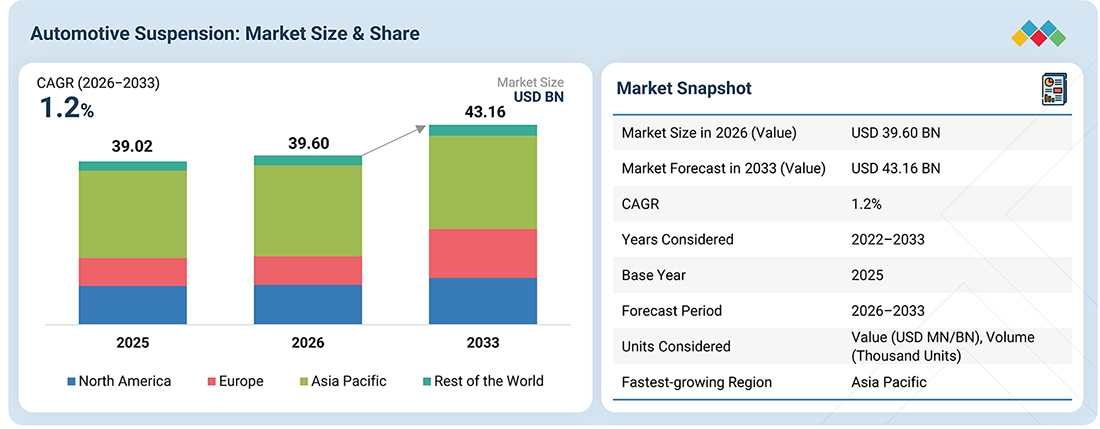
USD 43.16 BN
MARKET SIZE, 2033
icon2
CAGR 1.2%
(2026-2033)
icon3
370
REPORT PAGES
icon4
230
MARKET TABLES

OVERVIEW

automobile-suspension-systems-market Overview

Source: Secondary Research, Interviews with Experts, MarketsandMarkets Analysis

The automotive suspension market is projected to reach USD 43.16 billion by 2033 from USD 39.60 billion in 2026, with a CAGR of 1.2%. Rising vehicle mass, higher axle loads, and complex underbody packaging are forcing OEMs to adopt more robust, space-efficient suspension architectures across modern vehicle platforms. To balance heavy-duty durability with superior ride comfort and handling, manufacturers are increasingly transitioning to multi-link, air-suspension, and highly scalable modular setups. Concurrently, the proliferation of ADAS and automated vehicle-dynamics functions requires precise wheel positioning, continuous body-motion control, and stable tire contact to optimize braking and steering performance under all driving conditions. Overall, the market is transitioning toward lightweight, adaptive, sensor-enabled, and software-tunable suspension, while conventional architectures remain important in high-volume applications. According to ZF, active and semi-active suspension technologies are expected to gain increasing market penetration as electrification, software-defined vehicles, and automated driving raise requirements for intelligent chassis control. Also, ZF expects its Chassis 2.0 portfolio for automotive suspension system will contribute nearly 33% of the global market by the end 2030 and generating a revenue approximately USD 5.51 billion.

KEY TAKEAWAYS

  • MARKET SNAPSHOT:
    Market Size (2025): USD 39.02 Billion
    Current Market Size (2026): USD 39.60 Billion
    Projected Market Size (2033): USD 43.16 Billion
    CAGR (2026–2033):  1.2%
  • BY REGION
    High vehicle production volumes across China, Japan, India, and South Korea, together with expanding passenger-vehicle manufacturing and increasing adoption of advanced chassis technologies, make Asia Pacific the largest regional market, accounting for >55% of the automotive suspension market in 2026 in terms of value.
  • ACTIVE SUSPENSION, BY ACTUATOR
    Air suspension provides superior ride comfort, load leveling, and adjustable ride height, supporting its growing adoption in premium vehicles and commercial vehicles, with a CAGR more than 6% during the forecast period.
  • AFTERMARKET, BY COMPONENT
    Shock absorber has high replacement cycle due to wear & tear, road conditions, and vehicle aging, combined with the large global vehicle parc, making shock absorbers the largest aftermarket component, accounting for >4.0% of the market in 2026 in terms of value.
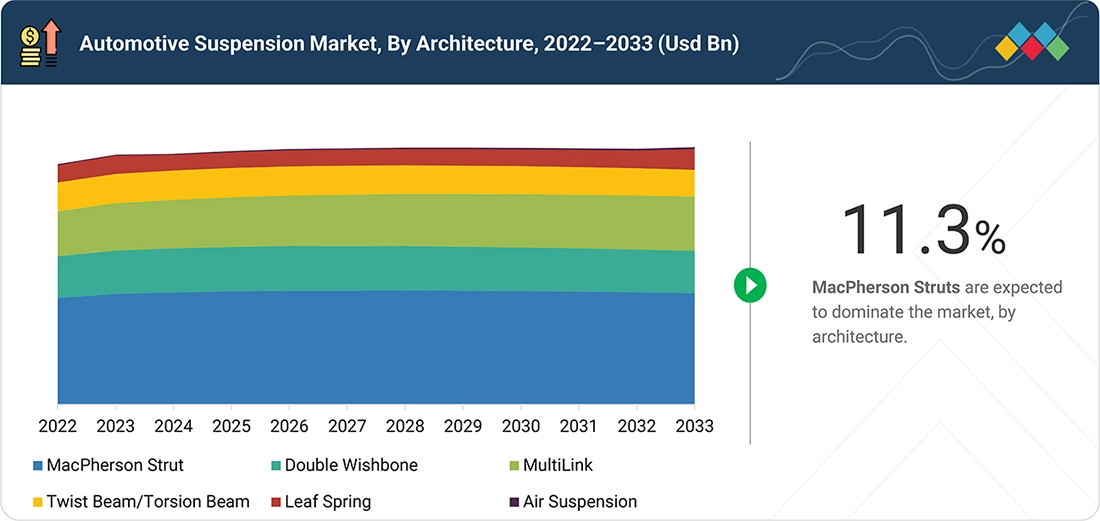
  • BY ARCHITECTURE
    Air suspension offers better ride comfort, adjustable ride height, and load-leveling capabilities, making it suitable for premium vehicles, SUVs, buses, and HCVs. Growing demand for enhanced ride quality and vehicle stability is expected to drive its adoption, with a CAGR of 3.8% during the forecast period.
  • COMPETITIVE LANDSCAPE
    Key players such as ZF Friedrichshafen AG (Germany), Hyundai Mobis (South Korea), Tenneco Inc. (US), Thyssenkrupp AG (Germany), and Magna International Inc. (Canada) are focusing on active and semi-active damping, electronically controlled suspension, lightweight suspension components, adaptive ride-height control, and integrated chassis technologies. Strategic initiatives include new product launches, production expansion, OEM supply agreements, and technology partnerships, with increasing emphasis on adaptive and electronically controlled suspension systems that improve comfort, handling, safety, and vehicle efficiency.
  • COMPETITIVE LANDSCAPE
    Multimatic Inc. and King Shocks, among other specialized suspension suppliers, have established positions in performance-oriented, off-road and niche vehicle applications, highlighting their potential as emerging market participants in the automotive suspension market

The automotive suspension market is shifting from conventional passive systems to adaptive, electronically controlled, air, and active suspension technologies, particularly in premium, EV, and software-defined vehicle applications. Conventional suspension remains the dominant volume segment because of its lower cost, simpler architecture, and broad adoption across mass-market passenger vehicles; however, increasing vehicle weight from electrification, higher comfort expectations, and ADAS integration are driving greater demand for electronically controlled suspension systems. ZF reported in 2025 that around 25 million vehicles globally were equipped with air suspension, while its active sMOTION system has entered series production, demonstrating the progression toward intelligent chassis technologies. Consequently, suspension systems are shifting from mechanically optimized components to sensor-driven, software-controlled architectures, with ZF's Smart Chassis Sensor and AI-based road-sensing technologies enabling real-time adjustment of damping and chassis behavior. This creates differentiated growth opportunities: passive suspension continues to drive market volume, while adaptive, air, and active suspension capture more value per vehicle as OEMs prioritize ride comfort, handling, safety, and software-defined chassis functionality.

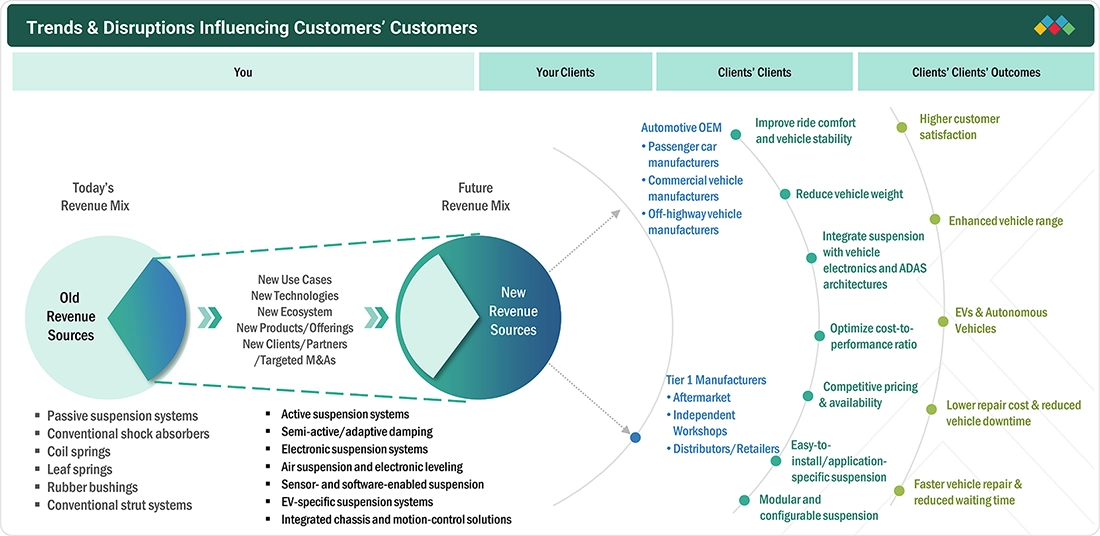
TRENDS & DISRUPTIONS IMPACTING CUSTOMERS' CUSTOMERS

Changes in vehicle architectures and emerging technology trends in the automotive suspension market are directly influencing OEMs and Tier-I suppliers. The growing adoption of EVs, heavier battery packs, software-defined vehicles, and connected chassis systems is increasing demand for lightweight, durable, and electronically controlled suspension solutions that improve ride comfort, handling, safety, and energy efficiency. These shifts are cascading across the value chain, from material and component suppliers to suspension system manufacturers and vehicle OEMs, while creating opportunities for active and semi-active damping, adaptive air suspension, electronic ride-height control, multilink architectures, and sensor- and software-enabled suspension systems. At the same time, greater integration of suspension with vehicle dynamics and chassis-control systems is disrupting conventional passive suspension designs and encouraging suppliers to develop modular, scalable, and electronically controlled platforms for next-generation passenger and commercial vehicles.

automobile-suspension-systems-market Disruptions

Source: Secondary Research, Interviews with Experts, MarketsandMarkets Analysis

MARKET DYNAMICS

Drivers
Impact
Level
  • Strong Premium SUV & Pickup Demand
  • Regulatory Pressure to Improve Vehicle & Passenger Safety and Curb Emissions
RESTRAINTS
Impact
Level
  • High System Cost vs. ROI in Non-Premium Segments
OPPORTUNITIES
Impact
Level
  • Integration of Smart/Connected Suspensions with ADAS & SDVs
  • Local Manufacturing & Supply Chain Opportunities
CHALLENGES
Impact
Level
  • Balancing Suspension Weight and Range Efficiency in Electric Vehicles

Source: Secondary Research, Interviews with Experts, MarketsandMarkets Analysis

Driver: Strong Premium SUV & Pickup Demand

Growing SUV and pickup-truck penetration, which now accounts for more than half of global light-vehicle sales, is driving demand for advanced suspension systems. MacPherson struts remain widely adopted due to their compact packaging and cost efficiency, while premium SUVs increasingly use double-wishbone and multi-link architectures to enhance ride comfort, handling, and vehicle stability. Pickup trucks continue to favor double-wishbone front and leaf-spring or multi-link rear configurations to balance load-carrying capability with ride performance. Meanwhile, air suspension is gaining traction in premium ICE and electric SUVs as OEMs respond to rising demand for adaptive ride comfort, improved body control, and enhanced driving dynamics.

Restraint: High System Cost vs. ROI in Non-Premium Segments

High system costs for advanced suspension technologies continue to limit adoption beyond premium and specialized vehicle segments. Conventional architectures, including MacPherson strut, multi-link, and double-wishbone systems, remain dominant across passenger cars, SUVs, and LCVs because of their proven reliability, lightweight design, cost efficiency, and ease of integration. Conventional suspension systems typically cost around USD 200–1,500 per vehicle, supporting their use in high-volume production, whereas air and active suspension systems can cost approximately USD 1,500–4,000 per light vehicle and reach USD 9,000 for heavy-duty trucks. Although advanced systems provide superior ride comfort, handling, and load management, their higher upfront cost limits adoption where the incremental performance benefits do not sufficiently offset the investment.

Opportunity: Integration of Smart/Connected Suspensions with ADAS & SDVs

Software-defined vehicles are creating opportunities to transform suspension systems from mechanical components into intelligent, software-enabled systems. Integration of active damping, air suspension, sensors, and ADAS enables predictive ride control, adaptive load management, and real-time adjustment to road and driving conditions. OEM adoption in premium SUVs, EVs, and pickup trucks is accelerating this transition, while over-the-air (OTA) software updates can enable post-sale suspension calibration, feature upgrades, and new software-based revenue streams. This creates opportunities for Tier-1 suspension suppliers to expand from hardware supply toward integrated mechatronic, sensing, control-software, and lifecycle solutions.

Challenge: Balancing Suspension Weight and Range Efficiency in Electric Vehicles

The rapid adoption of EVs is challenging automakers and suspension suppliers to balance ride performance, durability, and vehicle efficiency. Heavier battery packs increase vehicle mass and impose higher loads on suspension components, while advanced air and multi-link systems can add further weight, potentially affecting driving range and energy consumption. Premium EVs increasingly use reinforced and adaptive suspension systems to maintain ride comfort and handling, whereas mass-market models tend to favor simpler, lightweight architectures to control cost and preserve efficiency. Lightweight materials, optimized dampers, and integrated suspension designs offer a pathway to reduce mass, but achieving cost-effective, scalable adoption across high-volume EV platforms remains a key challenge.

AUTOMOTIVE SUSPENSION MARKET SIZE, SHARE & ANALYSIS: COMMERCIAL USE CASES ACROSS INDUSTRIES

COMPANY USE CASE DESCRIPTION BENEFITS
company logo
ZF applies electronically controlled suspension technologies, including Continuous Damping Control (CDC), sMOTION, and its cubiX chassis-control software, across passenger cars, EVs, SUVs, and commercial vehicles. These systems use vehicle and road-condition data to continuously adjust damping and coordinate chassis functions. ZF is also developing AI-enabled suspension control through AI Road Sense, which can anticipate road conditions and adapt chassis behavior. Improved ride comfort and handling; enhanced vehicle stability; predictive suspension response; better control of heavier EVs; reduced body movement; and opportunities for software-enabled chassis functions and OTA feature upgrades.
company logo
Hyundai Mobis is developing e-Corner and integrated wheel-end technologies that combine steering, braking, driving, and suspension functions at individual wheels. The technology is particularly suited to next-generation EVs, where independent wheel control can support new vehicle architectures, flexible packaging, and advanced maneuverability. Greater vehicle maneuverability; improved low-speed turning and parking; flexible EV packaging; enhanced wheel-level control; reduced mechanical interdependencies; and greater freedom in future vehicle design.
company logo
Tenneco applies Monroe Intelligent Suspension technologies, including CVSAe and CVSA2 electronically controlled dampers, to continuously adjust suspension response based on vehicle inputs and road conditions. Its newer CVSA2 steel-tube variant and DCx passive damper valve expand the technology across EVs, SUVs, premium vehicles, and higher-volume applications. Adaptive ride comfort; improved handling and body control; optimized suspension response across different driving conditions; lower NVH; broader vehicle application coverage; and improved balance between performance and system cost.
company logo
thyssenkrupp develops lightweight springs, stabilizer bars, tubular/split stabilizers, and active-roll-control components for passenger vehicles and EVs. Its VarioShape technology optimizes stabilizer geometry to reduce mass, while split stabilizer bars can be integrated with active roll-control systems. Lower suspension weight; improved roll stability; better handling and ride comfort; reduced material consumption; improved energy efficiency for EVs; and enhanced chassis performance without significant weight increase.

Logos and trademarks shown above are the property of their respective owners. Their use here is for informational and illustrative purposes only.

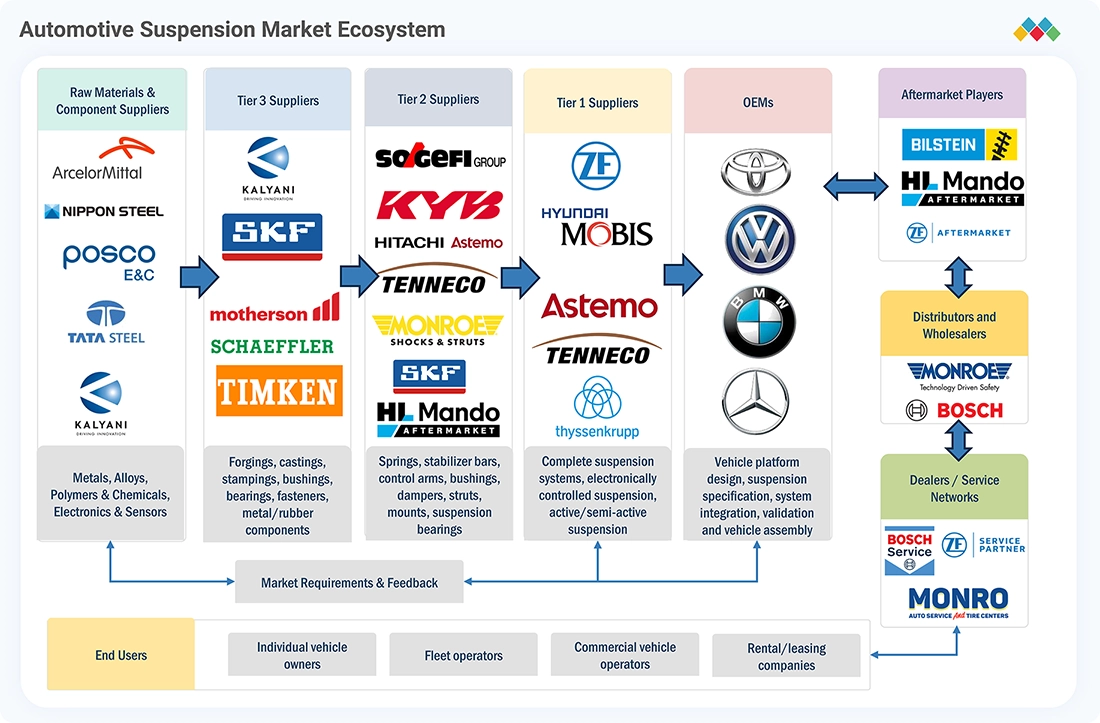
MARKET ECOSYSTEM

The automotive suspension market ecosystem comprises raw material and steel suppliers, suspension component manufacturers, Tier-1 suspension system suppliers, chassis and vehicle-system integrators, automotive OEMs, aftermarket distributors and service networks. Leading players such as ZF, Hyundai Mobis, Tenneco, thyssenkrupp, and Magna International, among others, offer suspension solutions spanning conventional MacPherson, double-wishbone, multi-link, and leaf-spring architectures to electronically controlled damping, air suspension, active roll control, lightweight suspension components, and integrated EV chassis systems. These solutions are increasingly designed around lower vehicle weight, improved ride comfort and handling, higher load-bearing capability, enhanced durability, reduced NVH, EV-specific chassis requirements, and software-enabled adaptive suspension, supporting different vehicle classes, including passenger cars, SUVs, pickups, commercial vehicles, and electric vehicles.

automobile-suspension-systems-market Ecosystem

Logos and trademarks shown above are the property of their respective owners. Their use here is for informational and illustrative purposes only.

MARKET SEGMENTS

automobile-suspension-systems-market Segments

Source: Secondary Research, Interviews with Experts, MarketsandMarkets Analysis

ACTIVE SUSPENSION, BY ACTUATOR

Hydraulic actuators are driving active suspension adoption by enabling real time control of ride height, damping, body roll, and vehicle stability. Hydraulic actuators offer high force capacity for heavy duty, premium, and performance vehicles, while mechanical/electromechanical actuators provide compact, electronically controlled solutions suited to EVs and software defined vehicles. The growing vehicle weight, electrification, and integration of suspension with electronic chassis controls are increasing demand for both actuator technologies, expanding active suspension beyond conventional premium applications.

AFTERMARKET, BY COMPONENT

Shock absorbers are a key aftermarket demand driver as vehicle aging, higher mileage, and road conditions increase wear and replacement requirements. Growing SUV and commercial-vehicle parc further supports demand because higher vehicle mass and load cycles accelerate suspension component wear. The shift toward premium replacement shocks, electronically controlled dampers, and performance-oriented products is also increasing the value of replacement demand beyond basic component replacement.

BY ARCHITECTURE

MacPherson strut remains a major suspension architecture due to its compact packaging, low component count, cost efficiency, and suitability for high volume passenger cars and SUVs. Its ability to combine the spring, damper, and steering knuckle into a compact assembly supports efficient engine bay and EV front axle packaging while reducing vehicle weight and manufacturing complexity. Continued production of mass market vehicles and cost-sensitive EVs is therefore sustaining demand for MacPherson strut systems, making it a key volume driver for the automotive suspension market.

BY SYSTEM

Passive suspension remains the dominant system due to its low cost, proven durability, simple construction, and limited maintenance requirements. Its widespread use across mass-market passenger cars, SUVs, LCVs, and commercial vehicles makes it the primary volume contributor, particularly in cost-sensitive markets and high-production vehicle platforms. The continued expansion of vehicle production and demand for cost-optimized EV platforms is sustaining passive suspension adoption, while advanced materials and optimized damper designs are improving ride and handling without the complexity of active systems.

BY VEHICLE TYPE

Passenger cars are a major demand driver for automotive suspension systems due to their high global production volumes and broad adoption of suspension components across entry-level, mid-range, premium, and electric vehicles. Rising demand for SUVs and EV-based passenger vehicles is increasing requirements for lightweight, durable, and higher-load suspension systems, while premium models are adopting adaptive dampers and air suspension to enhance ride comfort and handling. The large vehicle parc and continued shift toward electrified and higher-content passenger vehicles are therefore supporting both suspension volume and technology value.

OEM, BY COMPONENT

Rubber bushings are a high-volume OEM suspension component because they isolate road-induced vibrations and reduce noise while allowing controlled movement between suspension components. Rising vehicle weight, SUV adoption, and EVs are increasing requirements for improved NVH performance, durability, and load handling, driving development of higher-performance rubber compounds and optimized bushing designs. Their low cost, lightweight construction, and critical role in ride comfort make rubber bushings a recurring component across passenger cars and commercial vehicles, supporting steady OEM suspension demand.

ELECTRIC & HYBRID HCV SUSPENSION, By ARCHITECTURE

Trucks are driving demand for robust suspension architectures as electrification increases vehicle weight and changes axle-load distribution. Leaf-spring and air-suspension architectures are widely used to balance high payload capacity, durability, ride comfort, and load leveling, while electric trucks increasingly require suspension systems optimized for heavier battery packs. The need to maintain payload, component life, and vehicle stability without adding excessive weight is driving OEMs toward reinforced, lightweight, and electronically controlled truck suspension solutions.

ELECTRIC & HYBRID PASSENGER CARS SUSPENSION – BY ARCHITECTURE

Electric and hybrid cars are driving demand for suspension architectures that can manage higher vehicle mass, altered weight distribution, and stronger ride comfort requirements. MacPherson strut remains important in mass-market models due to its compact packaging and cost efficiency, while multi-link and other advanced architectures are increasingly used in premium EVs for improved wheel control and handling. The shift toward heavier battery-powered vehicles is therefore encouraging lightweight, reinforced, and electronically controlled suspension designs, increasing both the technology content and value of suspension systems per vehicle.

OFF-HIGHWAY VEHICLES SUSPENSION, BY APPLICATION

Agricultural tractors are driving demand for durable suspension systems as higher-power tractors, larger implements, and longer operating hours increase load and vibration requirements. Suspension systems absorb uneven-terrain shocks, improve operator comfort, maintain tire-to-ground contact, and support stability during heavy-duty field operations. Growing mechanization and adoption of higher horsepower tractors are increasing demand for robust and increasingly advanced suspension solutions, particularly for high-performance and premium tractor segments.

REGION

Asia Pacific is expected to be the largest region in the global automotive suspension market during the forecast period

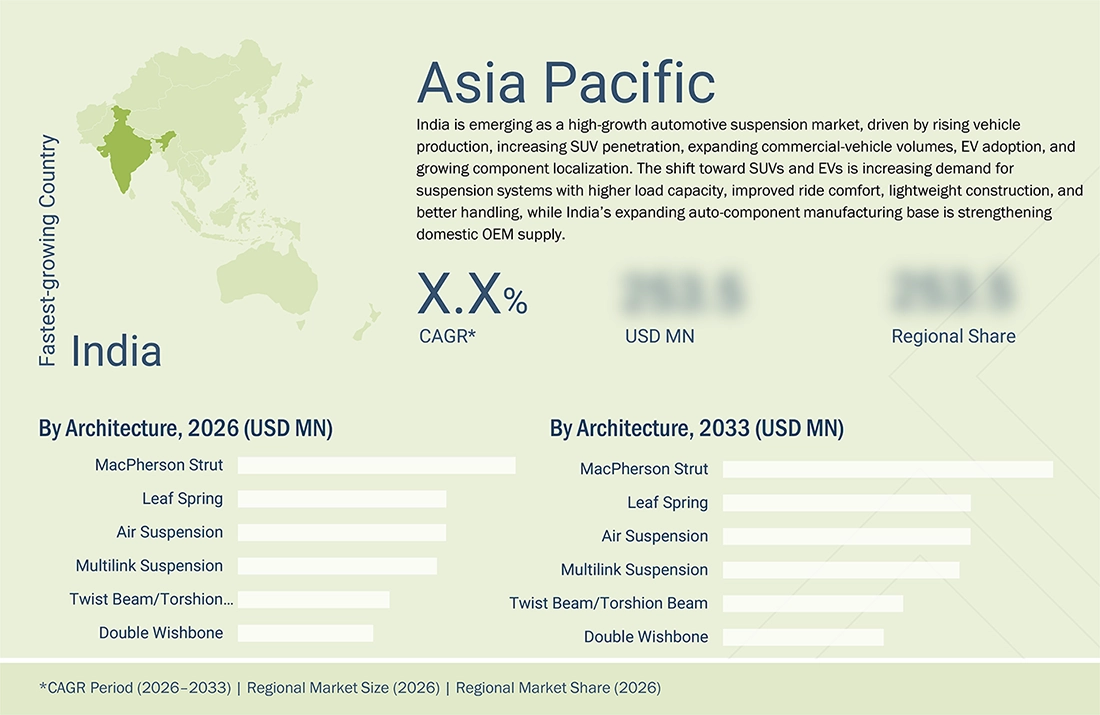
India is emerging as a high-growth automotive suspension market, driven by rising vehicle production, increasing SUV penetration, expanding commercial-vehicle volumes, EV adoption, and growing component localization. The shift toward SUVs and EVs is increasing demand for suspension systems with higher load capacity, improved ride comfort, lightweight construction, and better handling, while India’s expanding auto-component manufacturing base is strengthening domestic OEM supply. Growing vehicle exports are further encouraging suppliers to develop globally competitive suspension components, and the expanding vehicle parc is sustaining aftermarket demand for shock absorbers, struts, bushings, springs, and control arms. Together, increasing vehicle volumes and rising suspension content per vehicle are supporting strong growth in India’s automotive suspension market.

automobile-suspension-systems-market Region

AUTOMOTIVE SUSPENSION MARKET SIZE, SHARE & ANALYSIS: COMPANY EVALUATION MATRIX

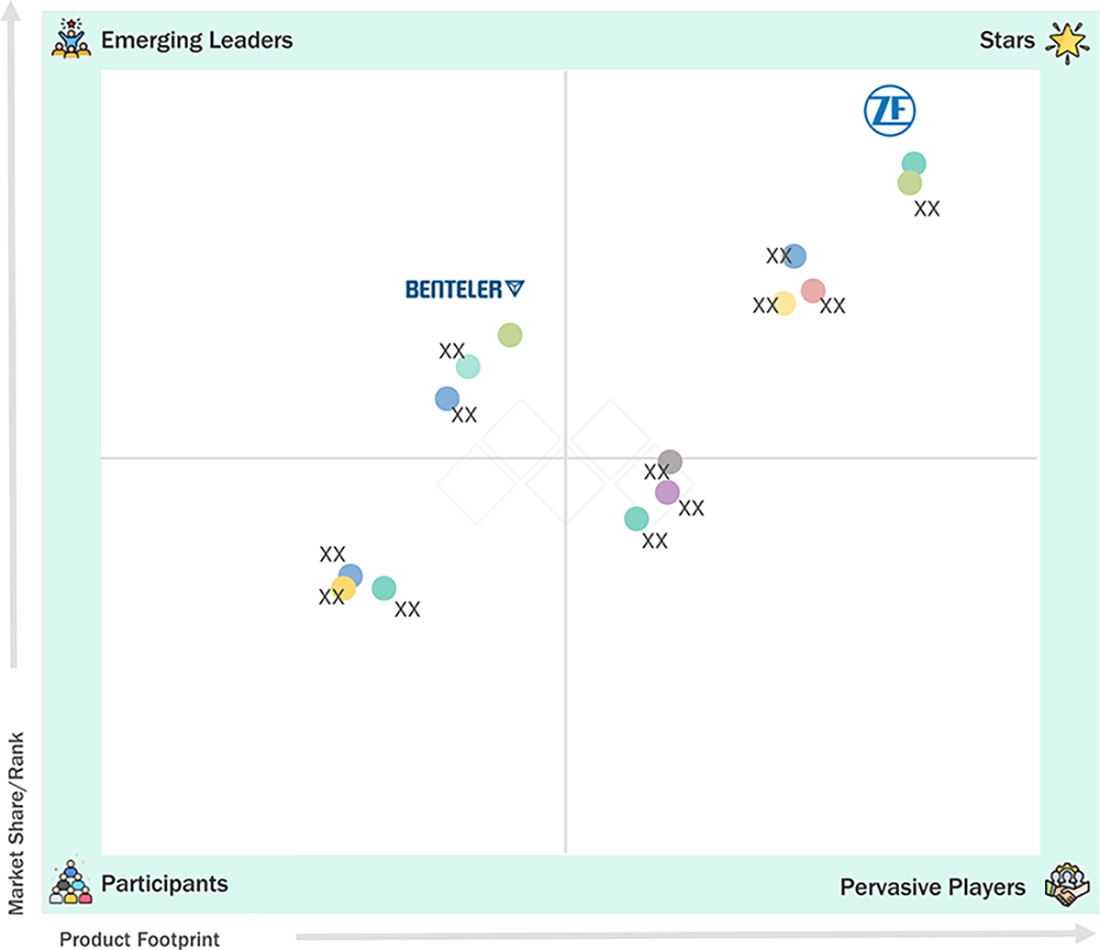
In the automotive suspension market matrix, ZF (Germany) (Star) leads with a strong global presence and a comprehensive portfolio spanning passive, semi-active, and active suspension systems across all vehicle types. Benteler (Austria) (Emerging Leader) is gaining traction with advanced electronically controlled dampers and lightweight suspension modules tailored for EVs and SUVs.

automobile-suspension-systems-market Evaluation Metrics

Source: Secondary Research, Interviews with Experts, MarketsandMarkets Analysis

KEY MARKET PLAYERS

MARKET SCOPE

REPORT METRIC DETAILS
Market Size in 2025 (Value) USD 39.02 Billion
Market Size in 2026 (Value) USD 39.60 Billion
Market Forecast in 2033 (Value) USD 43.16 Billion
Growth Rate CAGR of 1.2% from 2026 to 2033
Years Considered 2022-2033
Base Year 2025
Forecast Period 2026-2033
Units Considered Value (USD Million/Billion), Volume (Thousand Units)
Report Coverage Revenue forecast, company ranking, competitive landscape, growth factors, and trends
Segments Covered • By Vehicle Type: Passenger Cars, Light Commercial Vehicles, Trucks, and Buses • By System: Passive, Semi-active, and Active • By Architecture: MacPherson Strut, Double Wishbone, Multilink, Twist Beam/Torsion Beam, Leaf Spring, and Air Suspension • Active Suspension Market, by Actuation: Hydraulically Actuated and Electronically Actuated • Components (OE Market): Coil Springs, Air Springs, Shock Absorbers, Struts, Control Arms, Rubber Bushings, Leaf Springs, Link Stabilizers/Sway Bars, and Ball Joints • Components (Aftermarket): Shock Absorbers, Struts, Ball Joints, Leaf Springs, Control Arms, and Coil Springs • Electric & Hybrid Passenger Cars Suspension Market, by Architecture: MacPherson Strut, Double Wishbone, Multilink, Twist Beam/Torsion Beam, and Air Suspension • Electric & Hybrid HCVs Suspension Market, By Vehicle Type: Trucks and Buses • Off-highway Vehicles Suspension Market, by Application: Construction Equipment and Agricultural Tractors
Regional Scope Asia Pacific, Europe, North America, and the Rest of the World

WHAT IS IN IT FOR YOU: AUTOMOTIVE SUSPENSION MARKET SIZE, SHARE & ANALYSIS REPORT CONTENT GUIDE

automobile-suspension-systems-market Content Guide

DELIVERED CUSTOMIZATIONS

We have successfully delivered the following deep-dive customizations:

CLIENT REQUEST CUSTOMIZATION DELIVERED VALUE ADDS
Country- and region-wise automotive suspension market outlook Developed country- and regional-level market sizing and forecasts through 2035, covering suspension demand by vehicle type, architecture, system, component, and electrification. Enabled the client to identify high-growth markets and prioritize regional expansion and investment opportunities.
Assessment of passenger cars, SUVs, commercial vehicles, EVs/hybrids, and off-highway suspension demand Analyzed suspension requirements across passenger cars, SUVs, trucks, buses, EVs/hybrids, and agricultural/construction vehicles based on vehicle weight, load, ride comfort, handling, and operating conditions. Helped the client identify vehicle segments with increasing suspension content and component demand
Competitive benchmarking of leading suspension manufacturers Created a benchmarking matrix covering ZF, Tenneco, Hyundai Mobis, thyssenkrupp, Magna, KYB, Hitachi Astemo, Mando, NHK Spring, and other key suppliers based on product portfolio, technology capabilities, architecture, and geographic presence. Provided a clear view of competitor positioning, technology strengths, portfolio gaps, and regional capabilities.
Identification of future OEM sourcing opportunities Assessed OEM requirements and sourcing opportunities based on SUV penetration, EV platform development, lightweighting, ride & handling targets, durability, and cost optimization. Enabled the client to identify potential OEM customers, platform opportunities, and areas for portfolio expansion.
Assessment of advanced suspension technology opportunities Evaluated passive, semi-active, and active suspension technologies, including electronically controlled dampers, air suspension, hydraulic/mechanical actuators, active roll control, sensors, and chassis-control software. Helped the client identify high-value technology opportunities and prioritize investment in next-generation suspension systems.
OEMs expanding EV lineups Evaluation of lightweight materials and suspension components for EV platforms Recommendations for mass reduction without compromising durability, enhancing energy efficiency, and range.

RECENT DEVELOPMENTS

  • July 2026 : Astemo highlighted its TOKICO shock absorber portfolio, including coil-over shocks, MacPherson struts, hydraulic and twin-tube dampers, and performance shocks for SUVs, pickups, and passenger vehicles. It states that 1 in 5 new cars uses Astemo-made OE shock absorbers.
  • June 2026 : KYB expanded its Performance Series through a distribution partnership with Turn 14 Distributing, targeting modern trucks and SUVs.
  • February 2026 : Tenneco positioned its patented DaVinci DCx mechanical frequency-adjusted damper as a scalable platform for multiple OEMs, with Mahindra as the first customer. The technology targets the mid-premium SUV segment in India.
  • September 2025 : At IAA Mobility 2025, ZF presented its “Chassis 2.0” concept, a next-generation intelligent chassis approach integrating by-wire steering and braking with active and semi-active damping systems, electronic roll stabilization, and AKC rear axle steering. These suspension and chassis technologies are designed to be software-defined, enabling optimized driving dynamics, advanced ADAS functions, and automated driving capabilities.
  • July 2025 : ZF introduced its new Smart Chassis Sensor, integrated directly into a ball joint of independent suspension systems. The sensor precisely measures wheel-to-body motion, improving suspension control while reducing the need for separate sensors.
  • July 2025 : DRiV, a Tenneco business group, introduced Monroe Air Suspension alongside Wagner HVAC Components, FP Diesel Starters & Alternators, and Wagner Sensors for the US and Canadian markets. The Monroe Air Suspension line includes air springs, air shocks, and air struts under Monroe, OESpectrum, and Monroe Restore brands, engineered for OE-style fit, reduced noise and vibration, and smooth ride performance, backed by a limited lifetime warranty.
  • April 2025 : Monroe Ride Solutions recently launched the Monroe Intelligent Suspension CVSA2, a semi-active suspension system for SUVs, off-road vehicles, and luxury cars. Featuring steel-tube dampers with dual electro-hydraulic valves, it provides independent rebound and compression damping control for all four wheels, enabling high-resolution tunability, multiple driving modes, and enhanced ride comfort, handling, and vehicle stability across diverse road conditions.


Table of Contents

checkmarkExclusive indicates content/data unique to MarketsandMarkets and not available with any competitors.

TITLE
PAGE NO
1
INTRODUCTION


34
2
EXECUTIVE SUMMARY


41
3
PREMIUM INSIGHTS


47
4
MARKET OVERVIEW
Surging EV adoption and regulatory shifts redefine automotive market dynamics and suspension technologies.


53
 
4.1
INTRODUCTION


4.2
MARKET DYNAMICS


4.2.1
DRIVERS


4.2.1.1
INCREASING SALES OF SUVS AND ELECTRIC VEHICLES


4.2.1.2
RISING IMPLEMENTATION OF STRINGENT VEHICLE SAFETY REGULATIONS


4.2.1.3
RAPID ELECTRIFICATION AND SHIFTING PREFERENCE TOWARD SOFTWARE-DEFINED AND ZONAL VEHICLE ARCHITECTURE


4.2.2
RESTRAINTS


4.2.2.1
HIGH COMPONENT AND SYSTEM COSTS


4.2.3
OPPORTUNITIES


4.2.3.1
ESCALATING ADAS AND SDV ADOPTION


4.2.3.2
SHIFT FROM HIGHLY DISTRIBUTED SYSTEMS TOWARD DOMAIN-BASED ARCHITECTURES


4.2.4
CHALLENGES


4.2.4.1
SUSPENSION WEIGHT CONSTRAINTS IN EV RANGE, PERFORMANCE, AND RIDE OPTIMIZATION


4.3
UNMET NEEDS AND WHITE SPACES


4.4
INTERCONNECTED MARKETS AND CROSS-SECTOR OPPORTUNITIES


4.5
STRATEGIC MOVES BY TIER-1/2/3 PLAYERS


4.6
EV VS. ICE SUSPENSION TECHNOLOGY


4.7
EVOLUTION TO PREDICTIVE/SOFTWARE-CONTROLLED SUSPENSION SYSTEMS


5
INDUSTRY TRENDS
Navigate industry disruptions with insights on supply chain dynamics and regional pricing trends.


63
 
5.1
MACROECONOMIC OUTLOOK


5.1.1
INTRODUCTION


5.1.2
GDP TRENDS AND FORECAST


5.1.3
TRENDS IN GLOBAL AUTOMOTIVE INDUSTRY


5.1.3.1
INVESTMENT ENVIRONMENT


5.2
ECOSYSTEM ANALYSIS


5.2.1
RAW MATERIAL & COMPONENT SUPPLIERS


5.2.2
TIER-2 SUPPLIERS


5.2.3
TIER-1 SUPPLIERS


5.2.4
OEMS


5.2.5
AFTERMARKET PLAYERS


5.3
SUPPLY CHAIN ANALYSIS


5.4
PRICING ANALYSIS


5.4.1
AVERAGE SELLING PRICE (REGIONAL) FOR LIGHT-DUTY VEHICLE SUSPENSION SYSTEM


5.4.2
AVERAGE SELLING PRICE (REGIONAL) FOR TRUCK SUSPENSION SYSTEM


5.4.3
AVERAGE SELLING PRICE (REGIONAL) FOR AUTOMOTIVE SUSPENSION OE COMPONENT


5.5
TRENDS/DISRUPTIONS IMPACTING CUSTOMER BUSINESS


5.6
KEY CONFERENCES AND EVENTS, 2026–2028


5.7
TRADE ANALYSIS


5.7.1
IMPORT SCENARIO (HS CODE 870880)


5.7.2
EXPORT SCENARIO (HS CODE 870880)


5.7.3
TRADE RESTRICTIONS


5.7.4
US-CHINA EXPORT BANS


5.7.5
EU SUBSIDY RACE


5.7.6
IMPACT OF LOCALIZATION POLICIES ON SOURCING


5.8
CASE STUDY ANALYSIS


5.8.1
LINK AND VOLVO ENGINEERING TEAMS COLLABORATED TO DEVELOP PROPRIETARY APPLICATION AND VALIDATE FUEL SAVINGS


5.8.2
EMPLOYEES OF HENDRICKSON USA, L.L.C. IMPORTED CREO CAD GEOMETRY OF SUSPENSION SYSTEM


5.8.3
CONTINENTAL AG DEVELOPED HITEMP AIR SPRINGS, CAPABLE OF WITHSTANDING TEMPERATURES


5.9
INVESTMENT AND FUNDING SCENARIO


5.10
REVENUE OPPORTUNITY FROM ADVANCED SUSPENSION


5.11
IMPACT OF TRANSITION TO EV ARCHITECTURE ON AUTOMOTIVE SUSPENSION MARKET


5.12
OE AND AFTERMARKET OPPORTUNITY


6
TECHNOLOGICAL ADVANCEMENTS, AI-DRIVEN IMPACT, PATENTS, INNOVATIONS, AND FUTURE APPLICATIONS
AI revolutionizes automotive suspension with intelligent, adaptive systems and predictive maintenance innovations.


86
 
6.1
TECHNOLOGY ANALYSIS


6.1.1
KEY TECHNOLOGIES


6.1.1.1
SOFTWARE-DEFINED VEHICLES


6.1.1.1.1
SOFTWARE-CONTROLLED DAMPING


6.1.1.1.2
CONTINUES SUSPENSION CALIBRATION


6.1.1.1.3
OTA SUSPENSION TUNING


6.1.1.1.4
CENTRALIZED VEHICLE COMPUTING


6.1.1.2
ADVANCED ACTUATION TECHNOLOGIES


6.1.1.2.1
ELECTROMECHANICAL ACTUATORS


6.1.1.2.2
ELECTROHYDRAULIC ACTUATORS


6.1.1.2.3
ELECTROMAGNETIC DAMPERS


6.1.1.2.4
AIR SUSPENSION WITH ELECTRONIC CONTROL


6.1.1.2.5
INTEGRATED ACTUATOR DAMPER MODULES


6.1.2
COMPLEMENTARY TECHNOLOGIES


6.1.2.1
ADAS AND SENSOR FUSION INTEGRATION


6.1.2.2
DRIVE-BY-WIRE TECHNOLOGIES


6.1.3
ADJACENT TECHNOLOGIES


6.1.3.1
LIGHTWEIGHT MATERIALS AND ADDITIVE MANUFACTURING


6.1.3.2
REGENERATIVE SUSPENSION SYSTEMS


6.2
PATENT ANALYSIS


6.2.1
INTRODUCTION


6.3
FUTURE APPLICATIONS


6.4
FUTURE TECHNOLOGY ROADMAP


6.5
SUCCESS STORIES AND REAL-WORLD APPLICATIONS


6.6
IMPACT OF AI/GEN AI ON AUTOMOTIVE SUSPENSION MARKET


6.6.1
AI IN ADVANCED SUSPENSION SYSTEMS – INTELLIGENT, PREDICTIVE AND ADAPTIVE CONTROL


6.6.2
AI AT OEMS – FASTER DEVELOPMENT, VEHICLE-LEVEL OPTIMIZATION AND DIFFERENTIATED DRIVING EXPERIENCES


6.6.3
AI IN PREDICTIVE MAINTENANCE, MANUFACTURING AND AFTERMARKET SERVICES


6.7
SUCCESS STORIES AND REAL-WORLD APPLICATIONS


6.7.1
ZF FRIEDRICHSHAFEN: AI-DRIVEN ADAPTIVE DAMPER CALIBRATION


6.7.2
KYB CORPORATION: PREDICTIVE MAINTENANCE FOR ELECTRONIC DAMPERS


6.7.3
HITACHI ASTEMO: ELECTROHYDRAULIC ACTUATOR OPTIMIZATION


6.7.4
CONTINENTAL: SMART AIR SPRING WITH SENSOR INTEGRATION


7
REGULATORY LANDSCAPE
Navigate complex global regulations with insights into regional compliance and key regulatory bodies.


102
 
7.1
REGIONAL REGULATIONS AND COMPLIANCE


7.1.1
REGULATORY BODIES, GOVERNMENT AGENCIES, AND OTHER ORGANIZATIONS


7.1.2
GLOBAL SAFETY REGULATIONS


8
CUSTOMER LANDSCAPE AND BUYER BEHAVIOR
Unlock the intricate dynamics of stakeholder influence and unmet needs shaping market profitability.


108
 
8.1
DECISION-MAKING PROCESS


8.2
KEY STAKEHOLDERS INVOLVED IN BUYING PROCESS AND THEIR EVALUATION CRITERIA


8.2.1
KEY STAKEHOLDERS IN BUYING PROCESS


8.2.2
BUYING CRITERIA


8.3
ADOPTION BARRIERS AND INTERNAL CHALLENGES


8.4
UNMET NEEDS OF VARIOUS END-USE INDUSTRIES


8.5
MARKET PROFITABILITY


8.5.1
MARKET PROFITABILITY FOR ELECTRIC BUSES


9
AUTOMOTIVE SUSPENSION AFTERMARKET, BY COMPONENT
Market Size & Growth Rate Forecast Analysis to 2033 in USD Million and Units | 28 Data Tables


114
 
9.1
INTRODUCTION


9.2
SHOCK ABSORBERS


9.2.1
INCREASING VEHICLE PARC, AGING VEHICLES, HIGH ANNUAL MILEAGE, AND UNPAVED ROADS TO CONTRIBUTE TO SEGMENTAL GROWTH


9.3
STRUTS


9.3.1
LARGE GLOBAL INSTALLED BASE OF VEHICLES, HIGH ANNUAL MILEAGE, AND POOR ROAD CONDITIONS TO FUEL SEGMENTAL GROWTH


9.4
BALL JOINTS


9.4.1
RISING DEMAND FOR SUVS, PICKUPS, AND LIGHT COMMERCIAL VEHICLES TO BOLSTER SEGMENTAL GROWTH


9.5
LEAF SPRINGS


9.5.1
INCREASING COMMERCIAL VEHICLE ADOPTION, FLEET OPERATIONS, LAST-MILE DELIVERY, AND LOGISTICS TO EXPEDITE SEGMENTAL GROWTH


9.6
CONTROL ARMS


9.6.1
ABILITY TO AVOID CLUNKING NOISES, EXCESSIVE WHEEL MOVEMENT, OR WOBBLING OF STEERING WHEEL TO FUEL SEGMENTAL GROWTH


9.7
COIL SPRINGS


9.7.1
GROWING PENETRATION OF SUVS TO CONTRIBUTE TO SEGMENTAL GROWTH


9.8
KEY INDUSTRY INSIGHTS


10
AUTOMOTIVE SUSPENSION MARKET, BY ARCHITECTURE
Market Size & Growth Rate Forecast Analysis to 2033 in USD Million and Units | 24 Data Tables


128
 
10.1
INTRODUCTION


10.2
MACPHERSON STRUT


10.2.1
SUITABILITY FOR PASSENGER CARS DUE TO COST-EFFECTIVENESS AND SIMPLE DESIGN TO FOSTER SEGMENTAL GROWTH


10.3
DOUBLE WISHBONE


10.3.1
USE IN PREMIUM VEHICLES DUE TO COMPLEX DESIGN AND HIGH COST TO CONTRIBUTE TO SEGMENTAL GROWTH


10.4
MULTI-LINK


10.4.1
ABILITY TO PROVIDE ENHANCED RIDE QUALITY AND HANDLING TO ACCELERATE SEGMENTAL GROWTH


10.5
TWIST BEAM/TORSION BEAM


10.5.1
APPLICATION SCOPE IN ECONOMIC CARS TO CONTRIBUTE TO SEGMENTAL GROWTH


10.6
LEAF SPRING


10.6.1
PREFERENCE IN HEAVY TRUCKS DUE TO HIGH LOAD-CARRYING CAPACITY TO FACILITATE SEGMENTAL GROWTH


10.7
KEY INDUSTRY INSIGHTS


11
AUTOMOTIVE SUSPENSION MARKET, BY VEHICLE TYPE
Market Size & Growth Rate Forecast Analysis to 2033 in USD Million and Units | 20 Data Tables


139
 
11.1
INTRODUCTION


11.2
PASSENGER CARS


11.2.1
USE OF MACPHERSON STRUT IN PASSENGER CARS TO FOSTER SEGMENTAL GROWTH


11.3
LCVS


11.3.1
DEMAND FOR MULTI-LINK ARCHITECTURE TO CONTRIBUTE TO SEGMENTAL GROWTH


11.4
TRUCKS


11.4.1
NEED FOR LEAF SPRING SUSPENSION IN MAJOR REGIONS TO EXPEDITE SEGMENTAL GROWTH


11.5
BUSES


11.5.1
ADOPTION OF AIR SUSPENSION TO OFFER MAXIMUM COMFORT TO PASSENGERS TO DRIVE MARKET


11.6
KEY INDUSTRY INSIGHTS


12
ACTIVE SUSPENSION MARKET, BY ACTUATION
Market Size & Growth Rate Forecast Analysis to 2033 in USD Million and Units | 12 Data Tables


149
 
12.1
INTRODUCTION


12.2
HYDRAULICALLY ACTUATED


12.2.1
FOCUS ON IMPROVING RESPONSE SPEED, REDUCING ENERGY CONSUMPTION, AND ENABLING PREDICTIVE SENSING TO SPUR DEMAND


12.3
ELECTRONICALLY ACTUATED


12.3.1
INTEGRATION WITH SOFTWARE-DEFINED CHASSIS, ADAS, STEER-BY-WIRE, AND HIGH-VOLTAGE EV ARCHITECTURES TO DRIVE MARKET


12.4
KEY INDUSTRY INSIGHTS


13
AUTOMOTIVE SUSPENSION MARKET, BY SYSTEM
Market Size & Growth Rate Forecast Analysis to 2033 in USD Million and Units | 16 Data Tables


156
 
13.1
INTRODUCTION


13.2
PASSIVE


13.2.1
CONSIDERATION FOR COST EFFICIENCY, RELIABILITY, AND EASE OF MAINTENANCE TO BOOST SEGMENTAL GROWTH


13.3
SEMI-ACTIVE


13.3.1
MOUNTING DEMAND FOR HIGH-PERFORMANCE CARS TO DRIVE MARKET


13.4
ACTIVE


13.4.1
INCREASING NEED FOR AIR SUSPENSION IN BUSES TO FOSTER SEGMENTAL GROWTH


13.5
KEY INDUSTRY INSIGHTS


14
AUTOMOTIVE SUSPENSION OE MARKET, BY COMPONENT
Market Size & Growth Rate Forecast Analysis to 2033 in USD Million and Units | 36 Data Tables


164
 
14.1
INTRODUCTION


14.2
COIL SPRING


14.2.1
RISING PRODUCTION OF HIGH PASSENGER-CARS AND SUVS TO ACCELERATE SEGMENTAL GROWTH


14.3
SHOCK ABSORBER


14.3.1
INCREASING AVAILABILITY OF VEHICLES WITH VARYING WEIGHT, SUSPENSION ARCHITECTURE, AND OPERATING CONDITIONS TO DRIVE MARKET


14.4
STRUT


14.4.1
SHIFTING PREFERENCE TOWARD SUVS AND CROSSOVER VEHICLES TO CONTRIBUTE TO SEGMENTAL GROWTH


14.5
CONTROL ARM


14.5.1
REQUIREMENT FOR ROBUST SUSPENSION COMPONENTS TO MANAGE HIGHER VEHICLE WEIGHTS AND LARGER WHEEL LOADS TO EXPEDITE SEGMENTAL GROWTH


14.6
RUBBER BUSHING


14.6.1
ABILITY TO MINIMIZE THE TRANSMISSION OF NOISE AND SMALL VIBRATIONS TO FUEL SEGMENTAL GROWTH


14.7
LEAF SPRING


14.7.1
NEED FOR HIGH LOAD-CARRYING CAPACITY, DURABILITY, SIMPLICITY, AND LOW MAINTENANCE TO BOLSTER SEGMENTAL GROWTH


14.8
LINK STABILIZER/SWAY BAR


14.8.1
INCREASING EMPHASIS ON HANDLING AND STABILITY TO CONTRIBUTE TO SEGMENTAL GROWTH


14.9
BALL JOINT


14.9.1
FOCUS ON MEETING DEMANDING CHASSIS-PERFORMANCE REQUIREMENTS TO AUGMENT SEGMENTAL GROWTH


14.10
KEY INDUSTRY INSIGHTS


15
ELECTRIC & HYBRID PASSENGER CAR SUSPENSION MARKET, BY ARCHITECTURE
Market Size & Growth Rate Forecast Analysis to 2033 in USD Million and Units | 16 Data Tables


182
 
15.1
INTRODUCTION


15.2
ELECTRIC & HYBRID SUSPENSION MARKET FOR BEVS, PHEVS, AND FCEVS, BY ARCHITECTURE


15.2.1
BEVS, BY ARCHITECTURE


15.2.1.1
USE OF ACTIVE SUSPENSION SYSTEMS TO ENHANCE DRIVING PERFORMANCE TO BOOST SEGMENTAL GROWTH


15.2.2
PHEVS, BY ARCHITECTURE


15.2.2.1
DEMAND FOR MAXIMUM COMFORT AND SAFETY IN PHEVS TO DRIVE MARKET


15.2.3
FCEVS, BY ARCHITECTURE


15.2.3.1
NEED FOR SUSPENSIONS THAT HANDLE ADDED WEIGHT OF HYDROGEN TANKS AND FUEL CELL STACKS TO FOSTER SEGMENTAL GROWTH


15.2.4
INDUSTRY INSIGHTS


16
ELECTRIC & HYBRID HCV SUSPENSION MARKET, BY VEHICLE TYPE
Market Size & Growth Rate Forecast Analysis to 2033 in USD Million and Units | 12 Data Tables


192
 
16.1
INTRODUCTION


16.2
TRUCKS


16.2.1
FOCUS ON MAINTAINING PAYLOAD, STABILITY, COMFORT, SAFETY, AND EFFICIENCY TO FACILITATE SEGMENTAL GROWTH


16.3
BUSES


16.3.1
SHIFTING PREFERENCE TOWARD ELECTRIC AND HYBRID BUSES TO BOLSTER SEGMENTAL GROWTH


16.4
KEY INDUSTRY INSIGHTS


17
OFF-HIGHWAY VEHICLE SUSPENSION MARKET, BY APPLICATION
Market Size & Growth Rate Forecast Analysis to 2033 in Units | 6 Data Tables


199
 
17.1
INTRODUCTION


17.2
CONSTRUCTION EQUIPMENT


17.2.1
INCREASED DEMAND FOR OPERATOR COMFORT AND EQUIPMENT STABILITY TO DRIVE MARKET


17.3
AGRICULTURAL TRACTORS


17.3.1
RISING FARM MECHANIZATION ACTIVITIES TO CONTRIBUTE TO SEGMENTAL GROWTH


17.4
KEY INDUSTRY INSIGHTS


18
AUTOMOTIVE SUSPENSION MARKET, BY REGION
Comprehensive coverage of 6 Regions with country-level deep-dive of 15 Countries | 92 Data Tables.


204
 
18.1
INTRODUCTION


18.2
ASIA PACIFIC


18.2.1
CHINA


18.2.1.1
ESCALATING VEHICLE MANUFACTURING AND SALES TO AUGMENT MARKET GROWTH


18.2.2
INDIA


18.2.2.1
MOUNTING DEMAND FOR VEHICLE COMFORT AND SAFETY TO FOSTER MARKET GROWTH


18.2.3
JAPAN


18.2.3.1
ELECTRIFICATION AND PREMIUM VEHICLE DEVELOPMENT TO DRIVE MARKET


18.2.4
SOUTH KOREA


18.2.4.1
LEADERSHIP IN MOBILITY TECHNOLOGIES AND EV PRODUCTION TO SUPPORT MARKET GROWTH


18.2.5
REST OF ASIA PACIFIC


18.3
NORTH AMERICA


18.3.1
US


18.3.1.1
FOCUS ON ADDRESSING EVOLVING DEMANDS FOR RIDE COMFORT, HANDLING PRECISION, AND HEAVIER VEHICLE PAYLOADS TO DRIVE MARKET


18.3.2
MEXICO


18.3.2.1
STRONG VEHICLE PRODUCTION AND EXPORT BASE TO CREATE MARKET GROWTH OPPORTUNITIES


18.3.3
CANADA


18.3.3.1
INCREASING ADOPTION OF ADVANCED SUSPENSION TECHNOLOGIES TO BOLSTER MARKET GROWTH


18.4
EUROPE


18.4.1
GERMANY


18.4.1.1
RISING DEVELOPMENT AND INTEGRATION OF ADVANCED SUSPENSION ARCHITECTURES TO FUEL MARKET GROWTH


18.4.2
UK


18.4.2.1
GROWING EV ECOSYSTEM AND PREMIUM VEHICLE MANUFACTURING TO EXPEDITE MARKET GROWTH


18.4.3
FRANCE


18.4.3.1
TRANSITION TOWARD ELECTRIFIED AND COMFORT-ORIENTED VEHICLE PLATFORMS TO BOOST MARKET GROWTH


18.4.4
SPAIN


18.4.4.1
INCREASING PRODUCTION OF COMPACT CARS, SUVS, AND LIGHT COMMERCIAL VEHICLES TO ACCELERATE MARKET GROWTH


18.4.5
ITALY


18.4.5.1
GROWING FOCUS ON RIDE QUALITY, HIGH-SPEED STABILITY, AND LIGHTWEIGHT DESIGN TO DRIVE MARKET


18.4.6
RUSSIA


18.4.6.1
INCREASING PRODUCTION OF SUVS, LCVS, AND OFF-ROAD VEHICLES TO SUPPORT MARKET GROWTH


18.4.7
REST OF EUROPE


18.5
ROW


18.5.1
BRAZIL


18.5.1.1
WELL-ESTABLISHED AUTOMOTIVE MANUFACTURING BASE TO CONTRIBUTE TO MARKET GROWTH


18.5.2
SOUTH AFRICA


18.5.2.1
EXPANDING AND AGING VEHICLE FLEET TO CREATE LUCRATIVE MARKET GROWTH OPPORTUNITIES


18.5.3
OTHERS


19
COMPETITIVE LANDSCAPE
Discover strategic insights and financial metrics defining market leaders and emerging competitors.


248
 
19.1
OVERVIEW


19.2
KEY PLAYER COMPETITIVE STRATEGIES/RIGHT TO WIN, 2023–2026


19.3
REVENUE ANALYSIS, 2021–2025


19.4
MARKET SHARE ANALYSIS, 2025


19.5
COMPANY VALUATION AND FINANCIAL METRICS


19.6
BRAND/PRODUCT COMPARISON


19.7
COMPANY EVALUATION MATRIX: KEY PLAYERS, 2025


19.7.1
STARS


19.7.2
EMERGING LEADERS


19.7.3
PERVASIVE PLAYERS


19.7.4
PARTICIPANTS


19.7.5
COMPANY FOOTPRINT: KEY PLAYERS, 2025


19.7.5.1
COMPANY FOOTPRINT


19.7.5.2
REGION FOOTPRINT


19.7.5.3
SYSTEM FOOTPRINT


19.7.5.4
ACTUATION FOOTPRINT


19.7.5.5
VEHICLE TYPE FOOTPRINT


19.8
COMPANY EVALUATION MATRIX: STARTUPS/SMES, 2025


19.8.1
PROGRESSIVE COMPANIES


19.8.2
RESPONSIVE COMPANIES


19.8.3
DYNAMIC COMPANIES


19.8.4
STARTING BLOCKS


19.8.5
COMPETITIVE BENCHMARKING: STARTUPS/SMES, 2025


19.8.5.1
DETAILED LIST OF KEY STARTUPS/SMES


19.8.5.2
COMPETITIVE BENCHMARKING OF KEY STARTUPS/SMES


19.9
COMPETITIVE SCENARIO


19.9.1
PRODUCT LAUNCHES


19.9.2
DEALS


19.9.3
EXPANSIONS


19.9.4
OTHER DEVELOPMENTS


20
COMPANY PROFILES
In-depth Company Profiles of Leading Market Players with detailed Business Overview, Product and Service Portfolio, Recent Developments, and Unique Analyst Perspective (MnM View)


273
 
20.1
KEY PLAYERS


20.1.1
ZF FRIEDRICHSHAFEN AG


20.1.1.1
BUSINESS OVERVIEW


20.1.1.2
PRODUCTS OFFERED


20.1.1.3
RECENT DEVELOPMENTS


20.1.1.3.1
PRODUCT LAUNCHES/DEVELOPMENTS


20.1.1.3.2
EXPANSIONS


20.1.1.4
MNM VIEW


20.1.1.4.1
KEY STRENGTHS


20.1.1.4.2
STRATEGIC CHOICES


20.1.1.4.3
WEAKNESSES AND COMPETITIVE THREATS


20.1.2
HYUNDAI MOBIS


20.1.3
TENNECO INC.


20.1.4
THYSSENKRUPP AG


20.1.5
MAGNA INTERNATIONAL INC.


20.1.6
BWI GROUP


20.1.7
KYB CORPORATION


20.1.8
HL MANDO CORP.


20.1.9
MERITOR, INC.


20.1.10
HENDRICKSON USA, L.L.C.


20.1.11
AUMOVIO


20.2
OTHER KEY PLAYERS


20.2.1
ASTEMO, LTD


20.2.2
SOGEFI S.P.A.


20.2.3
EIBACH


20.2.4
GESTAMP


20.2.5
SIDEM


20.2.6
PEDDERS SUSPENSION & BRAKES


20.2.7
RTS


20.2.8
YSS SUSPENSION


20.2.9
BELLTECH


20.2.10
SKYJACKER SUSPENSIONS


20.2.11
MULTIMATIC INC.


20.2.12
KING SHOCKS


20.2.13
FOX FACTORY, INC.


20.2.14
RANCHO SUSPENSION


20.2.15
TEIN USA


20.2.16
AIR LIFT COMPANY


20.2.17
MOOG INC.


21
RESEARCH METHODOLOGY


337
 
21.1
RESEARCH DATA


21.1.1
SECONDARY DATA


21.1.1.1
LIST OF KEY SECONDARY SOURCES TO ESTIMATE VEHICLE PRODUCTION


21.1.1.2
LIST OF KEY SECONDARY SOURCES TO ESTIMATE AUTOMOTIVE SUSPENSION MARKET


21.1.1.3
KEY DATA FROM SECONDARY SOURCES


21.1.2
PRIMARY DATA


21.1.2.1
PRIMARY INTERVIEWS: DEMAND AND SUPPLY SIDES


21.1.2.2
BREAKDOWN OF PRIMARY INTERVIEWS


21.1.2.3
PRIMARY PARTICIPANTS


21.2
MARKET SIZE ESTIMATION


21.2.1
BOTTOM-UP APPROACH


21.2.2
TOP-DOWN APPROACH


21.3
DATA TRIANGULATION


21.4
RESEARCH LIMITATIONS


21.5
RESEARCH ASSUMPTIONS AND RISK ANALYSIS


22
APPENDIX


351
 
22.1
INSIGHTS FROM INDUSTRY EXPERTS


22.2
DISCUSSION GUIDE


22.3
KNOWLEDGESTORE: MARKETSANDMARKETS’ SUBSCRIPTION PORTAL


22.4
CUSTOMIZATION OPTIONS


22.4.1
AUTOMOTIVE SUSPENSION MARKET, BY ICE VEHICLE TYPE (COUNTRY LEVEL)


22.4.1.1
PASSENGER CARS


22.4.1.1.1
FRONT SUSPENSION, BY ARCHITECTURE


22.4.1.1.2
REAR SUSPENSION, BY ARCHITECTURE


22.4.1.2
LCVS


22.4.1.2.1
FRONT SUSPENSION, BY ARCHITECTURE


22.4.1.2.2
REAR SUSPENSION, BY ARCHITECTURE


22.4.1.3
HCVS


22.4.2
PASSIVE, SEMI-ACTIVE, AND ACTIVE SUSPENSION, BY ARCHITECTURE (COUNTRY LEVEL)


22.4.2.1
MACPHERSON STRUT


22.4.2.2
DOUBLE WISHBONE


22.4.2.3
MULTI-LINK


22.4.2.4
TWIST BEAM/TORSION BEAM


22.4.2.5
LEAF SPRING SUSPENSION


22.4.2.6
AIR SUSPENSION


22.4.3
AUTOMOTIVE SUSPENSION MARKET, ELECTRIC & HYBRID VEHICLE (REGIONAL LEVEL), BY PROPULSION


22.4.3.1
BEV


22.4.3.1.1
FRONT SUSPENSION, BY ARCHITECTURE


22.4.3.1.2
REAR SUSPENSION, BY ARCHITECTURE


22.4.3.2
PHEV


22.4.3.2.1
FRONT SUSPENSION, BY ARCHITECTURE


22.4.3.2.2
REAR SUSPENSION, BY ARCHITECTURE


22.4.3.3
FCEV


22.4.3.3.1
FRONT SUSPENSION, BY ARCHITECTURE


22.4.3.3.2
REAR SUSPENSION, BY ARCHITECTURE


22.4.4
OFF-HIGHWAY SUSPENSION MARKET, BY TYPE AND REGION (REGIONAL LEVEL)


22.4.4.1
CONSTRUCTION EQUIPMENT


22.4.4.1.1
MECHANICAL


22.4.4.1.2
PNEUMATIC


22.4.4.1.3
HYDROPNEUMATICS


22.4.4.2
AGRICULTURAL TRACTORS


22.4.4.2.1
MECHANICAL


22.4.4.2.2
PNEUMATIC


22.4.4.2.3
HYDROPNEUMATICS
 
 
22.5
RELATED REPORTS


22.6
AUTHOR DETAILS


LIST OF TABLES


TABLE 1
INCLUSIONS AND EXCLUSIONS


TABLE 2
EXCHANGE RATE, 2025–2022


TABLE 3
FUTURE REGULATORY MILESTONES FOR AUTOMOTIVE SUSPENSION


TABLE 4
STRATEGIC MOVES OF KEY PLAYERS


TABLE 5
ICE VS. EV SUSPENSION TECHNOLOGY COMPARISION


TABLE 6
GDP PERCENTAGE CHANGE, BY KEY COUNTRY, 2022–2031


TABLE 7
ROLE OF COMPANIES IN AUTOMOTIVE SUSPENSION ECOSYSTEM


TABLE 8
INDICATIVE PRICE (REGIONAL) FOR LIGHT-DUTY VEHICLE SUSPENSION SYSTEM, 2025 (USD/UNIT)


TABLE 9
INDICATIVE PRICE (REGIONAL) FOR TRUCK SUSPENSION SYSTEM, 2025 (USD/UNIT)


TABLE 10
INDICATIVE PRICING (REGIONAL) FOR AUTOMOTIVE SUSPENSION OE COMPONENT, 2025 (US/UNIT)


TABLE 11
AUTOMOTIVE SUSPENSION MARKET: KEY CONFERENCES AND EVENTS, 2026–2028


TABLE 12
IMPORT DATA FOR HS CODE 870880-COMPLIANT PRODUCTS, BY COUNTRY, 2021–2025 (USD THOUSAND)


TABLE 13
EXPORT DATA FOR HS CODE 870880-COMPLIANT PRODUCTS, BY COUNTRY, 2021–2025 (USD THOUSAND)


TABLE 14
TYPES OF TRADE RESTRICTIONS AND SHORT-TERM EFFECT ON AUTOMOTIVE SUSPENSION SUPPLY


TABLE 15
US-CHINA EXPORT BANS: TIMELINE AND EFFECT ON AUTOMOTIVE SEMICONDUCTORS


TABLE 16
MAJOR EU SUBSIDIES AND EXPECTED EFFECT ON AUTOMOTIVE SUPPLY CHAIN


TABLE 17
IMPACT OF LOCALIZATION POLICIES ON OEM SOURCING, BY SUSPENSION AUTOMOTIVE COMPONENT


TABLE 18
LIST OF FUNDING, 2024–2026


TABLE 19
FUTURE REVENUE OPPORTUNITY


TABLE 20
IMPACT OF EV ARCHITECTURE CHANGES ON SUSPENSION


TABLE 21
OE VS. AFTERMARKET OPPORTUNITY


TABLE 22
RECENT SOFTWARE CONTROLLED DAMPING


TABLE 23
OEMS OFFERING OTA SUSPENSION TECHNOLOGY


TABLE 24
OEM INTEGRATING CENTRALIZED VEHICLE COMPUTING


TABLE 25
OEMS OFFERING ELECTROMECHANICAL ACTUATORS


TABLE 26
OEMS OFFERING ELECTROHYDRAULIC ACTUATORS


TABLE 27
KEY PATENTS, 2025–2026


TABLE 28
FUTURE TECHNOLOGY ROADMAP, 2026–2033


TABLE 29
SUCCESS STORIES FROM KEY PLAYERS AND OEMS


TABLE 30
NORTH AMERICA: REGULATORY BODIES, GOVERNMENT AGENCIES, AND OTHER ORGANIZATIONS


TABLE 31
EUROPE: REGULATORY BODIES, GOVERNMENT AGENCIES, AND OTHER ORGANIZATIONS


TABLE 32
ASIA PACIFIC: REGULATORY BODIES, GOVERNMENT AGENCIES, AND OTHER ORGANIZATIONS


TABLE 33
SAFETY REGULATIONS, BY COUNTRY/REGION


TABLE 34
INFLUENCE OF STAKEHOLDERS ON BUYING PROCESS, BY VEHICLE TYPE


TABLE 35
BUYING CRITERIA FOR SUSPENSION TYPES IN PASSENGER CARS


TABLE 36
MARKET PROFITABILITY FOR ELECTRIC BUSES BY VALUE-CHAIN SEGMENT


TABLE 37
AUTOMOTIVE SUSPENSION AFTERMARKET, BY COMPONENT, 2022–2025 (MILLION UNITS)


TABLE 38
AUTOMOTIVE SUSPENSION AFTERMARKET, BY COMPONENT, 2026–2033 (MILLION UNITS)


TABLE 39
AUTOMOTIVE SUSPENSION AFTERMARKET, BY COMPONENT, 2022–2025 (USD MILLION)


TABLE 40
AUTOMOTIVE SUSPENSION AFTERMARKET, BY COMPONENT, 2026–2033 (USD MILLION)


TABLE 41
SHOCK ABSORBERS AFTERMARKET: AUTOMOTIVE SUSPENSION AFTERMARKET, BY REGION, 2022–2025 (MILLION UNITS)


TABLE 42
SHOCK ABSORBERS AFTERMARKET: AUTOMOTIVE SUSPENSION AFTERMARKET, BY REGION, 2026–2033 (MILLION UNITS)


TABLE 43
SHOCK ABSORBERS AFTERMARKET: AUTOMOTIVE SUSPENSION AFTERMARKET, BY REGION, 2022–2025 (USD MILLION)


TABLE 44
SHOCK ABSORBERS AFTERMARKET: AUTOMOTIVE SUSPENSION AFTERMARKET, BY REGION, 2026–2033 (USD MILLION)


TABLE 45
STRUTS AFTERMARKET: AUTOMOTIVE SUSPENSION AFTERMARKET, BY REGION, 2022–2025 (MILLION UNITS)


TABLE 46
STRUTS AFTERMARKET: AUTOMOTIVE SUSPENSION AFTERMARKET, BY REGION, 2026–2033 (MILLION UNITS)


TABLE 47
STRUTS AFTERMARKET: AUTOMOTIVE SUSPENSION AFTERMARKET, BY REGION, 2022–2025 (USD MILLION)


TABLE 48
STRUTS AFTERMARKET: AUTOMOTIVE SUSPENSION AFTERMARKET, BY REGION, 2026–2033 (USD MILLION)


TABLE 49
BALL JOINTS AFTERMARKET: AUTOMOTIVE SUSPENSION AFTERMARKET, BY REGION, 2022–2025 (MILLION UNITS)


TABLE 50
BALL JOINTS AFTERMARKET: AUTOMOTIVE SUSPENSION AFTERMARKET, BY REGION, 2026–2033 (MILLION UNITS)


TABLE 51
BALL JOINTS AFTERMARKET: AUTOMOTIVE SUSPENSION AFTERMARKET, BY REGION, 2022–2025 (USD MILLION)


TABLE 52
BALL JOINTS AFTERMARKET: AUTOMOTIVE SUSPENSION AFTERMARKET, BY REGION, 2026–2033 (USD MILLION)


TABLE 53
LEAF SPRINGS AFTERMARKET: AUTOMOTIVE SUSPENSION AFTERMARKET, BY REGION, 2022–2025 (MILLION UNITS)


TABLE 54
LEAF SPRINGS AFTERMARKET: AUTOMOTIVE SUSPENSION AFTERMARKET, BY REGION, 2026–2033 (MILLION UNITS)


TABLE 55
LEAF SPRINGS AFTERMARKET: AUTOMOTIVE SUSPENSION AFTERMARKET, BY REGION, 2022–2025 (USD MILLION)


TABLE 56
LEAF SPRINGS AFTERMARKET: AUTOMOTIVE SUSPENSION AFTERMARKET, BY REGION, 2026–2033 (USD MILLION)


TABLE 57
CONTROL ARMS AFTERMARKET: AUTOMOTIVE SUSPENSION AFTERMARKET, BY REGION, 2022–2025 (MILLION UNITS)


TABLE 58
CONTROL ARMS AFTERMARKET: AUTOMOTIVE SUSPENSION AFTERMARKET, BY REGION, 2026–2033 (MILLION UNITS)


TABLE 59
CONTROL ARMS AFTERMARKET: AUTOMOTIVE SUSPENSION AFTERMARKET, BY REGION, 2022–2025 (USD MILLION)


TABLE 60
CONTROL ARMS AFTERMARKET: AUTOMOTIVE SUSPENSION AFTERMARKET, BY REGION, 2026–2033 (USD MILLION)


TABLE 61
COIL SPRINGS AFTERMARKET: AUTOMOTIVE SUSPENSION AFTERMARKET, BY REGION, 2022–2025 (MILLION UNITS)


TABLE 62
COIL SPRINGS AFTERMARKET: AUTOMOTIVE SUSPENSION AFTERMARKET, BY REGION, 2026–2033 (MILLION UNITS)


TABLE 63
COIL SPRINGS AFTERMARKET: AUTOMOTIVE SUSPENSION AFTERMARKET, BY REGION, 2022–2025 (USD MILLION)


TABLE 64
COIL SPRINGS AFTERMARKET: AUTOMOTIVE SUSPENSION AFTERMARKET, BY REGION, 2026–2033 (USD MILLION)


TABLE 65
AUTOMOTIVE SUSPENSION MARKET, BY ARCHITECTURE, 2022–2025 (THOUSAND UNITS)


TABLE 66
AUTOMOTIVE SUSPENSION MARKET, BY ARCHITECTURE, 2026–2033 (THOUSAND UNITS)


TABLE 67
AUTOMOTIVE SUSPENSION MARKET, BY ARCHITECTURE, 2022–2025 (USD MILLION)


TABLE 68
AUTOMOTIVE SUSPENSION MARKET, BY ARCHITECTURE, 2026–2033 (USD MILLION)


TABLE 69
MACPHERSON STRUT MARKET, BY REGION, 2022–2025 (THOUSAND UNITS)


TABLE 70
MACPHERSON STRUT MARKET, BY REGION, 2026–2033 (THOUSAND UNITS)


TABLE 71
MACPHERSON STRUT MARKET, BY REGION, 2022–2025 (USD MILLION)


TABLE 72
MACPHERSON STRUT MARKET, BY REGION, 2026–2033 (USD MILLION)


TABLE 73
DOUBLE WISHBONE MARKET, BY REGION, 2022–2025 (THOUSAND UNITS)


TABLE 74
DOUBLE WISHBONE MARKET, BY REGION, 2026–2033 (THOUSAND UNITS)


TABLE 75
DOUBLE WISHBONE MARKET, BY REGION, 2022–2025 (USD MILLION)


TABLE 76
DOUBLE WISHBONE MARKET, BY REGION, 2026–2033 (USD MILLION)


TABLE 77
MULTI-LINK MARKET, BY REGION, 2022–2025 (THOUSAND UNITS)


TABLE 78
MULTI-LINK MARKET, BY REGION, 2026–2033 (THOUSAND UNITS)


TABLE 79
MULTI-LINK MARKET, BY REGION, 2022–2025 (USD MILLION)


TABLE 80
MULTI-LINK MARKET, BY REGION, 2026–2033 (USD MILLION)


TABLE 81
TWIST BEAM/TORSION BEAM MARKET, BY REGION, 2022–2025 (THOUSAND UNITS)


TABLE 82
TWIST BEAM/TORSION BEAM MARKET, BY REGION, 2026–2033 (THOUSAND UNITS)


TABLE 83
TWIST BEAM/TORSION BEAM MARKET, BY REGION, 2022–2025 (USD MILLION)


TABLE 84
TWIST BEAM/TORSION BEAM MARKET, BY REGION, 2026–2033 (USD MILLION)


TABLE 85
LEAF SPRING MARKET, BY REGION, 2022–2025 (THOUSAND UNITS)


TABLE 86
LEAF SPRING MARKET, BY REGION, 2026–2033 (THOUSAND UNITS)


TABLE 87
LEAF SPRING MARKET, BY REGION, 2022–2025 (USD MILLION)


TABLE 88
LEAF SPRING MARKET, BY REGION, 2026–2033 (USD MILLION)


TABLE 89
AUTOMOTIVE SUSPENSION MARKET, BY VEHICLE TYPE, 2022–2025 (THOUSAND UNITS)


TABLE 90
AUTOMOTIVE SUSPENSION MARKET, BY VEHICLE TYPE, 2026–2033 (THOUSAND UNITS)


TABLE 91
AUTOMOTIVE SUSPENSION MARKET, BY VEHICLE TYPE, 2022–2025 (USD MILLION)


TABLE 92
AUTOMOTIVE SUSPENSION MARKET, BY VEHICLE TYPE, 2026–2033 (USD MILLION)


TABLE 93
PASSENGER CARS SUSPENSION MARKET, BY REGION, 2022–2025 (THOUSAND UNITS)


TABLE 94
PASSENGER CARS SUSPENSION MARKET, BY REGION, 2026–2033 (THOUSAND UNITS)


TABLE 95
PASSENGER CARS SUSPENSION MARKET, BY REGION, 2022–2025 (USD MILLION)


TABLE 96
PASSENGER CARS SUSPENSION MARKET, BY REGION, 2026–2033 (USD MILLION)


TABLE 97
LCVS SUSPENSION MARKET, BY REGION, 2022–2025 (THOUSAND UNITS)


TABLE 98
LCVS SUSPENSION MARKET, BY REGION, 2026–2033 (THOUSAND UNITS)


TABLE 99
LCVS SUSPENSION MARKET, BY REGION, 2022–2025 (USD MILLION)


TABLE 100
LCVS SUSPENSION MARKET, BY REGION, 2026–2033 (USD MILLION)


TABLE 101
TRUCKS SUSPENSION MARKET, BY REGION, 2022–2025 (THOUSAND UNITS)


TABLE 102
TRUCKS SUSPENSION MARKET, BY REGION, 2026–2033 (THOUSAND UNITS)


TABLE 103
TRUCKS SUSPENSION MARKET, BY REGION, 2022–2025 (USD MILLION)


TABLE 104
TRUCKS SUSPENSION MARKET, BY REGION, 2026–2033 (USD MILLION)


TABLE 105
BUSES SUSPENSION MARKET, BY REGION, 2022–2025 (THOUSAND UNITS)


TABLE 106
BUSES SUSPENSION MARKET, BY REGION, 2026–2033 (THOUSAND UNITS)


TABLE 107
BUSES SUSPENSION MARKET, BY REGION, 2022–2025 (USD MILLION)


TABLE 108
BUSES SUSPENSION MARKET, BY REGION, 2026–2033 (USD MILLION)


TABLE 109
ACTIVE SUSPENSION MARKET, BY ACTUATION, 2022–2025 (THOUSAND UNITS)


TABLE 110
ACTIVE SUSPENSION MARKET, BY ACTUATION, 2026–2033 (THOUSAND UNITS)


TABLE 111
ACTIVE SUSPENSION MARKET, BY ACTUATION, 2022–2025 (USD MILLION)


TABLE 112
ACTIVE SUSPENSION MARKET, BY ACTUATION, 2026–2033 (USD MILLION)


TABLE 113
HYDRAULICALLY ACTUATED: ACTIVE SUSPENSION MARKET, BY REGION, 2022–2025 (THOUSAND UNITS)


TABLE 114
HYDRAULICALLY ACTUATED: ACTIVE SUSPENSION MARKET, BY REGION, 2026–2033 (THOUSAND UNITS)


TABLE 115
HYDRAULICALLY ACTUATED: ACTIVE SUSPENSION MARKET, BY REGION, 2022–2025 (USD MILLION)


TABLE 116
HYDRAULICALLY ACTUATED: ACTIVE SUSPENSION MARKET, BY REGION, 2026–2033 (USD MILLION)


TABLE 117
ELECTRONICALLY ACTUATED: ACTIVE SUSPENSION MARKET, BY REGION, 2022–2025 (THOUSAND UNITS)


TABLE 118
ELECTRONICALLY ACTUATED: ACTIVE SUSPENSION MARKET, BY REGION, 2026–2033 (THOUSAND UNITS)


TABLE 119
ELECTRONICALLY ACTUATED: ACTIVE SUSPENSION MARKET, BY REGION, 2022–2025 (USD MILLION)


TABLE 120
ELECTRONICALLY ACTUATED: ACTIVE SUSPENSION MARKET, BY REGION, 2026–2033 (USD MILLION)


TABLE 121
AUTOMOTIVE SUSPENSION MARKET, BY SYSTEM, 2022–2025 (THOUSAND UNITS)


TABLE 122
AUTOMOTIVE SUSPENSION MARKET, BY SYSTEM, 2026–2033 (THOUSAND UNITS)


TABLE 123
AUTOMOTIVE SUSPENSION MARKET, BY SYSTEM, 2022–2025 (USD MILLION)


TABLE 124
AUTOMOTIVE SUSPENSION MARKET, BY SYSTEM, 2026–2033 (USD MILLION)


TABLE 125
PASSIVE: AUTOMOTIVE SUSPENSION MARKET, BY REGION, 2022–2025 (THOUSAND UNITS)


TABLE 126
PASSIVE: AUTOMOTIVE SUSPENSION MARKET, BY REGION, 2026–2033 (THOUSAND UNITS)


TABLE 127
PASSIVE: AUTOMOTIVE SUSPENSION MARKET, BY REGION, 2022–2025 (USD MILLION)


TABLE 128
PASSIVE: AUTOMOTIVE SUSPENSION MARKET, BY REGION, 2026–2033 (USD MILLION)


TABLE 129
SEMI-ACTIVE: AUTOMOTIVE SUSPENSION MARKET, BY REGION, 2022–2025 (THOUSAND UNITS)


TABLE 130
SEMI-ACTIVE: AUTOMOTIVE SUSPENSION MARKET, BY REGION, 2026–2033 (THOUSAND UNITS)


TABLE 131
SEMI-ACTIVE: AUTOMOTIVE SUSPENSION MARKET, BY REGION, 2022–2025 (USD MILLION)


TABLE 132
SEMI-ACTIVE: AUTOMOTIVE SUSPENSION MARKET, BY REGION, 2026–2033 (USD MILLION)


TABLE 133
ACTIVE: AUTOMOTIVE SUSPENSION MARKET, BY REGION, 2022–2025 (THOUSAND UNITS)


TABLE 134
ACTIVE: AUTOMOTIVE SUSPENSION MARKET, BY REGION, 2026–2033 (THOUSAND UNITS)


TABLE 135
ACTIVE: AUTOMOTIVE SUSPENSION MARKET, BY REGION, 2022–2025 (USD MILLION)


TABLE 136
ACTIVE: AUTOMOTIVE SUSPENSION MARKET, BY REGION, 2026–2033 (USD MILLION)


TABLE 137
AUTOMOTIVE SUSPENSION OE MARKET, BY COMPONENT, 2022–2025 (THOUSAND UNITS)


TABLE 138
AUTOMOTIVE SUSPENSION OE MARKET, BY COMPONENT, 2026–2033 (THOUSAND UNITS)


TABLE 139
AUTOMOTIVE SUSPENSION OE MARKET, BY COMPONENT, 2022–2025 (USD MILLION)


TABLE 140
AUTOMOTIVE SUSPENSION OE MARKET, BY COMPONENT, 2026–2033 (USD MILLION)


TABLE 141
COIL SPRING OE MARKET, BY REGION, 2022–2025 (THOUSAND UNITS)


TABLE 142
COIL SPRING OE MARKET, BY REGION, 2026–2033 (THOUSAND UNITS)


TABLE 143
COIL SPRING OE MARKET, BY REGION, 2022–2025 (USD MILLION)


TABLE 144
COIL SPRING OE MARKET, BY REGION, 2026–2033 (USD MILLION)


TABLE 145
SHOCK ABSORBER OE MARKET, BY REGION, 2022–2025 (THOUSAND UNITS)


TABLE 146
SHOCK ABSORBER OE MARKET, BY REGION, 2026–2033 (THOUSAND UNITS)


TABLE 147
SHOCK ABSORBER OE MARKET, BY REGION, 2022–2025 (USD MILLION)


TABLE 148
SHOCK ABSORBER OE MARKET, BY REGION, 2026–2033 (USD MILLION)


TABLE 149
STRUT OE MARKET, BY REGION, 2022–2025 (THOUSAND UNITS)


TABLE 150
STRUT OE MARKET, BY REGION, 2026–2033 (MILLION UNITS)


TABLE 151
STRUT OE MARKET, BY REGION, 2022–2025 (USD MILLION)


TABLE 152
STRUT OE MARKET, BY REGION, 2026–2033 (USD MILLION)


TABLE 153
CONTROL ARM OE MARKET, BY REGION, 2022–2025 (THOUSAND UNITS)


TABLE 154
CONTROL ARM OE MARKET, BY REGION, 2026–2033 (THOUSAND UNITS)


TABLE 155
CONTROL ARM OE MARKET, BY REGION, 2022–2025 (USD MILLION)


TABLE 156
CONTROL ARM OE MARKET, BY REGION, 2026–2033 (USD MILLION)


TABLE 157
RUBBER BUSHING OE MARKET, BY REGION, 2022–2025 (MILLION UNITS)


TABLE 158
RUBBER BUSHING OE MARKET, BY REGION, 2026–2033 (MILLION UNITS)


TABLE 159
RUBBER BUSHING OE MARKET, BY REGION, 2022–2025 (USD MILLION)


TABLE 160
RUBBER BUSHING OE MARKET, BY REGION, 2026–2033 (USD MILLION)


TABLE 161
LEAF SPRING OE MARKET, BY REGION, 2022–2025 (THOUSAND UNITS)


TABLE 162
LEAF SPRING OE MARKET, BY REGION, 2026–2033 (THOUSAND UNITS)


TABLE 163
LEAF SPRING OE MARKET, BY REGION, 2022–2025 (USD MILLION)


TABLE 164
LEAF SPRING OE MARKET, BY REGION, 2026–2033 (USD MILLION)


TABLE 165
LINK STABILIZER/SWAY BAR OE MARKET, BY REGION, 2022–2025 (THOUSAND UNITS)


TABLE 166
LINK STABILIZER/SWAY BAR OE MARKET, BY REGION, 2026–2033 (THOUSAND UNITS)


TABLE 167
LINK STABILIZER/SWAY BAR OE MARKET, BY REGION, 2022–2025 (USD MILLION)


TABLE 168
LINK STABILIZER/SWAY BAR OE MARKET, BY REGION, 2026–2033 (USD MILLION)


TABLE 169
BALL JOINT OE MARKET, BY REGION, 2022–2025 (THOUSAND UNITS)


TABLE 170
BALL JOINT OE MARKET, BY REGION, 2026–2033 (THOUSAND UNITS)


TABLE 171
BALL JOINT OE MARKET, BY REGION, 2022–2025 (USD MILLION)


TABLE 172
BALL JOINT OE MARKET, BY REGION, 2026–2033 (USD MILLION)


TABLE 173
ELECTRIC & HYBRID PASSENGER CAR SUSPENSION MARKET, BY ARCHITECTURE, 2022–2025 (THOUSAND UNITS)


TABLE 174
ELECTRIC & HYBRID PASSENGER CAR SUSPENSION MARKET, BY ARCHITECTURE, 2026–2033 (THOUSAND UNITS)


TABLE 175
ELECTRIC & HYBRID PASSENGER CAR SUSPENSION MARKET, BY ARCHITECTURE, 2022–2025 (USD MILLION)


TABLE 176
ELECTRIC & HYBRID PASSENGER CAR SUSPENSION MARKET, BY ARCHITECTURE, 2026–2033 (USD MILLION)


TABLE 177
ELECTRIC PASSENGER CAR SUSPENSION MARKET, BY ARCHITECTURE, 2022–2025 (THOUSAND UNITS)


TABLE 178
ELECTRIC PASSENGER CAR SUSPENSION MARKET, BY ARCHITECTURE, 2026–2033 (THOUSAND UNITS)


TABLE 179
ELECTRIC PASSENGER CAR SUSPENSION MARKET, BY ARCHITECTURE, 2022–2025 (USD MILLION)


TABLE 180
ELECTRIC PASSENGER CAR SUSPENSION MARKET, BY ARCHITECTURE, 2026–2033 (USD MILLION)


TABLE 181
PLUG-IN HYBRID PASSENGER CAR SUSPENSION MARKET, BY ARCHITECTURE, 2022–2025 (THOUSAND UNITS)


TABLE 182
PLUG-IN HYBRID PASSENGER CAR SUSPENSION MARKET, BY ARCHITECTURE, 2026–2033 (THOUSAND UNITS)


TABLE 183
PLUG-IN HYBRID PASSENGER CAR SUSPENSION MARKET, BY ARCHITECTURE, 2022–2025 (USD MILLION)


TABLE 184
PLUG-IN HYBRID PASSENGER CAR SUSPENSION MARKET, BY ARCHITECTURE, 2026–2033 (USD MILLION)


TABLE 185
FUEL CELL ELECTRIC VEHICLES PASSENGER CARS SUSPENSION MARKET, BY ARCHITECTURE, 2022–2025 (THOUSAND UNITS)


TABLE 186
FUEL CELL ELECTRIC VEHICLES PASSENGER CARS SUSPENSION MARKET, BY ARCHITECTURE, 2026–2033 (THOUSAND UNITS)


TABLE 187
FUEL CELL ELECTRIC VEHICLES PASSENGER CARS SUSPENSION MARKET, BY ARCHITECTURE, 2022–2025 (USD MILLION)


TABLE 188
FUEL CELL ELECTRIC VEHICLES PASSENGER CARS SUSPENSION MARKET, BY ARCHITECTURE, 2026–2033 (USD MILLION)


TABLE 189
ELECTRIC & HYBRID HCV SUSPENSION MARKET, BY VEHICLE TYPE, 2022–2025 (THOUSAND UNITS)


TABLE 190
ELECTRIC & HYBRID HCV SUSPENSION MARKET, BY VEHICLE TYPE, 2026–2033 (THOUSAND UNITS)


TABLE 191
ELECTRIC & HYBRID HCV SUSPENSION MARKET, BY VEHICLE TYPE, 2022–2025 (USD MILLION)


TABLE 192
ELECTRIC & HYBRID HCV SUSPENSION MARKET, BY VEHICLE TYPE, 2026–2033 (USD MILLION)


TABLE 193
ELECTRIC TRUCKS SUSPENSION MARKET, BY ARCHITECTURE, 2022–2025 (THOUSAND UNITS)


TABLE 194
ELECTRIC TRUCKS SUSPENSION MARKET, BY ARCHITECTURE, 2026–2033 (THOUSAND UNITS)


TABLE 195
ELECTRIC TRUCKS SUSPENSION MARKET, BY ARCHITECTURE, 2022–2025 (USD MILLION)


TABLE 196
ELECTRIC TRUCKS SUSPENSION MARKET, BY ARCHITECTURE, 2026–2033 (USD MILLION)


TABLE 197
ELECTRIC BUSES SUSPENSION MARKET, BY ARCHITECTURE, 2022–2025 (THOUSAND UNITS)


TABLE 198
ELECTRIC BUSES SUSPENSION MARKET, BY ARCHITECTURE, 2026–2033 (THOUSAND UNITS)


TABLE 199
ELECTRIC BUSES SUSPENSION MARKET, BY ARCHITECTURE, 2022–2025 (USD MILLION)


TABLE 200
ELECTRIC BUSES SUSPENSION MARKET, BY ARCHITECTURE, 2026–2033 (USD MILLION)


TABLE 201
OFF-HIGHWAY VEHICLE SUSPENSION MARKET, BY APPLICATION, 2022–2025 (THOUSAND UNITS)


TABLE 202
OFF-HIGHWAY VEHICLE SUSPENSION MARKET, BY APPLICATION, 2026–2033 (THOUSAND UNITS)


TABLE 203
CONSTRUCTION EQUIPMENT SUSPENSION MARKET, BY REGION, 2022–2025 (THOUSAND UNITS)


TABLE 204
CONSTRUCTION EQUIPMENT SUSPENSION MARKET, BY REGION, 2026–2033 (THOUSAND UNITS)


TABLE 205
AGRICULTURAL TRACTORS SUSPENSION MARKET, BY REGION, 2022–2025 (THOUSAND UNITS)


TABLE 206
AGRICULTURAL TRACTORS SUSPENSION MARKET, BY REGION, 2026–2033 (THOUSAND UNITS)


TABLE 207
AUTOMOTIVE SUSPENSION MARKET, BY REGION, 2022–2025 (THOUSAND UNITS)


TABLE 208
AUTOMOTIVE SUSPENSION MARKET, BY REGION, 2026–2033 (THOUSAND UNITS)


TABLE 209
AUTOMOTIVE SUSPENSION MARKET, BY REGION, 2022–2025 (USD MILLION)


TABLE 210
AUTOMOTIVE SUSPENSION MARKET, BY REGION, 2026–2033 (USD MILLION)


TABLE 211
ASIA PACIFIC: AUTOMOTIVE SUSPENSION MARKET, BY COUNTRY, 2022–2025 (THOUSAND UNITS)


TABLE 212
ASIA PACIFIC: AUTOMOTIVE SUSPENSION MARKET, BY COUNTRY, 2026–2033 (THOUSAND UNITS)


TABLE 213
ASIA PACIFIC: AUTOMOTIVE SUSPENSION MARKET, BY COUNTRY, 2022–2025 (USD MILLION)


TABLE 214
ASIA PACIFIC: AUTOMOTIVE SUSPENSION MARKET, BY COUNTRY, 2026–2033 (USD MILLION)


TABLE 215
CHINA: AUTOMOTIVE SUSPENSION MARKET, BY ARCHITECTURE, 2022–2025 (THOUSAND UNITS)


TABLE 216
CHINA: AUTOMOTIVE SUSPENSION MARKET, BY ARCHITECTURE, 2026–2033 (THOUSAND UNITS)


TABLE 217
CHINA: AUTOMOTIVE SUSPENSION MARKET, BY ARCHITECTURE, 2022–2025 (USD MILLION)


TABLE 218
CHINA: AUTOMOTIVE SUSPENSION MARKET, BY ARCHITECTURE, 2026–2033 (USD MILLION)


TABLE 219
INDIA: AUTOMOTIVE SUSPENSION MARKET, BY ARCHITECTURE, 2022–2025 (THOUSAND UNITS)


TABLE 220
INDIA: AUTOMOTIVE SUSPENSION MARKET, BY ARCHITECTURE, 2026–2033 (THOUSAND UNITS)


TABLE 221
INDIA: AUTOMOTIVE SUSPENSION MARKET, BY ARCHITECTURE, 2022–2025 (USD MILLION)


TABLE 222
INDIA: AUTOMOTIVE SUSPENSION MARKET, BY ARCHITECTURE, 2026–2033 (USD MILLION)


TABLE 223
JAPAN: AUTOMOTIVE SUSPENSION MARKET, BY ARCHITECTURE, 2022–2025 (THOUSAND UNITS)


TABLE 224
JAPAN: AUTOMOTIVE SUSPENSION MARKET, BY ARCHITECTURE, 2026–2033 (THOUSAND UNITS)


TABLE 225
JAPAN: AUTOMOTIVE SUSPENSION MARKET, BY ARCHITECTURE, 2022–2025 (USD MILLION)


TABLE 226
JAPAN: AUTOMOTIVE SUSPENSION MARKET, BY ARCHITECTURE, 2026–2033 (USD MILLION)


TABLE 227
SOUTH KOREA: AUTOMOTIVE SUSPENSION MARKET, BY ARCHITECTURE, 2022–2025 (THOUSAND UNITS)


TABLE 228
SOUTH KOREA: AUTOMOTIVE SUSPENSION MARKET, BY ARCHITECTURE, 2026–2033 (THOUSAND UNITS)


TABLE 229
SOUTH KOREA: AUTOMOTIVE SUSPENSION MARKET, BY ARCHITECTURE, 2022–2025 (USD MILLION)


TABLE 230
SOUTH KOREA: AUTOMOTIVE SUSPENSION MARKET, BY ARCHITECTURE, 2026–2033 (USD MILLION)


TABLE 231
REST OF ASIA PACIFIC: AUTOMOTIVE SUSPENSION MARKET, BY ARCHITECTURE, 2022–2025 (THOUSAND UNITS)


TABLE 232
REST OF ASIA PACIFIC: AUTOMOTIVE SUSPENSION MARKET, BY ARCHITECTURE, 2026–2033 (THOUSAND UNITS)


TABLE 233
REST OF ASIA PACIFIC: AUTOMOTIVE SUSPENSION MARKET, BY ARCHITECTURE, 2022–2025 (USD MILLION)


TABLE 234
REST OF ASIA PACIFIC: AUTOMOTIVE SUSPENSION MARKET, BY ARCHITECTURE, 2026–2033 (USD MILLION)


TABLE 235
NORTH AMERICA: AUTOMOTIVE SUSPENSION MARKET, BY COUNTRY, 2022–2025 (THOUSAND UNITS)


TABLE 236
NORTH AMERICA: AUTOMOTIVE SUSPENSION MARKET, BY COUNTRY, 2026–2033 (THOUSAND UNITS)


TABLE 237
NORTH AMERICA: AUTOMOTIVE SUSPENSION MARKET, BY COUNTRY, 2022–2025 (USD MILLION)


TABLE 238
NORTH AMERICA: AUTOMOTIVE SUSPENSION MARKET, BY COUNTRY, 2026–2033 (USD MILLION)


TABLE 239
US: AUTOMOTIVE SUSPENSION MARKET, BY ARCHITECTURE, 2022–2025 (THOUSAND UNITS)


TABLE 240
US: AUTOMOTIVE SUSPENSION MARKET, BY ARCHITECTURE, 2026–2033 (THOUSAND UNITS)


TABLE 241
US: AUTOMOTIVE SUSPENSION MARKET, BY ARCHITECTURE, 2022–2025 (USD MILLION)


TABLE 242
US: AUTOMOTIVE SUSPENSION MARKET, BY ARCHITECTURE, 2026–2033 (USD MILLION)


TABLE 243
MEXICO: AUTOMOTIVE SUSPENSION MARKET, BY ARCHITECTURE, 2022–2025 (THOUSAND UNITS)


TABLE 244
MEXICO: AUTOMOTIVE SUSPENSION MARKET, BY ARCHITECTURE, 2026–2033 (THOUSAND UNITS)


TABLE 245
MEXICO: AUTOMOTIVE SUSPENSION MARKET, BY ARCHITECTURE, 2022–2025 (USD MILLION)


TABLE 246
MEXICO: AUTOMOTIVE SUSPENSION MARKET, BY ARCHITECTURE, 2026–2033 (USD MILLION)


TABLE 247
CANADA: AUTOMOTIVE SUSPENSION MARKET, BY ARCHITECTURE, 2022–2025 (THOUSAND UNITS)


TABLE 248
CANADA: AUTOMOTIVE SUSPENSION MARKET, BY ARCHITECTURE, 2026–2033 (THOUSAND UNITS)


TABLE 249
CANADA: AUTOMOTIVE SUSPENSION MARKET, BY ARCHITECTURE, 2022–2025 (USD MILLION)


TABLE 250
CANADA: AUTOMOTIVE SUSPENSION MARKET, BY ARCHITECTURE, 2026–2033 (USD MILLION)


TABLE 251
EUROPE: AUTOMOTIVE SUSPENSION MARKET, BY COUNTRY, 2022–2025 (THOUSAND UNITS)


TABLE 252
EUROPE: AUTOMOTIVE SUSPENSION MARKET, BY COUNTRY, 2026–2033 (THOUSAND UNITS)


TABLE 253
EUROPE: AUTOMOTIVE SUSPENSION MARKET, BY COUNTRY, 2022–2025 (USD MILLION)


TABLE 254
EUROPE: AUTOMOTIVE SUSPENSION MARKET, BY COUNTRY, 2026–2033 (USD MILLION)


TABLE 255
GERMANY: AUTOMOTIVE SUSPENSION MARKET, BY ARCHITECTURE, 2022–2025 (THOUSAND UNITS)


TABLE 256
GERMANY: AUTOMOTIVE SUSPENSION MARKET, BY ARCHITECTURE, 2026–2033 (THOUSAND UNITS)


TABLE 257
GERMANY: AUTOMOTIVE SUSPENSION MARKET, BY ARCHITECTURE, 2022–2025 (USD MILLION)


TABLE 258
GERMANY: AUTOMOTIVE SUSPENSION MARKET, BY ARCHITECTURE, 2026–2033 (USD MILLION)


TABLE 259
UK: AUTOMOTIVE SUSPENSION MARKET, BY ARCHITECTURE, 2022–2025 (THOUSAND UNITS)


TABLE 260
UK: AUTOMOTIVE SUSPENSION MARKET, BY ARCHITECTURE, 2026–2033 (THOUSAND UNITS)


TABLE 261
UK: AUTOMOTIVE SUSPENSION MARKET, BY ARCHITECTURE, 2022–2025 (USD MILLION)


TABLE 262
UK: AUTOMOTIVE SUSPENSION MARKET, BY ARCHITECTURE, 2026–2033 (USD MILLION)


TABLE 263
FRANCE: AUTOMOTIVE SUSPENSION MARKET, BY ARCHITECTURE, 2022–2025 (THOUSAND UNITS)


TABLE 264
FRANCE: AUTOMOTIVE SUSPENSION MARKET, BY ARCHITECTURE, 2026–2033 (THOUSAND UNITS)


TABLE 265
FRANCE: AUTOMOTIVE SUSPENSION MARKET, BY ARCHITECTURE, 2022–2025 (USD MILLION)


TABLE 266
FRANCE: AUTOMOTIVE SUSPENSION MARKET, BY ARCHITECTURE, 2026–2033 (USD MILLION)


TABLE 267
SPAIN: AUTOMOTIVE SUSPENSION MARKET, BY ARCHITECTURE, 2022–2025 (THOUSAND UNITS)


TABLE 268
SPAIN: AUTOMOTIVE SUSPENSION MARKET, BY ARCHITECTURE, 2026–2033 (THOUSAND UNITS)


TABLE 269
SPAIN: AUTOMOTIVE SUSPENSION MARKET, BY ARCHITECTURE, 2022–2025 (USD MILLION)


TABLE 270
SPAIN: AUTOMOTIVE SUSPENSION MARKET, BY ARCHITECTURE, 2026–2033 (USD MILLION)


TABLE 271
ITALY: AUTOMOTIVE SUSPENSION MARKET, BY ARCHITECTURE, 2022–2025 (THOUSAND UNITS)


TABLE 272
ITALY: AUTOMOTIVE SUSPENSION MARKET, BY ARCHITECTURE, 2026–2033 (THOUSAND UNITS)


TABLE 273
ITALY: AUTOMOTIVE SUSPENSION MARKET, BY ARCHITECTURE, 2022–2025 (USD MILLION)


TABLE 274
ITALY: AUTOMOTIVE SUSPENSION MARKET, BY ARCHITECTURE, 2026–2033 (USD MILLION)


TABLE 275
RUSSIA: AUTOMOTIVE SUSPENSION MARKET, BY ARCHITECTURE, 2022–2025 (THOUSAND UNITS)


TABLE 276
RUSSIA: AUTOMOTIVE SUSPENSION MARKET, BY ARCHITECTURE, 2026–2033 (THOUSAND UNITS)


TABLE 277
RUSSIA: AUTOMOTIVE SUSPENSION MARKET, BY ARCHITECTURE, 2022–2025 (USD MILLION)


TABLE 278
RUSSIA: AUTOMOTIVE SUSPENSION MARKET, BY ARCHITECTURE, 2026–2033 (USD MILLION)


TABLE 279
REST OF EUROPE: AUTOMOTIVE SUSPENSION MARKET, BY ARCHITECTURE, 2022–2025 (THOUSAND UNITS)


TABLE 280
REST OF EUROPE: AUTOMOTIVE SUSPENSION MARKET, BY ARCHITECTURE, 2026–2033 (THOUSAND UNITS)


TABLE 281
REST OF EUROPE: AUTOMOTIVE SUSPENSION MARKET, BY ARCHITECTURE, 2022–2025 (USD MILLION)


TABLE 282
REST OF EUROPE: AUTOMOTIVE SUSPENSION MARKET, BY ARCHITECTURE, 2026–2033 (USD MILLION)


TABLE 283
ROW: AUTOMOTIVE SUSPENSION MARKET, BY COUNTRY, 2022–2025 (THOUSAND UNITS)


TABLE 284
ROW: AUTOMOTIVE SUSPENSION MARKET, BY COUNTRY, 2026–2033 (THOUSAND UNITS)


TABLE 285
ROW: AUTOMOTIVE SUSPENSION MARKET, BY COUNTRY, 2022–2025 (USD MILLION)


TABLE 286
ROW: AUTOMOTIVE SUSPENSION MARKET, BY COUNTRY, 2026–2033 (USD MILLION)


TABLE 287
BRAZIL: AUTOMOTIVE SUSPENSION MARKET, BY ARCHITECTURE, 2022–2025 (THOUSAND UNITS)


TABLE 288
BRAZIL: AUTOMOTIVE SUSPENSION MARKET, BY ARCHITECTURE, 2026–2033 (THOUSAND UNITS)


TABLE 289
BRAZIL: AUTOMOTIVE SUSPENSION MARKET, BY ARCHITECTURE, 2022–2025 (USD MILLION)


TABLE 290
BRAZIL: AUTOMOTIVE SUSPENSION MARKET, BY ARCHITECTURE, 2026–2033 (USD MILLION)


TABLE 291
SOUTH AFRICA: AUTOMOTIVE SUSPENSION MARKET, BY ARCHITECTURE, 2022–2025 (THOUSAND UNITS)


TABLE 292
SOUTH AFRICA: AUTOMOTIVE SUSPENSION MARKET, BY ARCHITECTURE, 2026–2033 (THOUSAND UNITS)


TABLE 293
SOUTH AFRICA: AUTOMOTIVE SUSPENSION MARKET, BY ARCHITECTURE, 2022–2025 (USD MILLION)


TABLE 294
SOUTH AFRICA: AUTOMOTIVE SUSPENSION MARKET, BY ARCHITECTURE, 2026–2033 (USD MILLION)


TABLE 295
OTHERS: AUTOMOTIVE SUSPENSION MARKET, BY ARCHITECTURE, 2022–2025 (THOUSAND UNITS)


TABLE 296
OTHERS: AUTOMOTIVE SUSPENSION MARKET, BY ARCHITECTURE, 2026–2033 (THOUSAND UNITS)


TABLE 297
OTHERS: AUTOMOTIVE SUSPENSION MARKET, BY ARCHITECTURE, 2022–2025 (USD MILLION)


TABLE 298
OTHERS: AUTOMOTIVE SUSPENSION MARKET, BY ARCHITECTURE, 2026–2033 (USD MILLION)


TABLE 299
AUTOMOTIVE SUSPENSION MARKET: OVERVIEW OF STRATEGIES ADOPTED BY KEY PLAYERS, 2023–2026


TABLE 300
AUTOMOTIVE SUSPENSION MARKET: DEGREE OF COMPETITION, 2025


TABLE 301
AUTOMOTIVE SUSPENSION MARKET: REGION FOOTPRINT


TABLE 302
AUTOMOTIVE SUSPENSION MARKET: SYSTEM FOOTPRINT


TABLE 303
AUTOMOTIVE SUSPENSION MARKET: ACTUATION FOOTPRINT


TABLE 304
AUTOMOTIVE SUSPENSION MARKET: VEHICLE TYPE FOOTPRINT


TABLE 305
AUTOMOTIVE SUSPENSION MARKET: DETAILED LIST OF KEY STARTUPS/SMES


TABLE 306
AUTOMOTIVE SUSPENSION MARKET: COMPETITIVE BENCHMARKING OF KEY STARTUPS/SMES (1/2)


TABLE 307
AUTOMOTIVE SUSPENSION MARKET: COMPETITIVE BENCHMARKING OF KEY STARTUPS/SMES (2/2)


TABLE 308
AUTOMOTIVE SUSPENSION MARKET: PRODUCT LAUNCHES/DEVELOPMENTS, JANUARY 2023–SEPTEMBER 2026


TABLE 309
AUTOMOTIVE SUSPENSION MARKET: DEALS, JANUARY 2023–SEPTEMBER 2026


TABLE 310
AUTOMOTIVE SUSPENSION MARKET: EXPANSIONS, JANUARY 2023–SEPTEMBER 2026


TABLE 311
AUTOMOTIVE SUSPENSION MARKET: OTHER DEVELOPMENTS, JANUARY 2023–SEPTEMBER 2026


TABLE 312
ZF FRIEDRICHSHAFEN AG: COMPANY OVERVIEW


TABLE 313
ZF FRIEDRICHSHAFEN AG: PRODUCTS OFFERED


TABLE 314
ZF FRIEDRICHSHAFEN AG: PRODUCT LAUNCHES/DEVELOPMENTS


TABLE 315
ZF FRIEDRICHSHAFEN AG: EXPANSIONS


TABLE 316
HYUNDAI MOBIS: COMPANY OVERVIEW


TABLE 317
HYUNDAI MOBIS: PRODUCTS OFFERED


TABLE 318
HYUNDAI MOBIS: PRODUCT LAUNCHES/DEVELOPMENTS


TABLE 319
HYUNDAI MOBIS: EXPANSIONS


TABLE 320
HYUNDAI MOBIS: OTHER DEVELOPMENTS


TABLE 321
TENNECO INC.: COMPANY OVERVIEW


TABLE 322
TENNECO INC.: PRODUCTS OFFERED


TABLE 323
TENNECO INC.: PRODUCT LAUNCHES/DEVELOPMENTS


TABLE 324
TENNECO INC.: EXPANSIONS


TABLE 325
TENNECO INC: OTHER DEVELOPMENTS


TABLE 326
THYSSENKRUPP AG: COMPANY OVERVIEW


TABLE 327
THYSSENKRUPP AG: PRODUCTS OFFERED


TABLE 328
THYSSENKRUPP AG: DEALS


TABLE 329
THYSSENKRUPP AG.: EXPANSIONS


TABLE 330
MAGNA INTERNATIONAL INC.: COMPANY OVERVIEW


TABLE 331
MAGNA INTERNATIONAL INC.: PRODUCTS OFFERED


TABLE 332
BWI GROUP: COMPANY OVERVIEW


TABLE 333
BWI GROUP: PRODUCTS OFFERED


TABLE 334
BWI GROUP: PRODUCT LAUNCHES/DEVELOPMENTS


TABLE 335
BWI GROUP: DEALS


TABLE 336
BWI GROUP: EXPANSIONS


TABLE 337
BWI GROUP: OTHER DEVELOPMENTS


TABLE 338
KYB CORPORATION: COMPANY OVERVIEW


TABLE 339
KYB CORPORATION: PRODUCTS OFFERED


TABLE 340
KYB CORPORATION: PRODUCT LAUNCHES/DEVELOPMENTS


TABLE 341
KYB CORPORATION: DEALS


TABLE 342
KYB CORPORATION: EXPANSIONS


TABLE 343
KYB CORPORATION: OTHER DEVELOPMENTS


TABLE 344
HL MANDO CORP.: COMPANY OVERVIEW


TABLE 345
HL MANDO CORP.: PRODUCTS OFFERED


TABLE 346
HL MANDO CORP.: PRODUCT LAUNCHES/DEVELOPMENTS


TABLE 347
HL MANDO CORP.: DEALS


TABLE 348
HL MANDO CORPORATION: OTHER DEVELOPMENTS


TABLE 349
MERITOR, INC.: COMPANY OVERVIEW


TABLE 350
MERITOR, INC.: PRODUCTS OFFERED


TABLE 351
HENDRICKSON USA, L.L.C.: COMPANY OVERVIEW


TABLE 352
HENDRICKSON USA, L.L.C.: PRODUCTS OFFERED


TABLE 353
HENDRICKSON USA, L.L.C.: PRODUCT LAUNCHES/DEVELOPMENTS


TABLE 354
HENDRICKSON USA, L.L.C.: DEALS


TABLE 355
AUMOVIO: COMPANY OVERVIEW


TABLE 356
AUMOVIO: PRODUCTS OFFERED


TABLE 357
ASTEMO, LTD: COMPANY OVERVIEW


TABLE 358
SOGEFI S.P.A.: COMPANY OVERVIEW


TABLE 359
EIBACH: COMPANY OVERVIEW


TABLE 360
GESTAMP: COMPANY OVERVIEW


TABLE 361
SIDEM: COMPANY OVERVIEW


TABLE 362
PEDDERS SUSPENSION & BRAKES: COMPANY OVERVIEW


TABLE 363
RTS: COMPANY OVERVIEW


TABLE 364
YSS SUSPENSION: COMPANY OVERVIEW


TABLE 365
BELLTECH: COMPANY OVERVIEW


TABLE 366
SKYJACKER SUSPENSIONS: COMPANY OVERVIEW


TABLE 367
MULTIMATIC INC.: COMPANY OVERVIEW


TABLE 368
KING SHOCKS: COMPANY OVERVIEW


TABLE 369
FOX FACTORY, INC.: COMPANY OVERVIEW


TABLE 370
RANCHO SUSPENSION: COMPANY OVERVIEW


TABLE 371
TEIN USA: COMPANY OVERVIEW


TABLE 372
AIR LIFT COMPANY: COMPANY OVERVIEW


TABLE 373
MOOG INC.: COMPANY OVERVIEW


TABLE 374
RESEARCH ASSUMPTIONS AND RISK ANALYSIS


TABLE 375
RESEARCH ASSUMPTIONS: ARCHITECTURE


LIST OF FIGURES


FIGURE 1
AUTOMOTIVE SUSPENSION MARKET SEGMENTATION AND REGIONAL SCOPE


FIGURE 2
AUTOMOTIVE SUSPENSION MARKET: DURATION COVERED


FIGURE 3
AUTOMOTIVE SUSPENSION MARKET SCENARIO


FIGURE 4
GLOBAL AUTOMOTIVE SUSPENSION MARKET SIZE, 2022–2033


FIGURE 5
MAJOR STRATEGIES ADOPTED BY KEY PLAYERS IN AUTOMOTIVE SUSPENSION MARKET


FIGURE 6
DISRUPTIONS INFLUENCING GROWTH OF AUTOMOTIVE SUSPENSION MARKET


FIGURE 7
HIGH-GROWTH SEGMENTS IN AUTOMOTIVE SUSPENSION MARKET


FIGURE 8
ASIA PACIFIC TO BE LEADING MARKET DURING FORECAST PERIOD


FIGURE 9
RISING EV AND ACTIVE SUSPENSION IS CREATING ATTRACTIVE OPPOTUNITIES


FIGURE 10
PASSIVE SUSPENSION SYSTEM TO CAPTURE MAJOR MARKET SHARE IN 2026, DUE TO THEIR LOWER MANUFACTURING AND SIMPLE MECHANICAL DESIGN.


FIGURE 11
MULTI-LINK SUSPENSION SYSTEM TO RECORD HIGHEST CAGR DUE TO THEIR SUPERIOR RIDE COMFORT AND ENHANCED VEHICLE STABILITY


FIGURE 12
PASSENGER CARS SEGMENT TO CAPTURE MAJOR MARKET SHARE DUE TO THEIR HIGH PRODUCTION VOLUMES AND WIDESPREAD ADOPTION ACROSS EMERGING AND DEVELOPED ECONOMIES


FIGURE 13
RUBBER BUSHING SEGMENT TO CAPTURE LARGEST MARKET SHARE DUE TO ITS WIDESPREAD USE ACROSS SUSPENSION SYSTEMS WITH COST-EFFECTIVENESS


FIGURE 14
SHOCK ABSORBERS SEGMENT TO REGISTER HIGHEST CAGR DUE TO INCREASING DEMAND FOR IMPROVED RIDE COMFORT, VEHICLE STABILITY, AND HANDLING PERFORMANCE.


FIGURE 15
MULTI-LINK AUTOMOTIVE SUSPENION TO WITNESS HIGHEST CAGR DO TO THEIR ABILITY TO MANAGE HIGHER VEHICLE WEIGHT RESULTING FROM BATTERY PACKS, ACCOMMODATE EV-SPECIFIC CHASSIS DESIGNS


FIGURE 16
TRUCKS SEGMENT TO EXHIBIT HIGHER CAGR AS HIGHER BATTERY WEIGHT AND VARYING PAYLOAD CONDITIONS ARE INCREASING THE NEED FOR ROBUST SUSPENSION SYSTEMS WITH IMPROVED LOAD MANAGEMENT


FIGURE 17
ELECTRONICALLY ACTUATED SEGMENT TO GROW AT FASTEST RATE AS ADOPTION OF PREMIUM VEHICLES AND EVS, IS ENABLING SUSPENSION SYSTEMS TO RESPOND DYNAMICALLY ACCORDING TO ROAD CONDITIONS


FIGURE 18
CONSTRUCTION & MINING SEGMENT TO RECORD HIGHER CAGR AS ADOPTION OF ADVANCED SUSPENSION SYSTEMS TO IMPROVE LOAD-BEARING CAPACITY AND MACHINE STABILITY FOR INCREASING ELECTRIFICATION IN OFF-HIGHWAY MACHINERY


FIGURE 19
ASIA PACIFIC TO CAPTURE MAJOR MARKET SHARE IN 2026


FIGURE 20
DRIVERS, RESTRAINTS, OPPORTUNITIES, AND CHALLENGES


FIGURE 21
HYUNDAI’S NEXT GENERATION PLATFORM OUTLOOK


FIGURE 22
VOLKSWAGEN DOMAIN TO ZONAL E/E ARCHITECTURE OUTLOOK


FIGURE 23
EVOLUTION TOWARDS SOFTWARE CONTROLLED SUSPENSION SYSTEM


FIGURE 24
AUTOMOTIVE SUSPENSION ECOSYSTEM


FIGURE 25
AUTOMOTIVE SUSPENSION SUPPLY CHAIN ANALYSIS


FIGURE 26
TRENDS/DISRUPTIONS INFLUENCING CUSTOMER BUSINESS


FIGURE 27
IMPORT DATA FOR HS CODE 870880-COMPLIANT PRODUCTS FOR TOP FIVE COUNTRIES, 2021–2025 (USD THOUSAND)


FIGURE 28
EXPORT DATA FOR HS CODE 870880-COMPLIANT PRODUCTS, BY COUNTRY, 2021–2025 (USD THOUSAND)


FIGURE 29
INVESTMENT AND FUNDING SCENARIO, 2022–2026


FIGURE 30
PATENTS APPLIED AND GRANTED, 2015–2026


FIGURE 31
FUTURE APPLICATIONS OF AUTOMOTIVE SUSPENSION


FIGURE 32
INFLUENCE OF STAKEHOLDERS ON BUYING PROCESS, BY VEHICLE TYPE


FIGURE 33
KEY BUYING CRITERIA FOR SUSPENSION TYPES IN PASSENGER CARS


FIGURE 34
AUTOMOTIVE SUSPENSION AFTERMARKET, BY COMPONENT, 2026 VS. 2033 (USD MILLION)


FIGURE 35
AUTOMOTIVE SUSPENSION MARKET, BY ARCHITECTURE, 2026 VS. 2033 (USD MILLION)


FIGURE 36
AUTOMOTIVE SUSPENSION MARKET, BY VEHICLE TYPE, 2026 VS. 2033 (USD MILLION)


FIGURE 37
ACTIVE SUSPENSION MARKET, BY ACTUATION, 2026 VS. 2033 (USD MILLION)


FIGURE 38
AUTOMOTIVE SUSPENSION MARKET, BY SYSTEM, 2026 VS. 2033 (USD MILLION)


FIGURE 39
AUTOMOTIVE SUSPENSION OE MARKET, BY COMPONENT, 2026 VS. 2033 (USD MILLION)


FIGURE 40
ELECTRIC & HYBRID PASSENGER CAR SUSPENSION MARKET, BY ARCHITECTURE, 2026 VS. 2033 (USD MILLION)


FIGURE 41
ELECTRIC & HYBRID HCV SUSPENSION MARKET, BY VEHICLE TYPE, 2026 VS. 2033 (USD MILLION)


FIGURE 42
OFF-HIGHWAY VEHICLE SUSPENSION MARKET, BY APPLICATION, 2026 VS. 2033 (USD MILLION)


FIGURE 43
AUTOMOTIVE SUSPENSION MARKET, BY REGION, 2026 VS. 2033 (USD MILLION)


FIGURE 44
ASIA PACIFIC: AUTOMOTIVE SUSPENSION MARKET SNAPSHOT, 2026


FIGURE 45
NORTH AMERICA: AUTOMOTIVE SUSPENSION MARKET SNAPSHOT


FIGURE 46
EUROPE: AUTOMOTIVE SUSPENSION MARKET SNAPSHOT


FIGURE 47
ROW: AUTOMOTIVE SUSPENSION MARKET, BY COUNTRY, 2026 VS. 2033


FIGURE 48
AUTOMOTIVE SUSPENSION MARKET: REVENUE ANALYSIS OF TOP FIVE PLAYERS, 2021–2025


FIGURE 49
MARKET SHARE ANALYSIS OF COMPANIES OFFERING AUTOMOTIVE SUSPENSION SYSTEMS, 2025


FIGURE 50
COMPANY VALUATION


FIGURE 51
FINANCIAL METRICS (EV/EBITDA)


FIGURE 52
BRAND/PRODUCT COMPARATIVE ANALYSIS


FIGURE 53
AUTOMOTIVE SUSPENSION MARKET: COMPANY EVALUATION MATRIX (KEY PLAYERS), 2025


FIGURE 54
AUTOMOTIVE SUSPENSION MARKET: COMPANY FOOTPRINT


FIGURE 55
AUTOMOTIVE SUSPENSION MARKET: COMPANY EVALUATION MATRIX (STARTUPS/SMES), 2025


FIGURE 56
ZF FRIEDRICHSHAFEN AG: COMPANY SNAPSHOT


FIGURE 57
HYUNDAI MOBIS: COMPANY SNAPSHOT


FIGURE 58
THYSSENKRUPP AG: COMPANY SNAPSHOT


FIGURE 59
MAGNA INTERNATIONAL INC.: COMPANY SNAPSHOT


FIGURE 60
BWI GROUP: COMPANY SNAPSHOT


FIGURE 61
KYB CORPORATION: COMPANY SNAPSHOT


FIGURE 62
HL MANDO CORP.: COMPANY SNAPSHOT


FIGURE 63
MERITOR, INC.: COMPANY SNAPSHOT


FIGURE 64
AUMOVIO: COMPANY SNAPSHOT


FIGURE 65
AUTOMOTIVE SUSPENSION MARKET: RESEARCH DESIGN


FIGURE 66
RESEARCH PROCESS FLOW


FIGURE 67
MARKET ESTIMATION METHODOLOGY


FIGURE 68
AUTOMOTIVE SUSPENSION MARKET: BOTTOM-UP APPROACH (ARCHITECTURE AND REGION)


FIGURE 69
AUTOMOTIVE SUSPENSION MARKET: TOP-DOWN APPROACH


FIGURE 70
AUTOMOTIVE SUSPENSION MARKET: DATA TRIANGULATION


FIGURE 71
MARKET GROWTH PROJECTIONS FROM DEMAND-SIDE DRIVERS


Methodology

The research study relied heavily on secondary sources, including company annual reports/presentations, industry association publications, magazines, directories, technical handbooks, the World Economic Outlook, trade websites, technical articles, and databases, to identify and collect information on the automotive suspension market. In-depth interviews were conducted with primary-source experts from related industry players, automotive suspension suppliers, and automotive OEMs to obtain and verify critical information and assess growth prospects and market estimates.

Secondary Research

In the secondary research process, various secondary sources were used to identify and collect information on the automotive suspension market for this study. The sources included automotive industry organizations such as Organisation Internationale des Constructeurs d'Automobiles (OICA), CAAM, JAMA, ACEA, etc., OE and aftermarket suspension manufacturers and suppliers, automotive component and aftermarket associations such as CLEPA, MEMA Aftermarket Suppliers, Auto Care Association, and AASA, suspension-specific technical and product publications, regulatory bodies, corporate filings such as annual reports, investor presentations, and financial statements, and trade, business, and automotive associations. Secondary data has been collected and analyzed to arrive at the overall market size, which has been further validated through primary research.

Primary Research

Extensive primary research was conducted after gaining an understanding of the automotive suspension market scenario through secondary research. Several primary interviews have been conducted with market experts from both the demand side (automotive OEMs) and the supply side (automotive suspension manufacturers and distributors), and players across 4 major regions, namely, North America, Europe, Asia Pacific, and the Rest of the World. Approximately 30% of primary interviews from the demand side and 70% from the supply side have been conducted. Primary data has been collected through questionnaires, emails, and telephonic interviews.

In our canvassing of primary interviews, we have strived to cover various departments within organizations, such as sales, operations, and administration, to provide a holistic viewpoint in our reports. After interacting with industry participants, we have also conducted brief sessions with highly experienced independent consultants to reinforce the findings from our primary interviews. This, along with the in-house subject-matter experts’ opinions, has led us to the findings as described in the remainder of this report.

Automotive Suspension Market
 Size, and Share

To know about the assumptions considered for the study, download the pdf brochure

Market Size Estimation

A detailed market estimation approach was followed to estimate and validate the size of the automotive suspension market and other dependent submarkets, as mentioned below:

Bottom-up Approach

  • Key players in the automotive suspension market were identified through secondary research, and their global market share was determined through primary and secondary research.
  • The study identified the percentage penetration of major suspension types—MacPherson Strut, Double Wishbone, Multi-Link, Twist/Torsion Beam, Leaf Spring, Air Suspension, and other advanced systems—across passenger cars, LCVs, HCVs, buses, and EVs. Model-level mapping of OEM vehicles was used to determine the suspension configuration by country, vehicle type, model/variant, and powertrain.
  • The suspension penetration rates for each vehicle type and country were multiplied by the corresponding vehicle production volume to calculate suspension demand in million units. These calculations were performed at the country level and aggregated to regional and global market volumes.
  • All major penetration rates, vehicle-type splits, suspension-type shares, model mappings, and volume estimates were derived through secondary research and subsequently validated and refined through primary interviews with OEMs, Tier-1 suppliers, suspension manufacturers, and industry experts.
  • Country-level average selling prices (ASPs) were established for each suspension type based on vehicle category, technology content, system configuration, and regional pricing. ASPs for MacPherson Strut, Double Wishbone, Multi-Link, Twist/Torsion Beam, Leaf Spring, Air Suspension, and advanced suspension systems were benchmarked through secondary research and validated through primary interviews.
  • The value market was derived by multiplying the validated number of suspension units (thousand units) by the corresponding country-level ASP for each suspension type and vehicle category, followed by aggregation across countries and regions to determine the global market value.
  • The summation of all country-level data for volume and value gave the global market for automotive suspension.
  • Top-down Approach
    • The top-down approach was used to estimate and validate the regional size of the automotive suspension market, by suspension type (MacPherson Strut, Double Wishbone, Multi-Link, Twist Beam/Torsion Beam, Leaf Spring Suspension, and Air Suspension), in terms of volume and value.
    • The global automotive suspension market was broken down into regional markets across North America, Europe, Asia Pacific, Latin America, and Middle East & Africa, based on regional vehicle production, suspension technology adoption, and market penetration.
    • The market share/penetration of each suspension type was estimated at the regional level using historical installation patterns, vehicle mix, OEM fitment data, technology adoption trends, and secondary research. It was validated through primary interviews with industry experts.
    • The penetration of each suspension type was multiplied by the regional vehicle production volume to estimate the automotive suspension market volume by suspension type and region.
    • The average selling price (ASP) of each suspension type was derived from secondary sources, supplier/OEM pricing references, industry databases, and primary interviews, with variations considered by vehicle type and region.
    • The volume of each suspension type was multiplied by its respective regional ASP to estimate the market value in USD million.
    • Forecasts of the regional automotive suspension market were based on macro- and microeconomic factors, including vehicle production growth, GDP and automotive demand trends, EV/hybrid penetration, OEM production capacity, vehicle segment mix, new model launches, adoption of advanced suspension technologies, and regional regulatory and technology developments.
    • The suspension-type mix forecast considered vehicle architecture changes, increasing SUV/pickup penetration, EV weight and packaging requirements, premium vehicle adoption, commercial vehicle payload requirements, and OEM adoption of air and other advanced suspension systems, supported by industry expert validation.
    • The summation of region-wise markets was carried out to derive the total global automotive suspension market, by suspension type, in terms of value (USD million) and volume (thousand units).

    Automotive Suspension Market Top Down and Bottom Up Approach

    Data Triangulation

    After arriving at the overall market size of the global market through the above-mentioned methodology, this market was split into several segments and subsegments. The data triangulation and market breakdown procedures were employed, wherever applicable, to complete the overall market engineering process and arrive at the exact data for the market by value for the key segments and subsegments. The extrapolated market data was triangulated by studying various macro indicators and regional trends from both the demand and supply participants.

    Market Definition

    A suspension is the arrangement of shock absorbers, springs, tires, and linkages that connect a vehicle to its wheels and allow movement between the wheel and suspension components. The suspension system minimizes shocks transmitted to the vehicle body while moving over a surface. It makes the ride comfortable and keeps the tires in constant contact with the surface, regardless of contours. A suspension needs to keep the wheel in contact with the road surface to maintain the driver’s control of the vehicle.

    Key Stakeholders

    • Automotive suspension manufacturers
    • Automotive raw material suppliers
    • Automotive OEMs
    • Research & Development (R&D) Centers
    • Associations, forums, and alliances related to automobiles
    • Automobile organizations/associations
    • EV component manufacturers
    • EV manufacturers
    • Government agencies and policymakers
    • Traders and distributors of automotive suspension

    Report Objectives

    • To segment and forecast the size of the automotive suspension market in terms of volume (Million Units) & value (USD million) from 2022 to 2033
    • To define, describe, and forecast the automotive suspension market in terms of volume & value (USD million)
    • To define, describe, and forecast the global automotive suspension market based on system, vehicle type, architecture, OE component, EV type, off-highway vehicles, ATV, and region.
    • To segment and forecast the market size of the automotive suspension market by architecture (MacPherson Strut, Double Wishbone, Multilink, Twist Beam/Torsion Beam, and Air Suspension).
    • To segment and forecast the market size of the automotive suspension market by vehicle type (ICE) (Passenger Car, Light Commercial Vehicle, and Heavy Commercial Vehicle)
    • To segment and forecast the market size of the Electric & Hybrid Passenger Cars Suspension Market by Architecture (MacPherson Strut, Double Wishbone, Multilink, Twist Beam/Torsion Beam, and Air Suspension)
    • To segment and forecast the market size of the Electric & Hybrid HCVs Suspension Market, by Vehicle Type (Trucks and Buses)
    • To segment and forecast the market size of the Off-highway Vehicles Suspension Market, by Application (Construction Equipment and Agricultural Tractors)
    • To segment and forecast the market size of the ATV Suspension Market by Region (Asia Pacific, Europe, and North America)
    • To forecast market size by key regions, namely Asia Pacific, Europe, North America, and the Rest of the World.
    • To provide detailed information regarding the major factors influencing market growth (drivers, challenges, restraints, and opportunities)
    • To strategically analyze markets with respect to individual growth trends, prospects, and contributions to the total market
    • To strategically profile key players and comprehensively analyze their market share and core competencies
    • To study the following with respect to the market:
    • Supply Chain Analysis
    • Ecosystem Analysis
    • Technology Analysis
    • HS Code Analysis
    • Case Study Analysis
    • Patent Analysis
    • Regulatory Landscape
    • Conferences and Events
    • Key Stakeholders and Buying Criteria
    • Investment and Funding Scenario
    • Unmet Needs and White Spaces
    • Strategic Moves by Tier 1/2/3 Players
    • Interconnected Markets and Cross-sector Opportunities
    • Market Profitability
    • To analyze opportunities for stakeholders and the competitive landscape for market leaders
    • To track and analyze competitive developments such as product developments, deals, and others undertaken by the key industry participants

    Available customizations:

    With the given market data, MarketsandMarkets offers customizations to meet the company’s specific needs.

    • Front Suspension, by architecture and vehicle type — Passenger Cars, LCVs, HCVs; MacPherson Strut, Double Wishbone, Multi-link, Torsion Beam, Leaf Spring, and Other Architectures — Country/Regional Level
    • Rear Suspension, by architecture and vehicle type — Passenger Cars, LCVs, HCVs; Multi-link, Torsion Beam, Leaf Spring, Double Wishbone, MacPherson Strut, and Other Architectures — Country/Regional Level
    • Passive, Semi-active, and Active Suspension, by architecture and vehicle type — Passenger Cars, LCVs, HCVs; Country/Regional Level
    • Electric and Hybrid Vehicles, by vehicle type — Passenger Cars, LCVs, HCVs — Regional Level
    • Off-highway Vehicles, by vehicle type and region — Construction, Agriculture, Mining, and Other Off-highway Vehicles — Regional Level


Personalize This Research

  • Triangulate with your Own Data
  • Get Data as per your Format and Definition
  • Gain a Deeper Dive on a Specific Application, Geography, Customer or Competitor
  • Any level of Personalization
Request A Free Customisation

Let Us Help You

  • What are the Known and Unknown Adjacencies Impacting the Automotive Suspension Market
  • What will your New Revenue Sources be?
  • Who will be your Top Customer; what will make them switch?
  • Defend your Market Share or Win Competitors
  • Get a Scorecard for Target Partners
Customized Workshop Request

Custom Market Research Services

We Will Customise The Research For You, In Case The Report Listed Above Does Not Meet With Your Requirements

Get 10% Free Customisation

TESTIMONIALS

Growth opportunities and latent adjacency in Automotive Suspension Market

avtar

Richard

Jun, 2022

How do emerging markets offer revenue expansion opportunities in Automotive Suspension Market?.

avtar

User

Aug, 2019

I am interested to get the report for Vietnam manufacturer air suspension market and how many registered car user with car brand in Vietnam market. .

avtar

User

Aug, 2019

What are the sources used for the market figures and a segmentation between OEMs and Aftermarket?.

avtar

User

Aug, 2019

I need to get information such as graph with numerical values for the size of global automotive suspension part market. .

avtar

User

Aug, 2019

Hello! i am about to provide suspension parts to Indian automobile vehicles as a vendor. I want to know various suspension segments that are available in the industry within different countries. .

avtar

User

Aug, 2019

I would like to understand 1) Market share of the biggest companies, 2) Market size with respect to technology (Active/Semi-Active/Passive).

avtar

User

Aug, 2019

I need to understand suspension market for Electric quadricycles, Electric three wheelers , L7 vehicles, L6 vehicles and L5 vehicles .

avtar

User

Aug, 2019

Global market share of suspension by system(passive, semiactive, active) and supplier (Sachs, KYB, Mando, etc). Is this report contain this information?.

avtar

User

Jul, 2019

In which vehicles in general are air suspension compressors to find? In which vehicles worldwide can they be installed? (types, quantity, not only OEMs) Data about air suspension compressors on the commercial vehicle market in China: Trucks, agricultural vehicle Is there a tendency, that EVs use air suspension compressors regulary?.

avtar

Manolo

Jun, 2026

I need to analyze for a project the market of suspension systems .

avtar

David

Jun, 2026

Looking to understand this area of mechanical application .

avtar

Marion

Jun, 2026

Searching for pdf and xls to analyse Air Suspension Market until 2032 for automotive industry.

avtar

Cyril

Jun, 2026

We need Automotive Suspension Insights for clients.

Show More
THIS REPORT TELLS YOU

How big the Automotive Suspension market is, and who leads it.

GROWTHIQ TELLS YOU NEW

Where your company should play next, and who is taking your share.

Get your company's view of this market. Free snapshot.

DMCA.com Protection Status
popup img