Animal Disinfectants Market

Animal Disinfectants Market by Application (Dairy Cleaning, Swine, Poultry, Equine, Dairy & Ruminants, and Aquaculture), Form (Liquid and Powder), Type (Iodine, Lactic Acid, Hydrogen Peroxide) and Region - Global Forecast to 2028

Report Code: AGI 7261 Jun, 2023, by marketsandmarkets.com

The animal disinfectants market is expected to witness significant growth, with projections indicating a rise from USD 3.4 billion in 2023 to USD 4.9 billion by 2028, representing a compound annual growth rate (CAGR) of 7.7% in terms of value over the forecast period.

The animal disinfectants market has experienced substantial growth in the recent years, driven by numerous factors. Increasing concerns regarding animal health and welfare, coupled with the rising demand for safe and high-quality animal products, have propelled the adoption of effective measures in the livestock industry. This measure includes use of disinfectants as a vital remedy for the well-being of animals. Disease outbreaks, both in developed and developing economies have highlighted the need for robust disinfection protocols to prevent the spread of pathogens. Additionally, technological advancements and research investments have also contributed to the development of innovative and more efficient disinfection solutions. As the global demand for animal protein continuous to rise and awareness of biosecurity practices increases, the animal disinfectants market is expected to witness sustained growth in the foreseeable future.

Animal Disinfectants Market

To know about the assumptions considered for the study, Request for Free Sample Report

Animal Disinfectants Market

To know about the assumptions considered for the study, download the pdf brochure

Market Dynamics

Driver: Increasing occurrences of diseases among livestock

Incidences of livestock diseases have been on the rise over the past decade; this can be attributed to the increasing livestock population and meat exports, resulting in the spread of livestock diseases across different regions. The World Organization for Animal Health 2020 has detailed a list of diseases affecting different livestock species. In 2022, at least 24 countries in South Asia, East Asia, and Southeast Asia are at risk of lumpy skin disease (LSD), which has transformed into a transboundary animal disease.

The African swine fever (ASF) is also among the major disease outbreaks affecting livestock populations across Europe, Africa, and Asia. ASF is a highly contagious hemorrhagic viral disease of domestic and wild pigs; it is responsible for serious economic and production losses. Other major incidences of disease outbreaks in livestock include Avian influenza (AI), which affects poultry livestock; Infectious Salmon Anemia Virus (ISAV), which affects the aquaculture sector; and the foot-and-mouth disease (FMD), which affects cattle, swine, sheep, goats, and other cloven-hoofed ruminants. As the number of diseases affecting livestock increases, there is a growing emphasis on disease prevention and control measures. Animal disinfectants play a crucial role in reducing the transmission of pathogens and preventing disease outbreaks.

Restraint: High costs and long duration associated with the development of disinfectant compounds

Developing effective and safe disinfectant compounds for animal use requires extensive research and development (R&D) efforts. R&D activities involve conducting scientific studies, testing various formulations, and ensuring compliance with regulatory standards. These processes often incur substantial costs, including expenses for laboratory equipment, personnel, and trials. The high R&D costs can make it challenging for companies to bring new and innovative disinfectant products to the market. Also, animal disinfectants are subject to stringent regulatory requirements to ensure their safety, efficacy, and environmental impact. Obtaining regulatory approvals for new disinfectant compounds can be a time-consuming and expensive process. Companies need to conduct comprehensive studies to demonstrate the effectiveness and safety of their products. This process may involve multiple phases of testing and evaluation, leading to prolonged development timelines and increased costs.

The costs associated with research, development, and regulatory compliance can significantly impact the profit margins for animal disinfectant manufacturers. Even after successfully bringing a product to market, companies may face pricing pressures due to intense competition. The limited profit margins can discourage investment in the development of new disinfectant compounds, particularly for niche markets or specific animal species. Thus, the high cost and long duration associated with the development of disinfectant compounds act as a restraint for the animal disinfectant market.

Opportunity: Rise in consumer preference for biological disinfectants

The demand for biological disinfectants is expected to increase during the forecast period on account of the rising consumer inclination toward non-toxic disinfectants coupled with the rising livestock production globally. The general consumer perception is toward the toxic nature of synthetic formulations that farmers are seeking to avoid and adopt biological solutions. The recent change in the regulatory requirements in the developed markets, including the classification of formaldehyde as a possible carcinogen, is a key factor expected to propel the demand for biological disinfectants.

For instance, in Sep 2022, Canada based company Thymox SF, a subsidiary of Laboratoire M2 Inc., made a partnership with Construction Distribution and Supply Co. Inc. (CDS) (US).  Through this partnership, CDS gains access to Thymox SF's advanced technology and product line, allowing them to diversify their offering and meet the needs of customers seeking eco-friendly disinfection options for animal facilities. By incorporating Thymox SF's biodegradable disinfectants into their distribution network, CDS can position themselves as a reliable supplier of sustainable solutions, attracting environmentally conscious customers and gaining a competitive advantage in the market.

Thus, the increasing preference for biological disinfectants presents a promising opportunity for the animal disinfectant market. Companies such as Thymox SF’s (Canada) and Ceetal (France) have successfully capitalized on this trend, offering innovative and sustainable solutions that align with consumer demands.

Challenge: Low usage due to lack of awareness about standard operating procedures

Lack of awareness about various practices related to the application of animal disinfectants in agricultural settings is the major challenge witnessed in the animal disinfectants market. The terminal disinfection procedure is a key procedure that needs to be followed annually in farms that are in continual usage. The method is adopted when animal housing is not used, and soiling is removed through cleaning. This procedure is used after the departure of a batch of livestock or once every year if the premises are not used continuously. The cleaning process for livestock farms varies based on the type of livestock being raised; however, it was observed under experimental conditions by the World Organization for Animal Health that cleaning alone removes approximately 99% of bacteria, while in a farm environment, this figure is likely to be nearer 90%. Removal of a further 6%–7% of bacteria is obtained in practice by disinfection, and an additional 1%–2% by fumigation. The water drawn for the cleaning process should also be monitored and filtered using disinfectants to prevent contaminated water from spreading infection.

Animal Disinfectants Market Ecosystem

Animal disinfectants fall under the industrial cleaning chemicals category. These products are targeted for various end-user industries such as healthcare, consumer products, food production, livestock farming, water treatment, and container disinfection in transport.

These products are intended for utilization on inanimate objects such as floors of animal sheds, piping, fittings, and equipment, and even on animals. They are almost exclusively available & sold as cleaning and disinfectant chemicals with multifunctional traits; their contribution to livestock biosecurity (both continuous and terminal) has brought animal disinfectants to the centre stage. MarketsandMarkets’ coverage on the market ecosystem encompasses raw material suppliers, disinfectant manufacturers, and end-use industries in the livestock sector.

Animal Disinfectants Market

By type, Iodine is anticipated to have the fastest growth rate during the forecast period.

Iodophors are disinfectants formed by the combination of iodine and various other carrier compounds, as well as stabilizing agents such as Globaline, which is composed of tetraglycine hydroperiodide, sodium acid pyrophosphate, and talc. These helps release iodine in an acid medium and have disinfectant properties, which affect bacteria, viruses, and some spores. Iodophors are generally used for disinfection & cleaning, bovine teat dips, and surgical scrubs. Hard water and the presence of a large amount of organic material reduce the activity of iodophors. However, iodophor disinfectants function effectively in the presence of traces of organic materials.

By application, the dairy cleaning segment is projected to dominate the market during the forecast period.

The cleaning of dairy cattle involves removing equipment and bedding before cleaning. The nature of the surfaces will influence the disinfection process. Rough and porous surfaces are difficult to disinfect in comparison to smooth surfaces. Both the milking parlor and milk toxin-producing machines must be cleaned daily. The milking machines, including the teat dips and milk tongs, are among the major sources of infection and can have an adverse impact on the health of the livestock. Therefore, these disinfectants can be applied to various areas, including milking parlors, holding pens, feeding areas, equipment like milking machines and others to thoroughly sanitize and eliminate the potential sources of contamination. Also, the regular utilization of animal disinfectants in dairy cleansing helps to create a healthier and more productive environment for both animals and dairy workers, thereby promoting the overall well-being and efficiency of the dairy operation.

Europe is expected to lead the animal disinfectants market with the highest market value during the forecast period.

Europe is one of the leading per capita consumers of chemicals and is a key market for animal disinfectants. There has been a significant utilization of animal disinfectants for farm animals in the region to reduce animal diseases. Regulatory requirements and standards regarding animal health and welfare are becoming more stringent in Europe. Compliance with these regulations necessitates the use of effective disinfection protocols. As a result, farmers and animal care facilities are seeking reliable and approved animal disinfectants to ensure they meet the required hygiene standards. This has contributed to the rising demand for such products in the European market. The region also has a significant livestock population that includes poultry, cattle, swine, and others. The concentration of livestock in the region, both in terms of commercial farming and smaller-scale operations, creates a substantial market for animal disinfectants to preserve the health and hygiene of the animals.

Animal Disinfectants Market by Region

Animal Disinfectants Market Share

The key players of the market include Neogen Corporation (US), GEA Group (Germany), Lanxess (Germany), Zoetis (US), Solvay Group (Belgium), Kersia Group (France), Stockmeier Group (Germany), Ecolab (US), Albert Kerbel GMBH (Germany), PCC Group (Germany), G Sheperdanimal Health (UK), Sanosil Ag (Switzerland), Delaval Inc (Sweden), Diversey Holdings Ltd (US), Fink Tech Gmbh (Germany). These companies have been focusing on expanding their market presence, enhancing their solutions, and partnering with many channel partners to cater to consumers across the globe. The deep roots of these players in the market and their robust offerings are among the major factors that have helped them achieve major sales and revenues in the global animal disinfectants market.

Get online access to the report on the World's First Market Intelligence Cloud

  • Easy to Download Historical Data & Forecast Numbers
  • Company Analysis Dashboard for high growth potential opportunities
  • Research Analyst Access for customization & queries
  • Competitor Analysis with Interactive dashboard
  • Latest News, Updates & Trend analysis
Request Sample

Scope of the Report

Report Metric

Details

Market size value in 2023

USD 3.4 billion

Revenue forecast in 2028

USD 4.9 billion

Growth Rate

CAGR of 7.7% from 2023 to 2028

Market size estimation

2023–2028

Base year considered

2022

Forecast period considered

2023–2028

Units considered

Value (USD)

Segments covered

By Type, By Application, By Form, and By Region

Regions covered

North America, Europe, Asia Pacific, South America and RoW

Companies studied

  • Neogen Corporation (US)
  • GEA Group (Germany)
  • Lanxess (Germany)
  • Zoetis (US)
  • Solvay Group (Belgium)
  • Kersia Group (France)
  • Stockmeier Group (Germany)
  • Ecolab (US)
  • Albert Kerbel GMBH (Germany)
  • PCC Group (Germany)
  • G Sheperdanimal Health (UK)
  • Sanosil Ag (Switzerland)
  • Delaval Inc (Sweden)
  • Diversey Holdings Ltd (US)
  • Fink Tech Gmbh (Germany)
  • Evans Vanodien International PLC (UK)
  • Vibrac (France)
  • Virox Animal Health (Canada)
  • Kemin Industries (US)
  • Ashish Life Science (India)
  • Sunways Bioscience LLP (Cyprus)
  • Zelence Industries Private Limited (India)
  • Cresta Aqua Tech (India)
  • Advacare Pharma (US)
  • Acuro Organics Ltd (India)

Animal disinfectants Market Segmentation:

This research report categorizes the animal disinfectants market, based on type, application, form, region.

By Type
  • Lactic acid
  • Glycolic acid
  • Phenolic acid
  • Hydrogen peroxide
  • Peracetic acid
  • Iodine
  • Chlorine
  • Chlorine dioxide
  • Glut-quat mixes
  • Quaternary compounds
  • Chlorohexidine
  • Other types (alcohols, alkalis, glycerol, and other aldehydes)
By Application
  • Swine
  • Poultry
  • Equine
  • Aquaculture
  • Dairy & ruminants
  • Dairy cleaning
By Form
  • Powder
  • Liquid
By Region
  • North America
  • Europe
  • Asia Pacific
  • South America
  • Rest of the World

Animal disinfectants Market Industry News

  • In September 2022, Zoetis acquired Jurox, headquartered in Australia. The acquisition provides Zoetis with a valuable animal health portfolio well-positioned for global reach. Through this acquisition, Zoetis gained access to a range of important products that have strong growth potential in various markets.
  • In December 2021, Neogen Corporation acquired Delf (UK) Ltd., a manufacturer and supplier of animal hygiene and industrial cleaning products based in the United Kingdom. Delf is a select member of the Iodine Registration Group (IRG), allowing it to supply Article 95 PVP-iodine and iodine-based biocidal products to the animal hygiene markets in the UK and the European Union. This acquisition would also enable Neogen Corporation to strengthen its position in the Europe.
  • In August 2021, Lanxess acquired the microbial control business of the US-based group IFF. Lanxess has strengthened its specialty chemicals portfolio to expand areas of disinfectants, personal care, and material protection through this acquisition.
  • In May 2021, CID Lines N.V. was acquired by ECOLAB Inc., a US-based leader in water, food safety, and animal hygiene products & services under a newly formed segment of the Animal Health Division. This acquisition helps CID Lines N.V. to strengthen its position in the US to provide animal hygiene products.

Frequently Asked Questions (FAQ):

To speak to our analyst for a discussion on the above findings, click Speak to Analyst

TABLE OF CONTENTS
 
1 INTRODUCTION (Page No. - 41)
    1.1 STUDY OBJECTIVES 
    1.2 MARKET DEFINITION 
    1.3 STUDY SCOPE 
           FIGURE 1 MARKET SEGMENTATION
           1.3.1 REGIONS COVERED
           1.3.2 INCLUSIONS & EXCLUSIONS
           1.3.3 YEARS CONSIDERED
    1.4 CURRENCY CONSIDERED 
           TABLE 1 USD EXCHANGE RATES, 2018–2022
    1.5 STAKEHOLDERS 
    1.6 SUMMARY OF CHANGES 
           1.6.1 RECESSION IMPACT ANALYSIS
 
2 RESEARCH METHODOLOGY (Page No. - 47)
    2.1 RESEARCH DATA 
           FIGURE 2 ANIMAL DISINFECTANTS MARKET: RESEARCH DESIGN
           2.1.1 SECONDARY DATA
                    2.1.1.1 Key data from secondary sources
           2.1.2 PRIMARY DATA
                    2.1.2.1 Key data from primary sources
                    2.1.2.2 Key industry insights
                    2.1.2.3 Breakdown of primaries
    2.2 MARKET SIZE ESTIMATION 
           2.2.1 APPROACH ONE: TOP-DOWN
                    FIGURE 3 ANIMAL DISINFECTANTS MARKET SIZE ESTIMATION – TOP-DOWN APPROACH
           2.2.2 APPROACH: BOTTOM-UP
                    FIGURE 4 ANIMAL DISINFECTANTS MARKET SIZE ESTIMATION – BOTTOM-UP APPROACH
                    FIGURE 5 ANIMAL DISINFECTANTS MARKET SIZE ESTIMATION (SUPPLY SIDE)
                    FIGURE 6 ANIMAL DISINFECTANTS MARKET SIZE ESTIMATION (DEMAND SIDE)
    2.3 DATA TRIANGULATION 
           FIGURE 7 DATA TRIANGULATION METHODOLOGY
    2.4 RESEARCH ASSUMPTIONS 
           2.4.1 ASSUMPTIONS
                    TABLE 2 STUDY ASSUMPTIONS
    2.5 RESEARCH LIMITATIONS & ASSOCIATED RISKS 
    2.6 RECESSION IMPACT ON ANIMAL DISINFECTANTS MARKET 
           2.6.1 MACRO INDICATORS OF RECESSION
                    FIGURE 8 INDICATORS OF RECESSION
                    FIGURE 9 WORLD INFLATION RATE: 2011-2021
                    FIGURE 10 GLOBAL GDP: 2011-2021 (USD TRILLION)
                    FIGURE 11 RECESSION INDICATORS AND THEIR IMPACT ON ANIMAL DISINFECTANTS MARKET
                    FIGURE 12 GLOBAL ANIMAL DISINFECTANTS MARKET: EARLIER FORECAST VS. RECESSION FORECAST
 
3 EXECUTIVE SUMMARY (Page No. - 62)
    TABLE 3 ANIMAL DISINFECTANTS MARKET SNAPSHOT (VALUE), 2023 VS. 2028 
    FIGURE 13 ANIMAL DISINFECTANTS MARKET SIZE, BY TYPE, 2023 VS. 2028 (USD MILLION) 
    FIGURE 14 ANIMAL DISINFECTANTS MARKET SIZE, BY APPLICATION, 2023 VS. 2028 (USD MILLION) 
    FIGURE 15 ANIMAL DISINFECTANTS MARKET SIZE, BY FORM, 2023 VS. 2028 (USD MILLION) 
    FIGURE 16 ANIMAL DISINFECTANTS MARKET SHARE (VALUE), BY REGION, 2022 
 
4 PREMIUM INSIGHTS (Page No. - 67)
    4.1 BRIEF OVERVIEW 
           FIGURE 17 RISING INCIDENCES OF DISEASES IN LIVESTOCK TO PROPEL MARKET
    4.2 EUROPE: ANIMAL DISINFECTANTS MARKET, BY KEY TYPE AND COUNTRY 
           FIGURE 18 FRANCE ACCOUNTED FOR LARGEST SHARE OF EUROPEAN MARKET IN 2022
    4.3 ANIMAL DISINFECTANTS MARKET, BY APPLICATION AND REGION, 2022 
           FIGURE 19 DAIRY CLEANING TO DOMINATE MARKET DURING FORECAST PERIOD
    4.4 ANIMAL DISINFECTANTS MARKET, BY FORM 
           FIGURE 20 LIQUID FORM TO DOMINATE MARKET IN 2022
    4.5 ANIMAL DISINFECTANTS MARKET: MAJOR REGIONAL SUBMARKETS 
           FIGURE 21 US TO DOMINATE MARKET IN 2022
 
5 ANIMAL DISINFECTANTS MARKET OVERVIEW (Page No. - 70)
    5.1 INTRODUCTION 
           FIGURE 22 EUROPE: SHARE OF LIVESTOCK DISEASE OUTBREAKS, 2020
    5.2 MACROECONOMIC INDICATORS 
           5.2.1 RISE IN GLOBAL POPULATION
                    FIGURE 23 WORLD POPULATION PROSPECTS, 2022
    5.3 MARKET DYNAMICS 
           FIGURE 24 ANIMAL DISINFECTANTS MARKET DYNAMICS
           5.3.1 DRIVERS
                    5.3.1.1 Rising incidences of diseases in livestock
                               TABLE 4 MAJOR LIVESTOCK DISEASES CONSIDERED FOR ANIMAL DISINFECTANTS STUDY
                               FIGURE 25 NUMBER OF ANIMALS LOST TO AFRICAN SWINE FEVER, BY REGION, 2016–2020
                    5.3.1.2 Growth in livestock production to drive animal hygiene products usage
                               FIGURE 26 EU: PER CAPITA MEAT CONSUMPTION, BY CATEGORY, 2020
                    5.3.1.3 Increase in regulations concerning terminal disinfection to curb potential outbreaks
           5.3.2 RESTRAINTS
                    5.3.2.1 High costs and long duration associated with disinfectant compounds
                    5.3.2.2 High-entry barriers for players
           5.3.3 OPPORTUNITIES
                    5.3.3.1 Increase in consumer preference for biological disinfectants
           5.3.4 CHALLENGES
                    5.3.4.1 Low usage due to lack of awareness about standard operating procedures
 
6 ANIMAL DISINFECTANTS INDUSTRY TRENDS (Page No. - 80)
    6.1 INTRODUCTION 
    6.2 VALUE CHAIN ANALYSIS 
           FIGURE 27 ANIMAL DISINFECTANTS: VALUE CHAIN ANALYSIS
    6.3 PRICING ANALYSIS: ANIMAL DISINFECTANTS MARKET, BY TYPE 
           FIGURE 28 AVERAGE SELLING PRICE, BY TYPE, 2018–2022 (USD/TON)
    6.4 ECOSYSTEM MAP 
           6.4.1 ANIMAL DISINFECTANTS MARKET: ECOSYSTEM VIEW
           6.4.2 ANIMAL DISINFECTANTS MARKET MAP
                    6.4.2.1 Upstream
                               6.4.2.1.1 Disinfectant manufacturers
                               6.4.2.1.2 Raw material providers
                               6.4.2.1.3 Academia and research institutes
                    6.4.2.2 Downstream
                               6.4.2.2.1 Retailers, distributors, and service providers
    6.5 TRENDS/DISRUPTIONS IMPACTING CUSTOMER’S BUSINESS 
           FIGURE 29 REVENUE SHIFT FOR ANIMAL DISINFECTANTS MARKET
    6.6 PATENT ANALYSIS 
           FIGURE 30 REGIONAL ANALYSIS OF PATENTS GRANTED
           FIGURE 31 ANALYSIS OF PATENTS GRANTED, 2012–2022
           TABLE 5 KEY PATENTS PERTAINING TO DISINFECTANTS IN LIVESTOCK, 2022
    6.7 TRADE ANALYSIS 
           TABLE 6 KEY EXPORTING COUNTRIES OF DISINFECTANTS, 2022 (USD MILLION)
           FIGURE 32 DISINFECTANTS EXPORT, BY KEY COUNTRY, 2018–2022 (USD MILLION)
           TABLE 7 KEY IMPORTING COUNTRIES OF DISINFECTANTS, 2022 (USD MILLION)
           FIGURE 33 DISINFECTANTS IMPORT, BY KEY COUNTRY, 2018–2022 (USD MILLION)
    6.8 KEY CONFERENCES & EVENTS IN 2023 
           TABLE 8 ANIMAL DISINFECTANTS MARKET: DETAILED LIST OF CONFERENCES & EVENTS
    6.9 TARIFF AND REGULATORY LANDSCAPE 
           6.9.1 REGULATORY BODIES, GOVERNMENT AGENCIES, AND OTHER ORGANIZATIONS
                    TABLE 9 NORTH AMERICA: LIST OF REGULATORY BODIES, GOVERNMENT AGENCIES, AND OTHER ORGANIZATIONS
                    TABLE 10 EUROPE: LIST OF REGULATORY BODIES, GOVERNMENT AGENCIES, AND OTHER ORGANIZATIONS
                    TABLE 11 ASIA PACIFIC: LIST OF REGULATORY BODIES, GOVERNMENT AGENCIES, AND OTHER ORGANIZATIONS
                    TABLE 12 REST OF THE WORLD: LIST OF REGULATORY BODIES, GOVERNMENT AGENCIES, AND OTHER ORGANIZATIONS
    6.10 REGULATORY FRAMEWORK 
           6.10.1 INTRODUCTION
           6.10.2 NORTH AMERICA
                    6.10.2.1 US
                    6.10.2.2 Canada
           6.10.3 EUROPE
           6.10.4 ASIA PACIFIC
                    6.10.4.1 China
                    6.10.4.2 India
                    6.10.4.3 Japan
                    6.10.4.4 Australia
           6.10.5 SOUTH AMERICA
                    6.10.5.1 Brazil
                    6.10.5.2 Argentina
    6.11 TECHNOLOGY ANALYSIS 
           6.11.1 NANOTECHNOLOGY-BASED DISINFECTANTS
    6.12 PORTER’S FIVE FORCES ANALYSIS 
                    TABLE 13 ANIMAL DISINFECTANTS MARKET: PORTER’S FIVE FORCES ANALYSIS
           6.12.1 INTENSITY OF COMPETITIVE RIVALRY
           6.12.2 BARGAINING POWER OF SUPPLIERS
           6.12.3 BARGAINING POWER OF BUYERS
           6.12.4 THREAT OF SUBSTITUTES
           6.12.5 THREAT OF NEW ENTRANTS
    6.13 KEY STAKEHOLDERS & BUYING CRITERIA 
           6.13.1 KEY STAKEHOLDERS IN BUYING PROCESS
                    FIGURE 34 INFLUENCE OF STAKEHOLDERS ON BUYING PROCESS
                    TABLE 14 INFLUENCE OF STAKEHOLDERS IN BUYING PROCESS FOR TOP 3 TYPES OF ANIMAL DISINFECTANTS (%)
           6.13.2 BUYING CRITERIA
                    FIGURE 35 KEY BUYING CRITERIA FOR TOP 3 PRODUCT TYPES
                    TABLE 15 KEY BUYING CRITERIA FOR TOP 3 TYPES OF ANIMAL DISINFECTANTS
    6.14 CASE STUDIES 
           6.14.1 NEOGEN CORPORATION'S INNOVATIONS REVOLUTIONIZED BIOSECURITY PRACTICES, LEADING TO IMPROVED ANIMAL HEALTH
                    TABLE 16 NEOGEN CORPORATION - TRANSFORMING ANIMAL DISINFECTANTS FOR ENHANCED BIOSECURITY
           6.14.2 EVONIK - ADVANCING ANIMAL DISINFECTANTS FOR IMPROVED BIOSECURITY
                    TABLE 17 EVONIK'S DEDICATION TO ADVANCING ANIMAL DISINFECTANTS RESULTED IN IMPROVED BIOSECURITY
 
7 ANIMAL DISINFECTANTS MARKET, BY APPLICATION (Page No. - 109)
    7.1 INTRODUCTION 
           FIGURE 36 ANIMAL DISINFECTANTS MARKET SIZE, BY APPLICATION, 2023 VS. 2028 (USD MILLION)
           TABLE 18 ANIMAL DISINFECTANTS MARKET, BY APPLICATION, 2018–2022 (USD MILLION)
           TABLE 19 ANIMAL DISINFECTANTS MARKET, BY APPLICATION, 2023–2028 (USD MILLION)
    7.2 DAIRY CLEANING 
           TABLE 20 MAJOR PATHOGENIC MICROORGANISMS ASSOCIATED WITH MILK AND DAIRY PRODUCTS
           TABLE 21 ANIMAL DISINFECTANTS MARKET IN DAIRY CLEANING, BY REGION, 2018–2022 (USD MILLION)
           TABLE 22 ANIMAL DISINFECTANTS MARKET IN DAIRY CLEANING, BY REGION, 2023–2028 (USD MILLION)
           TABLE 23 ANIMAL DISINFECTANTS MARKET IN DAIRY CLEANING, BY TYPE, 2018–2022 (USD MILLION)
           TABLE 24 ANIMAL DISINFECTANTS MARKET IN DAIRY CLEANING, BY TYPE, 2023–2028 (USD MILLION)
           7.2.1 CIP
                    7.2.1.1 Increase in hygiene concerns and need for effective cleaning to drive demand
           7.2.2 PIPELINES
                    7.2.2.1 Demand for alkaline and non-foaming detergents to drive market
           7.2.3 BULK TANKS
                    7.2.3.1 Removal of milk fats and storage cleaning to drive market
           7.2.4 MILKING SYSTEMS
                    7.2.4.1 Increase in cattle heads to bolster demand
    7.3 SWINE 
           FIGURE 37 WORLDWIDE EXPORT TRADE VALUE OF SWINE MEAT, 2022
           TABLE 25 ANIMAL DISINFECTANTS MARKET IN SWINE REARING, BY REGION, 2018–2022 (USD MILLION)
           TABLE 26 ANIMAL DISINFECTANTS MARKET IN SWINE REARING, BY REGION, 2023–2028 (USD MILLION)
           TABLE 27 ANIMAL DISINFECTANTS MARKET IN SWINE REARING, BY TYPE, 2018–2022 (USD MILLION)
           TABLE 28 ANIMAL DISINFECTANTS MARKET IN SWINE REARING, BY TYPE, 2023–2028 (USD MILLION)
           7.3.1 TERMINAL BIOSECURITY
                    7.3.1.1 Losses due to African swine fever (ASF) to drive demand
                               TABLE 29 ANIMAL DISINFECTANTS MARKET IN TERMINAL BIOSECURITY SWINE REARING, BY SUBTYPE, 2018–2022 (USD MILLION)
                               TABLE 30 ANIMAL DISINFECTANTS MARKET IN TERMINAL BIOSECURITY SWINE REARING, BY SUBTYPE, 2023–2028 (USD MILLION)
                               7.3.1.1.1 Surface disinfection housing
                               7.3.1.1.2 Equipment
                               7.3.1.1.3 Water lines
                               7.3.1.1.4 Aerial disinfection
           7.3.2 CONTINUOUS BIOSECURITY
                    7.3.2.1 Rise in swine products across developed economies to drive demand
                               TABLE 31 ANIMAL DISINFECTANTS MARKET IN CONTINUOUS BIOSECURITY SWINE REARING, BY SUBTYPE, 2018–2022 (USD MILLION)
                               TABLE 32 ANIMAL DISINFECTANTS MARKET IN CONTINUOUS BIOSECURITY SWINE REARING, BY SUBTYPE, 2023–2028 (USD MILLION)
                               7.3.2.1.1 Hand sanitation
                               7.3.2.1.2 Footbaths
                               7.3.2.1.3 Drinking water
                               7.3.2.1.4 Vehicle
    7.4 POULTRY 
           TABLE 33 ANIMAL DISINFECTANTS MARKET IN POULTRY REARING, BY REGION, 2018–2022 (USD MILLION)
           TABLE 34 ANIMAL DISINFECTANTS MARKET IN POULTRY REARING, BY REGION, 2023–2028 (USD MILLION)
           TABLE 35 ANIMAL DISINFECTANTS MARKET IN POULTRY REARING, BY SUBTYPE, 2018–2022 (USD MILLION)
           TABLE 36 ANIMAL DISINFECTANTS MARKET IN POULTRY REARING, BY SUBTYPE, 2023–2028 (USD MILLION)
           7.4.1 TERMINAL BIOSECURITY
                    7.4.1.1 Intensive poultry farming to drive demand
                               TABLE 37 ANIMAL DISINFECTANTS MARKET IN TERMINAL BIOSECURITY POULTRY REARING, BY SUBTYPE, 2018–2022 (USD MILLION)
                               TABLE 38 ANIMAL DISINFECTANTS MARKET IN TERMINAL BIOSECURITY POULTRY REARING, BY SUBTYPE, 2023–2028 (USD MILLION)
                               7.4.1.1.1 Surface disinfection housing
                               7.4.1.1.2 Equipment
                               7.4.1.1.3 Water lines
                               7.4.1.1.4 Aerial disinfection
           7.4.2 CONTINUOUS BIOSECURITY
                    7.4.2.1 Rise in incidences of avian influenza and coccidiosis to fuel growth of disinfectants
                               TABLE 39 ANIMAL DISINFECTANTS MARKET IN CONTINUOUS BIOSECURITY POULTRY REARING, BY SUBTYPE, 2018–2022 (USD MILLION)
                               TABLE 40 ANIMAL DISINFECTANTS MARKET IN CONTINUOUS BIOSECURITY POULTRY REARING, BY SUBTYPE, 2023–2028 (USD MILLION)
                               7.4.2.1.1 Hand sanitation
                               7.4.2.1.2 Footbaths
                               7.4.2.1.3 Drinking water
                               7.4.2.1.4 Vehicle
    7.5 EQUINE 
           TABLE 41 ANIMAL DISINFECTANTS MARKET IN EQUINE REARING, BY REGION, 2018–2022 (USD MILLION)
           TABLE 42 ANIMAL DISINFECTANTS MARKET IN EQUINE REARING, BY REGION, 2023–2028 (USD MILLION)
           TABLE 43 ANIMAL DISINFECTANTS MARKET IN EQUINE REARING, BY SUBTYPE, 2018–2022 (USD MILLION)
           TABLE 44 ANIMAL DISINFECTANTS MARKET IN EQUINE REARING, BY SUBTYPE, 2023–2028 (USD MILLION)
           7.5.1 TERMINAL BIOSECURITY
                    7.5.1.1 Stable maintenance and equine disinfection procedures to drive demand
                               TABLE 45 ANIMAL DISINFECTANTS MARKET IN TERMINAL BIOSECURITY EQUINE REARING, BY SUBTYPE, 2018–2022 (USD MILLION)
                               TABLE 46 ANIMAL DISINFECTANTS MARKET IN TERMINAL BIOSECURITY EQUINE REARING, BY SUBTYPE, 2023–2028 (USD MILLION)
                               7.5.1.1.1 Surface disinfection housing
                               7.5.1.1.2 Equipment
                               7.5.1.1.3 Water lines
                               7.5.1.1.4 Aerial disinfection
           7.5.2 CONTINUOUS BIOSECURITY
                    7.5.2.1 Disease prevention programs and high livestock value to drive demand
                               TABLE 47 ANIMAL DISINFECTANTS MARKET IN CONTINUOUS BIOSECURITY EQUINE REARING, BY SUBTYPE, 2018–2022 (USD MILLION)
                               TABLE 48 ANIMAL DISINFECTANTS MARKET IN CONTINUOUS BIOSECURITY EQUINE REARING, BY SUBTYPE, 2023–2028 (USD MILLION)
                               7.5.2.1.1 Hand sanitation
                               7.5.2.1.2 Footbaths
                               7.5.2.1.3 Drinking water
                               7.5.2.1.4 Vehicle
    7.6 DAIRY & RUMINANTS 
           FIGURE 38 WORLDWIDE IMPORT TRADE VALUE OF LIVE SHEEP AND GOATS, 2022
           TABLE 49 ANIMAL DISINFECTANTS MARKET IN DAIRY & RUMINANT REARING, BY REGION, 2018–2022 (USD MILLION)
           TABLE 50 ANIMAL DISINFECTANTS MARKET IN DAIRY & RUMINANT REARING, BY REGION, 2023–2028 (USD MILLION)
           TABLE 51 ANIMAL DISINFECTANTS MARKET IN DAIRY & RUMINANT REARING, BY SUBTYPE, 2018–2022 (USD MILLION)
           TABLE 52 ANIMAL DISINFECTANTS MARKET IN DAIRY & RUMINANT REARING, BY SUBTYPE, 2023–2028 (USD MILLION)
           7.6.1 TEAT DIPS
                    7.6.1.1 Concerns over dairy cattle health and mastitis threat to drive demand
           7.6.2 HOOF CARE
                    7.6.2.1 Expansion of dairy operations and focus on health of dairy herds to drive demand
    7.7 AQUACULTURE 
           TABLE 53 ANIMAL DISINFECTANTS MARKET IN AQUACULTURE, BY REGION, 2018–2022 (USD MILLION)
           TABLE 54 ANIMAL DISINFECTANTS MARKET IN AQUACULTURE, BY REGION, 2023–2028 (USD MILLION)
           TABLE 55 ANIMAL DISINFECTANTS MARKET IN AQUACULTURE, BY SUBTYPE, 2018–2022 (USD MILLION)
           TABLE 56 ANIMAL DISINFECTANTS MARKET IN AQUACULTURE, BY SUBTYPE, 2023–2028 (USD MILLION)
           7.7.1 SURFACE DISINFECTION
                    7.7.1.1 Increase in commercial aquaculture activities to drive demand
           7.7.2 CONTINUOUS DISINFECTION
                    7.7.2.1 Increased awareness regarding disease prevention and control to augment demand
 
8 ANIMAL DISINFECTANTS MARKET, BY FORM (Page No. - 137)
    8.1 INTRODUCTION 
           FIGURE 39 ANIMAL DISINFECTANTS MARKET SIZE, BY FORM, 2023 VS. 2028 (USD MILLION)
           TABLE 57 ANIMAL DISINFECTANTS MARKET, BY FORM, 2018–2022 (USD MILLION)
           TABLE 58 ANIMAL DISINFECTANTS MARKET, BY FORM, 2023–2028 (USD MILLION)
    8.2 POWDER 
           8.2.1 EASE OF STORAGE & HANDLING TO DRIVE MARKET FOR POWDER FORM
                    TABLE 59 POWDER: ANIMAL DISINFECTANTS MARKET, BY REGION, 2018–2022 (USD MILLION)
                    TABLE 60 POWDER: ANIMAL DISINFECTANTS MARKET, BY REGION, 2023–2028 (USD MILLION)
    8.3 LIQUID 
           8.3.1 EASY AVAILABILITY, LOW COST, AND WATER-SOLUBLE NATURE TO DRIVE DEMAND
                    TABLE 61 LIQUID: ANIMAL DISINFECTANTS MARKET, BY REGION, 2018–2022 (USD MILLION)
                    TABLE 62 LIQUID: ANIMAL DISINFECTANTS MARKET, BY REGION, 2023–2028 (USD MILLION)
 
9 ANIMAL DISINFECTANTS MARKET, BY TYPE (Page No. - 142)
    9.1 INTRODUCTION 
           TABLE 63 COMMON DISINFECTANTS AND THEIR APPLICATIONS
           FIGURE 40 ANIMAL DISINFECTANTS MARKET SIZE, BY TYPE, 2023 VS. 2028 (USD MILLION)
           TABLE 64 ANIMAL DISINFECTANTS MARKET, BY TYPE, 2018–2022 (USD MILLION)
           TABLE 65 ANIMAL DISINFECTANTS MARKET, BY TYPE, 2023–2028 (USD MILLION)
           TABLE 66 ANIMAL DISINFECTANTS MARKET, BY TYPE, 2018–2022 (KT)
           TABLE 67 ANIMAL DISINFECTANTS MARKET, BY TYPE, 2023–2028 (KT)
    9.2 IODINE 
           9.2.1 EFFECTIVE ANTIMICROBIAL PROPERTIES OF IODINE TO INFLUENCE GROWTH OF IODINE-BASED ANIMAL DISINFECTANTS
                    TABLE 68 IODINE-BASED ANIMAL DISINFECTANTS MARKET, BY REGION, 2018–2022 (USD MILLION)
                    TABLE 69 IODINE-BASED ANIMAL DISINFECTANTS MARKET, BY REGION, 2023–2028 (USD MILLION)
                    TABLE 70 IODINE-BASED ANIMAL DISINFECTANTS MARKET, BY REGION, 2018–2022 (KT)
                    TABLE 71 IODINE-BASED ANIMAL DISINFECTANTS MARKET, BY REGION, 2023–2028 (KT)
    9.3 LACTIC ACID 
           9.3.1 EFFECTIVE ACTION AGAINST BACTERIA TO MAKE LACTIC ACID DISINFECTANTS SUITABLE FOR SURFACE CLEANING
                    TABLE 72 TOP EXPORTERS OF CARBOXYLIC ACID AND LACTIC ACID WORLDWIDE IN 2021
                    TABLE 73 LACTIC ACID-BASED ANIMAL DISINFECTANTS MARKET, BY REGION, 2018–2022 (USD MILLION)
                    TABLE 74 LACTIC ACID-BASED ANIMAL DISINFECTANTS MARKET, BY REGION, 2023–2028 (USD MILLION)
                    TABLE 75 LACTIC ACID-BASED ANIMAL DISINFECTANTS MARKET, BY REGION, 2018–2022 (KT)
                    TABLE 76 LACTIC ACID-BASED ANIMAL DISINFECTANTS MARKET, BY REGION, 2023–2028 (KT)
    9.4 HYDROGEN PEROXIDE 
           9.4.1 RAPID BACTERIAL ACTIVITY TO MAKE HYDROGEN PEROXIDE EFFECTIVE DISINFECTANT
                    FIGURE 41 GLOBAL HYDROGEN PEROXIDE EXPORT VALUE, 2018–2022
                    TABLE 77 HYDROGEN PEROXIDE-BASED ANIMAL DISINFECTANTS MARKET, BY REGION, 2018–2022 (USD MILLION)
                    TABLE 78 HYDROGEN PEROXIDE-BASED ANIMAL DISINFECTANTS MARKET, BY REGION, 2023–2028 (USD MILLION)
                    TABLE 79 HYDROGEN PEROXIDE-BASED ANIMAL DISINFECTANTS MARKET, BY REGION, 2018–2022 (KT)
                    TABLE 80 HYDROGEN PEROXIDE-BASED ANIMAL DISINFECTANTS MARKET, BY REGION, 2023–2028 (KT)
    9.5 PHENOLIC ACID 
           9.5.1 STRONG DISINFECTANT EFFICACY OF PHENOL & DERIVATIVES TO BE USEFUL IN DISINFECTION OF EQUIPMENT
                    TABLE 81 PHENOLIC ACID-BASED ANIMAL DISINFECTANTS MARKET, BY REGION, 2018–2022 (USD MILLION)
                    TABLE 82 PHENOLIC ACID-BASED ANIMAL DISINFECTANTS MARKET, BY REGION, 2023–2028 (USD MILLION)
                    TABLE 83 PHENOLIC ACID-BASED ANIMAL DISINFECTANTS MARKET, BY REGION, 2018–2022 (KT)
                    TABLE 84 PHENOLIC ACID-BASED ANIMAL DISINFECTANTS MARKET, BY REGION, 2023–2028 (KT)
    9.6 PERACETIC ACID 
           9.6.1 ENVIRO-FRIENDLY PROPERTIES OF PERACETIC ACID TO AUGMENT GROWTH
                    TABLE 85 PERACETIC ACID-BASED ANIMAL DISINFECTANTS MARKET, BY REGION, 2018–2022 (USD MILLION)
                    TABLE 86 PERACETIC ACID-BASED ANIMAL DISINFECTANTS MARKET, BY REGION, 2023–2028 (USD MILLION)
                    TABLE 87 PERACETIC ACID-BASED ANIMAL DISINFECTANTS MARKET, BY REGION, 2018–2022 (KT)
                    TABLE 88 PERACETIC ACID-BASED ANIMAL DISINFECTANTS MARKET, BY REGION, 2023–2028 (KT)
    9.7 QUATERNARY COMPOUNDS 
           9.7.1 DEMAND FOR QUATERNARY COMPOUNDS TO REMAIN HIGH DUE TO THEIR NON-TOXIC AND BIODEGRADABLE NATURE
                    FIGURE 42 TOP GLOBAL IMPORTERS OF QUATERNARY AMMONIUM COMPOUNDS, 2022
                    TABLE 89 QUATERNARY COMPOUNDS-BASED ANIMAL DISINFECTANTS MARKET, BY REGION, 2018–2022 (USD MILLION)
                    TABLE 90 QUATERNARY COMPOUNDS-BASED ANIMAL DISINFECTANTS MARKET, BY REGION, 2023–2028 (USD MILLION)
                    TABLE 91 QUATERNARY COMPOUNDS-BASED ANIMAL DISINFECTANTS MARKET, BY REGION, 2018–2022 (KT)
                    TABLE 92 QUATERNARY COMPOUNDS-BASED ANIMAL DISINFECTANTS MARKET, BY REGION, 2023–2028 (KT)
    9.8 CHLORINE 
           9.8.1 BLEACHING AND GERMICIDAL PROPERTIES OF CHLORINE TO MAKE IT ONE OF MOST PREFERRED DISINFECTANTS
                    FIGURE 43 EXPORTED QUANTITY OF HYPOCHLORITES OF LEADING EXPORTERS, 2022
                    TABLE 93 CHLORINE-BASED ANIMAL DISINFECTANTS MARKET, BY REGION, 2018–2022 (USD MILLION)
                    TABLE 94 CHLORINE-BASED ANIMAL DISINFECTANTS MARKET, BY REGION, 2023–2028 (USD MILLION)
                    TABLE 95 CHLORINE-BASED ANIMAL DISINFECTANTS MARKET, BY REGION, 2018–2022 (KT)
                    TABLE 96 CHLORINE-BASED ANIMAL DISINFECTANTS MARKET, BY REGION, 2023–2028 (KT)
    9.9 CHLORINE DIOXIDE 
           9.9.1 FAST DISINFECTION AND REDUCTION OF IMPURITIES IN WATER TO DRIVE MARKET FOR LIVESTOCK
                    TABLE 97 CHLORINE DIOXIDE-BASED ANIMAL DISINFECTANTS MARKET, BY REGION, 2018–2022 (USD MILLION)
                    TABLE 98 CHLORINE DIOXIDE-BASED ANIMAL DISINFECTANTS MARKET, BY REGION, 2023–2028 (USD MILLION)
                    TABLE 99 CHLORINE DIOXIDE-BASED ANIMAL DISINFECTANTS MARKET, BY REGION, 2018–2022 (KT)
                    TABLE 100 CHLORINE DIOXIDE-BASED ANIMAL DISINFECTANTS MARKET, BY REGION, 2023–2028 (KT)
    9.10 CHLOROHEXIDINE 
           9.10.1 LOW TOXICITY OF CHLOROHEXIDINE TO BENEFIT MARKET
                    TABLE 101 CHLOROHEXIDINE-BASED ANIMAL DISINFECTANTS MARKET, BY REGION, 2018–2022 (USD MILLION)
                    TABLE 102 CHLOROHEXIDINE-BASED ANIMAL DISINFECTANTS MARKET, BY REGION, 2023–2028 (USD MILLION)
                    TABLE 103 CHLOROHEXIDINE-BASED ANIMAL DISINFECTANTS MARKET, BY REGION, 2018–2022 (KT)
                    TABLE 104 CHLOROHEXIDINE-BASED ANIMAL DISINFECTANTS MARKET, BY REGION, 2023–2028 (KT)
    9.11 GLUT-QUAT MIXES 
           9.11.1 STRONG DISINFECTION EFFICACY PROVIDED BY GLUTARALDEHYDE TO STRENGTHEN MARKET GROWTH
                    TABLE 105 GLUT-QUAT MIX-BASED ANIMAL DISINFECTANTS MARKET, BY REGION, 2018–2022 (USD MILLION)
                    TABLE 106 GLUT-QUAT MIX-BASED ANIMAL DISINFECTANTS MARKET, BY REGION, 2023–2028 (USD MILLION)
                    TABLE 107 GLUT-QUAT MIX-BASED ANIMAL DISINFECTANTS MARKET, BY REGION, 2018–2022 (KT)
                    TABLE 108 GLUT-QUAT MIX-BASED ANIMAL DISINFECTANTS MARKET, BY REGION, 2023–2028 (KT)
    9.12 GLYCOLIC ACID 
           9.12.1 APPLICATION IN DISINFECTING EQUIPMENT TO DRIVE MARKET
                    TABLE 109 GLYCOLIC ACID-BASED ANIMAL DISINFECTANTS MARKET, BY REGION, 2018–2022 (USD MILLION)
                    TABLE 110 GLYCOLIC ACID-BASED ANIMAL DISINFECTANTS MARKET, BY REGION, 2023–2028 (USD MILLION)
                    TABLE 111 GLYCOLIC ACID-BASED ANIMAL DISINFECTANTS MARKET, BY REGION, 2018–2022 (KT)
                    TABLE 112 GLYCOLIC ACID-BASED ANIMAL DISINFECTANTS MARKET, BY REGION, 2023–2028 (KT)
    9.13 OTHER TYPES 
                    TABLE 113 OTHER ANIMAL DISINFECTANT TYPES MARKET, BY REGION, 2018–2022 (USD MILLION)
                    TABLE 114 OTHER ANIMAL DISINFECTANT TYPES MARKET, BY REGION, 2023–2028 (USD MILLION)
                    TABLE 115 OTHER ANIMAL DISINFECTANT TYPES MARKET, BY REGION, 2018–2022 (KT)
                    TABLE 116 OTHER ANIMAL DISINFECTANT TYPES MARKET, BY REGION, 2023–2028 (KT)
 
10 ANIMAL DISINFECTANTS MARKET, BY REGION (Page No. - 172)
     10.1 INTRODUCTION 
               FIGURE 44 ANIMAL DISINFECTANTS MARKET, BY REGION, 2023 VS. 2028 (USD MILLION)
               FIGURE 45 CHINA TO BE FASTEST-GROWING COUNTRY
               TABLE 117 ANIMAL DISINFECTANTS MARKET, BY REGION, 2018–2022 (USD MILLION)
               TABLE 118 MARKET, BY REGION, 2023–2028 (USD MILLION)
               TABLE 119 MARKET, BY REGION, 2018–2022 (KT)
               TABLE 120 MARKET, BY REGION, 2023–2028 (KT)
     10.2 NORTH AMERICA 
               TABLE 121 NORTH AMERICA: ANIMAL DISINFECTANTS MARKET, BY COUNTRY, 2018–2022 (USD MILLION)
               TABLE 122 NORTH AMERICA: MARKET, BY COUNTRY, 2023–2028 (USD MILLION)
               TABLE 123 NORTH AMERICA: MARKET, BY TYPE, 2018–2022 (USD MILLION)
               TABLE 124 NORTH AMERICA: MARKET, BY TYPE, 2023–2028 (USD MILLION)
               TABLE 125 NORTH AMERICA: MARKET, BY TYPE, 2018–2022 (KT)
               TABLE 126 NORTH AMERICA: MARKET, BY TYPE, 2023–2028 (KT)
               TABLE 127 NORTH AMERICA: MARKET, BY APPLICATION, 2018–2022 (USD MILLION)
               TABLE 128 NORTH AMERICA: MARKET, BY APPLICATION, 2023–2028 (USD MILLION)
               TABLE 129 NORTH AMERICA: MARKET, BY FORM, 2018–2022 (USD MILLION)
               TABLE 130 NORTH AMERICA: MARKET, BY FORM, 2023–2028 (USD MILLION)
             10.2.1 NORTH AMERICA: RECESSION IMPACT ANALYSIS
                       FIGURE 46 INFLATION: COUNTRY-LEVEL DATA (2017–2021)
                       FIGURE 47 NORTH AMERICA: RECESSION IMPACT ANALYSIS
             10.2.2 US
                       10.2.2.1 Large-scale processing facilities focusing on domestic production to drive market
                                   TABLE 131 US: ANIMAL DISINFECTANTS MARKET, BY TYPE, 2018–2022 (USD MILLION)
                                   TABLE 132 US: ANIMAL DISINFECTANTS MARKET, BY TYPE, 2023–2028 (USD MILLION)
             10.2.3 CANADA
                       10.2.3.1 High export demand and industry standards to encourage disinfectants’ use
                                   TABLE 133 CANADA: ANIMAL DISINFECTANTS MARKET, BY TYPE, 2018–2022 (USD MILLION)
                                   TABLE 134 CANADA: MARKET, BY TYPE, 2023–2028 (USD MILLION)
             10.2.4 MEXICO
                       10.2.4.1 Government regulations and export requirements to drive market
                                   TABLE 135 MEXICO: ANIMAL DISINFECTANTS MARKET, BY TYPE, 2018–2022 (USD MILLION)
                                   TABLE 136 MEXICO: MARKET, BY TYPE, 2023–2028 (USD MILLION)
     10.3 EUROPE 
               FIGURE 48 EUROPE: ANIMAL DISINFECTANTS MARKET SNAPSHOT
               FIGURE 49 FRANCE TO DOMINATE MARKET DURING FORECAST PERIOD
               TABLE 137 EUROPE: ANIMAL DISINFECTANTS MARKET, BY COUNTRY, 2018–2022 (USD MILLION)
               TABLE 138 EUROPE: MARKET, BY COUNTRY, 2023–2028 (USD MILLION)
               TABLE 139 EUROPE: MARKET, BY TYPE, 2018–2022 (USD MILLION)
               TABLE 140 EUROPE: MARKET, BY TYPE, 2023–2028 (USD MILLION)
               TABLE 141 EUROPE: MARKET, BY TYPE, 2018–2022 (KT)
               TABLE 142 EUROPE: MARKET, BY TYPE, 2023–2028 (KT)
               TABLE 143 EUROPE: MARKET, BY APPLICATION, 2018–2022 (USD MILLION)
               TABLE 144 EUROPE: MARKET, BY APPLICATION, 2023–2028 (USD MILLION)
               TABLE 145 EUROPE: MARKET, BY FORM, 2018–2022 (USD MILLION)
               TABLE 146 EUROPE: MARKET, BY FORM, 2023–2028 (USD MILLION)
             10.3.1 EUROPE: RECESSION IMPACT ANALYSIS
                       FIGURE 50 EUROPE: INFLATION RATES, BY KEY COUNTRY, 2017–2021
             10.3.2 GERMANY
                       10.3.2.1 Outbreak of avian influenza to drive demand
                                   TABLE 147 GERMANY: ANIMAL DISINFECTANTS MARKET, BY TYPE, 2018–2022 (USD MILLION)
                                   TABLE 148 GERMANY: MARKET, BY TYPE, 2023–2028 (USD MILLION)
             10.3.3 UK
                       10.3.3.1 Intensive livestock farming and prevalence of Lyme and Hepatitis E to drive market
                                   TABLE 149 UK: ANIMAL DISINFECTANTS MARKET, BY TYPE, 2018–2022 (USD MILLION)
                                   TABLE 150 UK: MARKET, BY TYPE, 2023–2028 (USD MILLION)
             10.3.4 FRANCE
                       10.3.4.1 France being largest beef producer to propel market
                                   TABLE 151 FRANCE: ANIMAL DISINFECTANTS MARKET, BY TYPE, 2018–2022 (USD MILLION)
                                   TABLE 152 FRANCE: MARKET, BY TYPE, 2023–2028 (USD MILLION)
             10.3.5 SPAIN
                       10.3.5.1 Growth in meat industry to increase market demand
                                   TABLE 153 SPAIN: ANIMAL DISINFECTANTS MARKET, BY TYPE, 2018–2022 (USD MILLION)
                                   TABLE 154 SPAIN: MARKET, BY TYPE, 2023–2028 (USD MILLION)
             10.3.6 ITALY
                       10.3.6.1 Export of beef to other countries to influence demand
                                   TABLE 155 ITALY: ANIMAL DISINFECTANTS MARKET, BY TYPE, 2018–2022 (USD MILLION)
                                   TABLE 156 ITALY: MARKET, BY TYPE, 2023–2028 (USD MILLION)
             10.3.7 RUSSIA
                       10.3.7.1 Development in dairy to drive demand
                                   TABLE 157 RUSSIA: ANIMAL DISINFECTANTS MARKET, BY TYPE, 2018–2022 (USD MILLION)
                                   TABLE 158 RUSSIA: MARKET, BY TYPE, 2023–2028 (USD MILLION)
             10.3.8 TURKEY
                       10.3.8.1 Growth in livestock production and intensive farming to increase demand
                                   TABLE 159 TURKEY: ANIMAL DISINFECTANTS MARKET, BY TYPE, 2018–2022 (USD MILLION)
                                   TABLE 160 TURKEY: MARKET, BY TYPE, 2023–2028 (USD MILLION)
             10.3.9 POLAND
                       10.3.9.1 Dairy production growth to increase demand
                                   TABLE 161 POLAND: ANIMAL DISINFECTANTS MARKET, BY TYPE, 2018–2022 (USD MILLION)
                                   TABLE 162 POLAND: MARKET, BY TYPE, 2023–2028 (USD MILLION)
             10.3.10 GREECE
                        10.3.10.1 Intensification of animal production to constitute significant part of Greece’s agricultural output
                                   TABLE 163 GREECE: ANIMAL DISINFECTANTS MARKET, BY TYPE, 2018–2022 (USD MILLION)
                                   TABLE 164 GREECE: MARKET, BY TYPE, 2023–2028 (USD MILLION)
             10.3.11 NETHERLANDS                        10.3.11.1 Export of dairy and rearing of livestock to drive market
                                   TABLE 165 NETHERLANDS: ANIMAL DISINFECTANTS MARKET, BY TYPE, 2018–2022 (USD MILLION)
                                   TABLE 166 NETHERLANDS: MARKET, BY TYPE, 2023–2028 (USD MILLION)
             10.3.12 DENMARK
                        10.3.12.1 Denmark’s animal disinfectants market growth to be influenced by livestock and dairy sectors
                                   TABLE 167 DENMARK: ANIMAL DISINFECTANTS MARKET, BY TYPE, 2018–2022 (USD MILLION)
                                   TABLE 168 DENMARK: MARKET, BY TYPE, 2023–2028 (USD MILLION)
             10.3.13 UKRAINE
                        10.3.13.1 Ukraine’s intensive farming and pork production to influence growth of animal disinfectants
                                   TABLE 169 UKRAINE: ANIMAL DISINFECTANTS MARKET, BY TYPE, 2018–2022 (USD MILLION)
                                   TABLE 170 UKRAINE: MARKET, BY TYPE, 2023–2028 (USD MILLION)
             10.3.14 REST OF EUROPE
                                   TABLE 171 REST OF EUROPE: ANIMAL DISINFECTANTS MARKET, BY TYPE, 2018–2022 (USD MILLION)
                                   TABLE 172 REST OF EUROPE: MARKET, BY TYPE, 2023–2028 (USD MILLION)
     10.4 ASIA PACIFIC 
               FIGURE 52 ASIA PACIFIC: ANIMAL DISINFECTANTS MARKET SNAPSHOT
               FIGURE 53 CHINA TO GROW AT HIGHEST CAGR DURING FORECAST PERIOD
               TABLE 173 ASIA PACIFIC: ANIMAL DISINFECTANTS MARKET, BY COUNTRY, 2018–2022 (USD MILLION)
               TABLE 174 ASIA PACIFIC: MARKET, BY COUNTRY, 2023–2028 (USD MILLION)
               TABLE 175 ASIA PACIFIC: MARKET, BY TYPE, 2018–2022 (USD MILLION)
               TABLE 176 ASIA PACIFIC: MARKET, BY TYPE, 2023–2028 (USD MILLION)
               TABLE 177 ASIA PACIFIC: MARKET, BY TYPE, 2018–2022 (KT)
               TABLE 178 ASIA PACIFIC: MARKET, BY TYPE, 2023–2028 (KT)
               TABLE 179 ASIA PACIFIC: MARKET, BY APPLICATION, 2018–2022 (USD MILLION)
               TABLE 180 ASIA PACIFIC: MARKET, BY APPLICATION, 2023–2028 (USD MILLION)
               TABLE 181 ASIA PACIFIC: MARKET, BY FORM, 2018–2022 (USD MILLION)
               TABLE 182 ASIA PACIFIC: MARKET, BY FORM, 2023–2028 (USD MILLION)
             10.4.1 ASIA PACIFIC: RECESSION IMPACT ANALYSIS
                       FIGURE 54 ASIA PACIFIC: INFLATION RATES, BY KEY COUNTRY, 2017–2021
                       FIGURE 55 ASIA PACIFIC: RECESSION IMPACT ANALYSIS, 2022
             10.4.2 CHINA
                       10.4.2.1 Increase in meat supply to drive demand
                                   TABLE 183 CHINA: ANIMAL DISINFECTANTS MARKET, BY TYPE, 2018–2022 (USD MILLION)
                                   TABLE 184 CHINA: ANIMAL DISINFECTANTS MARKET, BY TYPE, 2023–2028 (USD MILLION)
             10.4.3 INDIA
                       10.4.3.1 Increased consumption of milk & meat to boost market
                                   TABLE 185 INDIA: ANIMAL DISINFECTANTS MARKET, BY TYPE, 2018–2022 (USD MILLION)
                                   TABLE 186 INDIA: ANIMAL DISINFECTANTS MARKET, BY TYPE, 2023–2028 (USD MILLION)
             10.4.4 JAPAN
                       10.4.4.1 Regulatory imposition on biosecurity measures to drive adoption of animal disinfectants
                                   TABLE 187 JAPAN: ANIMAL DISINFECTANTS MARKET, BY TYPE, 2018–2022 (USD MILLION)
                                   TABLE 188 JAPAN: MARKET, BY TYPE, 2023–2028 (USD MILLION)
             10.4.5 AUSTRALIA & NEW ZEALAND
                       10.4.5.1 Maintaining animal hygiene to increase export to drive demand for disinfectants in Australia & New Zealand
                                   TABLE 189 AUSTRALIA & NEW ZEALAND: ANIMAL DISINFECTANTS MARKET, BY TYPE, 2018–2022 (USD MILLION)
                                   TABLE 190 AUSTRALIA & NEW ZEALAND: MARKET, BY TYPE, 2023–2028 (USD MILLION)
             10.4.6 VIETNAM
                       10.4.6.1 Emergence of zoonotic disease to drive market in Vietnam
                                   TABLE 191 VIETNAM: ANIMAL DISINFECTANTS MARKET, BY TYPE, 2018–2022 (USD MILLION)
                                   TABLE 192 VIETNAM: MARKET, BY TYPE, 2023–2028 (USD MILLION)
             10.4.7 SOUTH KOREA
                       10.4.7.1 Increasing meat consumption to surge animal disinfectants market in South Korea
                                   TABLE 193 SOUTH KOREA: ANIMAL DISINFECTANTS MARKET, BY TYPE, 2018–2022 (USD MILLION)
                                   TABLE 194 SOUTH KOREA: MARKET, BY TYPE, 2023–2028 (USD MILLION)
             10.4.8 PHILIPPINES
                       10.4.8.1 Increasing poultry production to drive demand
                                   TABLE 195 PHILIPPINES: ANIMAL DISINFECTANTS MARKET, BY TYPE, 2018–2022 (USD MILLION)
                                   TABLE 196 PHILIPPINES: MARKET, BY TYPE, 2023–2028 (USD MILLION)
             10.4.9 REST OF ASIA PACIFIC
                       TABLE 197 REST OF ASIA PACIFIC: ANIMAL DISINFECTANTS MARKET, BY TYPE, 2018–2022 (USD MILLION)
                       TABLE 198 REST OF ASIA PACIFIC: MARKET, BY TYPE, 2023–2028 (USD MILLION)
     10.5 SOUTH AMERICA 
             10.5.1 SOUTH AMERICA: RECESSION IMPACT ANALYSIS
                       FIGURE 56 SOUTH AMERICA: INFLATION RATES, BY KEY COUNTRY, 2017–2021
                       FIGURE 57 SOUTH AMERICA: RECESSION IMPACT ANALYSIS, 2022
                       FIGURE 58 SOUTH AMERICA: ANIMAL DISINFECTANTS MARKET, BY COUNTRY, 2023 VS. 2028
                       TABLE 199 SOUTH AMERICA: MARKET, BY COUNTRY, 2018–2022 (USD MILLION)
                       TABLE 200 SOUTH AMERICA: MARKET, BY COUNTRY, 2023–2028 (USD MILLION)
                       TABLE 201 SOUTH AMERICA: MARKET, BY TYPE, 2018–2022 (USD MILLION)
                       TABLE 202 SOUTH AMERICA: MARKET, BY TYPE, 2023–2028 (USD MILLION)
                       TABLE 203 SOUTH AMERICA: MARKET, BY TYPE, 2018–2022 (KT)
                       TABLE 204 SOUTH AMERICA: MARKET, BY TYPE, 2023–2028 (KT)
                       TABLE 205 SOUTH AMERICA: MARKET, BY APPLICATION, 2018–2022 (USD MILLION)
                       TABLE 206 SOUTH AMERICA: MARKET, BY APPLICATION, 2023–2028 (USD MILLION)
                       TABLE 207 SOUTH AMERICA: MARKET, BY FORM, 2018–2022 (USD MILLION)
                       TABLE 208 SOUTH AMERICA: MARKET, BY FORM, 2023–2028 (USD MILLION)
             10.5.2 BRAZIL
                       10.5.2.1 Increased exports of meat products to support disinfectant use
                                   TABLE 209 BRAZIL: ANIMAL DISINFECTANTS MARKET, BY TYPE, 2018–2022 (USD MILLION)
                                   TABLE 210 BRAZIL: MARKET, BY TYPE, 2023–2028 (USD MILLION)
             10.5.3 ARGENTINA
                       10.5.3.1 Increased demand for beef/cattle in Argentina to drive market
                                   TABLE 211 ARGENTINA: ANIMAL DISINFECTANTS MARKET, BY TYPE, 2018–2022 (USD MILLION)
                                   TABLE 212 ARGENTINA: MARKET, BY TYPE, 2023–2028 (USD MILLION)
             10.5.4 PERU
                       10.5.4.1 Government regulations on animal products import to influence market demand
                                   TABLE 213 PERU: ANIMAL DISINFECTANTS MARKET, BY TYPE, 2018–2022 (USD MILLION)
                                   TABLE 214 PERU: MARKET, BY TYPE, 2023–2028 (USD MILLION)
             10.5.5 CHILE
                       10.5.5.1 Prevalence of Fascioliasis in livestock to drive market demand
                                   TABLE 215 CHILE: ANIMAL DISINFECTANTS MARKET, BY TYPE, 2018–2022 (USD MILLION)
                                   TABLE 216 CHILE: MARKET, BY TYPE, 2023–2028 (USD MILLION)
             10.5.6 ECUADOR
                       10.5.6.1 Prevalence of foot & mouth disease and bovine brucellosis to drive demand of sodium hypochlorite and quaternary ammonium compounds-based disinfectants
                                   TABLE 217 ECUADOR: ANIMAL DISINFECTANTS MARKET, BY TYPE, 2018–2022 (USD MILLION)
                                   TABLE 218 ECUADOR: MARKET, BY TYPE, 2023–2028 (USD MILLION)
             10.5.7 REST OF SOUTH AMERICA
                       TABLE 219 REST OF SOUTH AMERICA: ANIMAL DISINFECTANTS MARKET, BY TYPE, 2018–2022 (USD MILLION)
                       TABLE 220 REST OF SOUTH AMERICA: MARKET, BY TYPE, 2023–2028 (USD MILLION)
     10.6 REST OF THE WORLD (ROW) 
             10.6.1 ROW: RECESSION IMPACT ANALYSIS
                       FIGURE 59 ROW: RECESSION IMPACT ANALYSIS, 2022
                       TABLE 221 ROW: ANIMAL DISINFECTANTS MARKET, BY REGION, 2018–2022 (USD MILLION)
                       TABLE 222 ROW: MARKET, BY REGION, 2023–2028 (USD MILLION)
                       TABLE 223 ROW: MARKET, BY TYPE, 2018–2022 (USD MILLION)
                       TABLE 224 ROW: MARKET, BY TYPE, 2023–2028 (USD MILLION)
                       TABLE 225 ROW: MARKET, BY TYPE, 2018–2022 (KT)
                       TABLE 226 ROW: MARKET, BY TYPE, 2023–2028 (KT)
                       TABLE 227 ROW: MARKET, BY APPLICATION, 2018–2022 (USD MILLION)
                       TABLE 228 ROW: MARKET, BY APPLICATION, 2023–2028 (USD MILLION)
                       TABLE 229 ROW: MARKET, BY FORM, 2018–2022 (USD MILLION)
                       TABLE 230 ROW: MARKET, BY FORM, 2023–2028 (USD MILLION)
             10.6.2 MIDDLE EAST
                       10.6.2.1 Flourishing tourism to boost demand
                                   TABLE 231 MIDDLE EAST: ANIMAL DISINFECTANTS MARKET, BY COUNTRY, 2018–2022 (USD MILLION)
                                   TABLE 232 MIDDLE EAST: MARKET, BY COUNTRY, 2023–2028 (USD MILLION)
                                   TABLE 233 MIDDLE EAST: MARKET, BY TYPE, 2018–2022 (USD MILLION)
                                   TABLE 234 MIDDLE EAST: MARKET, BY TYPE, 2023–2028 (USD MILLION)
             10.6.3 SAUDI ARABIA
                       10.6.3.1 Regulations and initiatives taken by government for animal health to augment demand
                                   TABLE 235 SAUDI ARABIA: ANIMAL DISINFECTANTS MARKET, BY TYPE, 2018–2022 (USD MILLION)
                                   TABLE 236 SAUDI ARABIA: MARKET, BY TYPE, 2023–2028 (USD MILLION)
             10.6.4 EGYPT
                       10.6.4.1 Increasing consumption of meat products to boost sales
                                   TABLE 237 EGYPT: ANIMAL DISINFECTANTS MARKET, BY TYPE, 2018–2022 (USD MILLION)
                                   TABLE 238 EGYPT: MARKET, BY TYPE, 2023–2028 (USD MILLION)
             10.6.5 REST OF MIDDLE EAST
                       10.6.5.1 Rising livestock production to bolster demand
                                   TABLE 239 REST OF MIDDLE EAST: ANIMAL DISINFECTANTS MARKET, BY TYPE, 2018–2022 (USD MILLION)
                                   TABLE 240 REST OF MIDDLE EAST: MARKET, BY TYPE, 2023–2028 (USD MILLION)
             10.6.6 AFRICA
                       10.6.6.1 Increasing livestock production to drive demand
                                   TABLE 241 AFRICA: ANIMAL DISINFECTANTS MARKET, BY TYPE, 2018–2022 (USD MILLION)
                                   TABLE 242 AFRICA: MARKET, BY TYPE, 2023–2028 (USD MILLION)
 
11 COMPETITIVE LANDSCAPE (Page No. - 268)
     11.1 OVERVIEW 
     11.2 MARKET SHARE ANALYSIS, 2022 
               TABLE 243 ANIMAL DISINFECTANTS MARKET: DEGREE OF COMPETITION
     11.3 STRATEGIES ADOPTED BY KEY PLAYERS 
               TABLE 244 STRATEGIES ADOPTED BY KEY ANIMAL DISINFECTANT MANUFACTURERS
     11.4 SEGMENTAL REVENUE ANALYSIS OF KEY PLAYERS 
               FIGURE 60 SEGMENTAL REVENUE ANALYSIS OF KEY PLAYERS, 2018–2022 (USD BILLION)
     11.5 COMPANY EVALUATION QUADRANT (KEY PLAYERS) 
             11.5.1 STARS
             11.5.2 EMERGING LEADERS
             11.5.3 PERVASIVE PLAYERS
             11.5.4 PARTICIPANTS
                       FIGURE 61 ANIMAL DISINFECTANTS MARKET: COMPANY EVALUATION QUADRANT, 2022 (KEY PLAYERS)
             11.5.5 PRODUCT FOOTPRINT
                       TABLE 245 COMPANY FOOTPRINT, BY APPLICATION
                       TABLE 246 COMPANY FOOTPRINT, BY FORM
                       TABLE 247 COMPANY FOOTPRINT, BY REGION
                       TABLE 248 OVERALL, COMPANY FOOTPRINT
     11.6 ANIMAL DISINFECTANTS MARKET: EVALUATION QUADRANT FOR STARTUPS/SMES, 2022 
             11.6.1 PROGRESSIVE COMPANIES
             11.6.2 STARTING BLOCKS
             11.6.3 RESPONSIVE COMPANIES
             11.6.4 DYNAMIC COMPANIES
                       FIGURE 62 ANIMAL DISINFECTANTS MARKET: COMPANY EVALUATION QUADRANT, 2022 (STARTUPS/SMES)
             11.6.5 COMPETITIVE BENCHMARKING OF KEY STARTUPS/SMES
                       TABLE 249 ANIMAL DISINFECTANTS MARKET: DETAILED LIST OF KEY STARTUPS/SMES
                       TABLE 250 ANIMAL DISINFECTANTS MARKET: COMPETITIVE BENCHMARKING OF KEY STARTUP/SMES
     11.7 COMPETITIVE SCENARIO 
             11.7.1 PRODUCT LAUNCHES
                       TABLE 251 ANIMAL DISINFECTANTS: PRODUCT LAUNCHES
             11.7.2 DEALS
                       TABLE 252 ANIMAL DISINFECTANTS: DEALS
             11.7.3 OTHERS
                       TABLE 253 ANIMAL DISINFECTANTS: OTHERS
 
12 COMPANY PROFILES (Page No. - 286)
(Business overview, Products/Solutions/Services offered, Recent Developments, MNM view)*
     12.1 KEY PLAYERS 
             12.1.1 NEOGEN CORPORATION
                       TABLE 254 NEOGEN CORPORATION: BUSINESS OVERVIEW
                       FIGURE 63 NEOGEN CORPORATION: COMPANY SNAPSHOT
                       TABLE 255 NEOGEN CORPORATION: PRODUCTS OFFERED
                       TABLE 256 NEOGEN CORPORATION: PRODUCT LAUNCHES
                       TABLE 257 NEOGEN CORPORATION: DEALS
             12.1.2 GEA GROUP
                       TABLE 258 GEA: BUSINESS OVERVIEW
                       FIGURE 64 GEA: COMPANY SNAPSHOT
                       TABLE 259 GEA: PRODUCTS OFFERED
                       TABLE 260 GEA: PRODUCT LAUNCHES
             12.1.3 LANXESS
                       TABLE 261 LANXESS: BUSINESS OVERVIEW
                       FIGURE 65 LANXESS: COMPANY SNAPSHOT
                       TABLE 262 LANXESS: PRODUCTS OFFERED
                       TABLE 263 LANXESS: DEALS
                       TABLE 264 LANXESS: OTHERS
             12.1.4 ZOETIS
                       TABLE 265 ZOETIS: BUSINESS OVERVIEW
                       FIGURE 66 ZOETIS: COMPANY SNAPSHOT
                       TABLE 266 ZOETIS: PRODUCTS OFFERED
                       TABLE 267 ZOETIS: DEALS
             12.1.5 SOLVAY
                       TABLE 268 SOLVAY: BUSINESS OVERVIEW
                       FIGURE 67 SOLVAY: COMPANY SNAPSHOT
                       TABLE 269 SOLVAY GROUP: PRODUCTS OFFERED
                       TABLE 270 SOLVAY GROUP: OTHERS
             12.1.6 STOCKMEIER GROUP
                       TABLE 271 STOCKMEIER GROUP: BUSINESS OVERVIEW
                       TABLE 272 STOCKMEIER GROUP: PRODUCTS OFFERED
                       TABLE 273 STOCKMEIER GROUP: DEALS
             12.1.7 KERSIA GROUP
                       TABLE 274 KERSIA GROUP: BUSINESS OVERVIEW
                       TABLE 275 KERSIA GROUP: PRODUCTS OFFERED
                       TABLE 276 KERSIA GROUP: PRODUCT LAUNCHES
                       TABLE 277 KERSIA GROUP: DEALS
             12.1.8 ECOLAB
                       TABLE 278 ECOLAB: BUSINESS OVERVIEW
                       FIGURE 68 ECOLAB: COMPANY SNAPSHOT
                       TABLE 279 ECOLAB: PRODUCT OFFERINGS
                       TABLE 280 ECOLAB: DEALS
             12.1.9 ALBERT KERBL GMBH
                       TABLE 281 ALBERT KERBL GMBH: BUSINESS OVERVIEW
                       TABLE 282 ALBERT KERBL GMBH: PRODUCTS OFFERED
             12.1.10 PCC GROUP
                       TABLE 283 PCC GROUP: BUSINESS OVERVIEW
                       TABLE 284 PCC GROUP: PRODUCTS OFFERED
                       TABLE 285 PCC GROUPS: DEALS
             12.1.11 G SHEPHERD ANIMAL HEALTH
                       TABLE 286 G SHEPHERD ANIMAL HEALTH: BUSINESS OVERVIEW
                       TABLE 287 G SHEPHERD ANIMAL HEALTH: PRODUCTS OFFERED
             12.1.12 SANOSIL AG
                       TABLE 288 SANOSIL AG: BUSINESS OVERVIEW
                       TABLE 289 SANOSIL AG: PRODUCTS OFFERED
             12.1.13 DELAVAL INC.
                       TABLE 290 DELAVAL INC.: BUSINESS OVERVIEW
                       TABLE 291 DELAVAL INC.: PRODUCT OFFERINGS
             12.1.14 DIVERSEY HOLDINGS LTD.
                       TABLE 292 DIVERSEY HOLDINGS LTD.: BUSINESS OVERVIEW
                       TABLE 293 DIVERSEY HOLDINGS LTD.: PRODUCT OFFERINGS
                       TABLE 294 DIVERSEY HOLDINGS LTD.: DEALS
             12.1.15 FINK TEC GMBH
                       TABLE 295 FINK TEC GMBH: BUSINESS OVERVIEW
                       TABLE 296 FINK TEC GMBH: PRODUCTS OFFERED
     12.2 OTHER PLAYERS/STARTUPS/SMES 
             12.2.1 EVANS VANODINE INTERNATIONAL PLC
                       TABLE 297 EVANS VANODINE INTERNATIONAL PLC: BUSINESS OVERVIEW
                       TABLE 298 EVANS VANODINE INTERNATIONAL PLC: PRODUCTS OFFERED
             12.2.2 VIRBAC
                       TABLE 299 VIRBAC: BUSINESS OVERVIEW
                       TABLE 300 VIRBAC: PRODUCTS OFFERED
             12.2.3 VIROX ANIMAL HEALTH
                       TABLE 301 VIROX ANIMAL HEALTH: BUSINESS OVERVIEW
                       TABLE 302 VIROX ANIMAL HEALTH: PRODUCTS OFFERED
             12.2.4 KEMIN INDUSTRIES
             12.2.5 ASHISH LIFE SCIENCE
             12.2.6 SUNWAYS BIOSCIENCE LLP
             12.2.7 ZELENCE INDUSTRIES PRIVATE LIMITED
             12.2.8 CREST AQUA TECH
             12.2.9 ADVACARE PHARMA
             12.2.10 ACURO ORGANICS LTD
*Details on Business overview, Products/Solutions/Services offered, Recent Developments, MNM view might not be captured in case of unlisted companies.
 
13 ADJACENT & RELATED MARKETS (Page No. - 335)
     13.1 INTRODUCTION 
     13.2 FOOD DISINFECTANTS MARKET 
             13.2.1 LIMITATIONS
             13.2.2 MARKET DEFINITION
             13.2.3 MARKET OVERVIEW
             13.2.4 FOOD DISINFECTANTS MARKET, BY CHEMICAL TYPE
                       TABLE 303 FOOD DISINFECTANTS MARKET SIZE, BY CHEMICAL TYPE, 2018–2025 (USD MILLION)
                       TABLE 304 FOOD DISINFECTANTS MARKET SIZE, BY CHEMICAL TYPE, 2018–2025 (USD MILLION)
             13.2.5 FOOD DISINFECTANTS MARKET, BY REGION
                       TABLE 305 FOOD DISINFECTION MARKET SIZE, BY REGION, 2018–2025 (USD MILLION)
     13.3 AGRICULTURAL DISINFECTANTS MARKET 
             13.3.1 LIMITATIONS
             13.3.2 MARKET DEFINITION
             13.3.3 MARKET OVERVIEW
             13.3.4 AGRICULTURAL DISINFECTANTS MARKET, BY PRODUCT
                       TABLE 306 AGRICULTURAL DISINFECTANTS MARKET SIZE, BY TYPE, 2014–2021 (USD MILLION)
             13.3.5 AGRICULTURAL DISINFECTANTS MARKET, BY REGION
                       TABLE 307 AGRICULTURAL DISINFECTANTS MARKET SIZE, BY REGION, 2014–2021 (USD MILLION)
 
14 APPENDIX (Page No. - 340)
     14.1 DISCUSSION GUIDE 
     14.2 KNOWLEDGESTORE: MARKETSANDMARKETS’ SUBSCRIPTION PORTAL 
     14.3 CUSTOMIZATION OPTIONS 
     14.4 RELATED REPORTS 
     14.5 AUTHOR DETAILS 

This research involves the extensive use of secondary sources; directories; and databases (Bloomberg and Factiva) to identify and collect information useful for a technical, market-oriented, and commercial study of the animal disinfectants market. In-depth interviews were conducted with various primary respondents, such as key industry participants, Subject Matter Experts (SMEs), C-level executives of key market players, and industry consultants, to obtain and verify critical qualitative and quantitative information and to assess prospects.

Secondary Research

In the secondary research process, various sources, such as the United States Department of Agriculture (USDA), Canadian Council on Animal Care (CCAC), Animal welfare legislation, Animal Health Europe, European Commission, The Veterinary Medicines Directorate (VMD), The Ministry of Agriculture (MOA), Animal welfare in Japan, Australian Pesticides and Veterinary Medicines Authority, Animal Welfare Board of India, and Veterinary Health & Control Division were referred to identify and collect information for this study. The secondary sources also include journals, press releases, investor presentations of companies, whitepapers, certified publications, articles by recognized authors and regulatory bodies, trade directories, and paid databases.

Primary Research

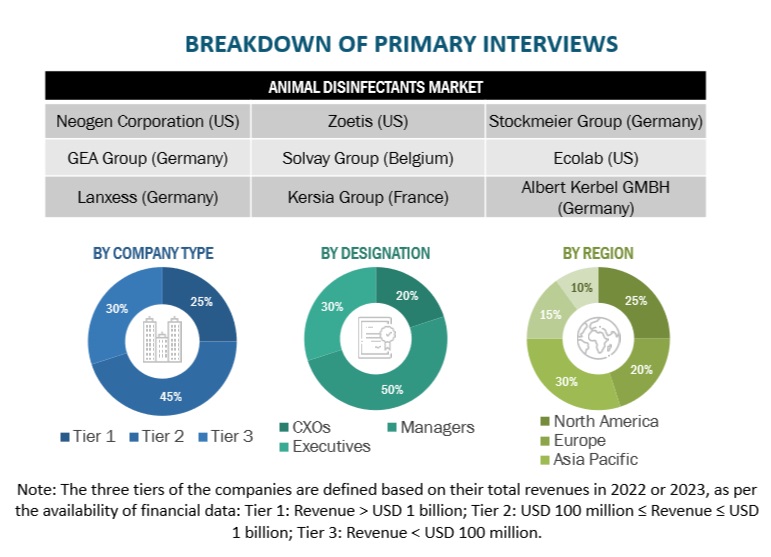
The animal disinfectants market comprises several stakeholders, including animal disinfectants manufacturers, distributers, and regulatory organizations in the supply chain. Various primary sources from both the supply and demand sides of the market were interviewed to obtain qualitative and quantitative information. Primary interviewees from the supply side include research institutions involved in R&D to introduce technology, animal disinfectants manufacturers, and technology providers. Primary sources from the demand-side include key opinion leaders, executives, and vice presidents,   through questionnaires, emails, and telephonic interviews.

Animal Disinfectants Market  Size, and Share

To know about the assumptions considered for the study, download the pdf brochure

Animal Disinfectants Market Size Estimation

Both the top-down and bottom-up approaches have been used to estimate and validate the total size of the animal disinfectants market. These approaches have also been used extensively to determine the size of the various sub-segments in the market. The research methodology used to estimate the market size includes the following details:

  • The key players in the industry and market have been identified through extensive secondary research.
  • The animal disinfectants value chain and market size in terms of value have been determined through primary and secondary research.
  • All percentage shares, splits, and breakdowns were determined using secondary sources and verified through primary sources.
  • All macroeconomic and microeconomic factors affecting the growth of the animal disinfectants market were considered while estimating the market size.
  • All the possible parameters that affect the market covered in this research study have been accounted for, viewed in extensive detail, verified through primary research, and analyzed to obtain the final quantitative and qualitative data.

The following sections (bottom-up & top-down) depict the overall market size estimation process employed for this study.

Market size estimation: Bottom-up approach

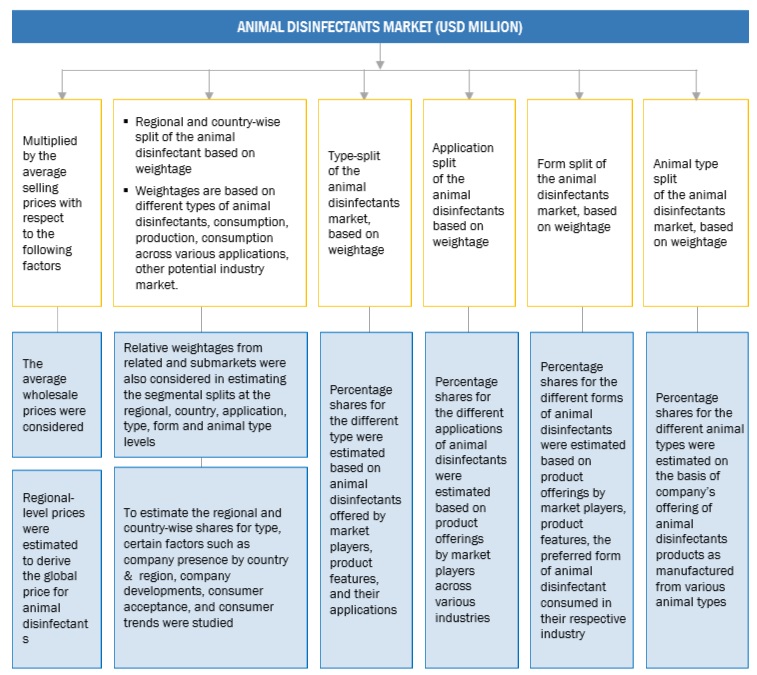
  • In the bottom-up approach, animal disinfectants for application, sample testing, technology, and region were added up to arrive at the global and regional market size and CAGR.
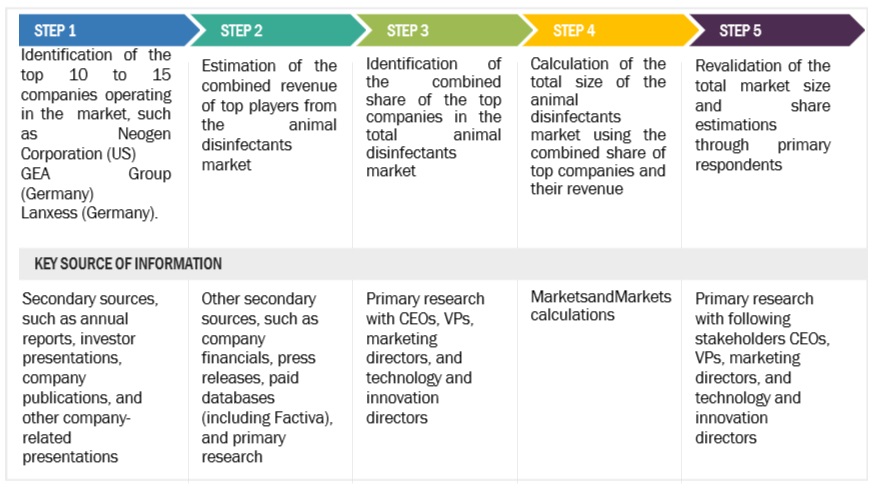
  • The bottom-up procedure has been employed to arrive at the overall size of the animal disinfectants market from the revenues of key players (companies) and their product share in the market.

Animal Disinfectants Market size estimation: Bottom-up Approach

Animal Disinfectants Market  Size, and Share

To know about the assumptions considered for the study, Request for Free Sample Report

Market size estimation methodology: Top-down Approach

For the calculation of each type of specific market segment, the most appropriate, immediate parent and peer market sizes were used for implementing the top-down procedure.

Secondary reports from various sources like company revenues, associations, and regulatory bodies were considered. Further, appropriate weightage was assigned to the data derived from each parameter to arrive at the final shares for each region. The regional demand-supply trends , and regulatory scenario were also analyzed to further validate the shares arrived at. These shares were then confirmed with primary respondents from across regions.

Animal Disinfectants Market  Size, and Share

Data Triangulation

After arriving at the overall market size from the estimation process explained above, the total market was split into several segments and subsegments. The data triangulation and market breakdown procedures were employed, wherever applicable, to estimate the overall animal disinfectants market and arrive at the exact statistics for all segments and subsegments. The data was triangulated by studying various factors and trends from the demand and supply sides. Along with this, the market size was validated using both the top-down and bottom-up approaches.

Market Definition

Animal disinfectants are specialized products formulated to eliminate harmful microorganisms and maintain hygiene in environments where animals are present. These disinfectants are designed to effectively kill bacteria, viruses, fungi, and other pathogens that can cause diseases in animals. They are commonly used in livestock facilities, veterinary clinics, animal shelters, and pet grooming centers. Animal disinfectants play a crucial role in preventing the spread of infections and ensuring the health and well-being of animals in various settings.

Key Stakeholders

  • Animal disinfectant manufacturers
  • Dairy, poultry, and livestock farms
  • Animal disinfectants’ importers and exporters
  • Intermediary suppliers such as traders and distributors of animal disinfectants
  • Government and research organizations
  • Associations and industry bodies:
    • Food and Agriculture Organization (FAO)
    • United States Department of Agriculture (USDA)
    • The United States Animal Health Association (USHA)
    • European Food Safety Authority (EFSA)
    • International Society for Animal Hygiene (ISAH)
    • Animal Health Europe
    • Indian Federation of Animal Health Companies (INFAH)
    • Organisation for Economic Co-operation and Development (OECD)
    • Brazilian Poultry Association and the Brazilian Chicken Producers and Exporters Association (UBABEF)
    • Animal Nutrition Association of Canada (ANAC)

Report Objectives

Market Intelligence

  • Determining and projecting the size of the global animal disinfectants market, with respect to based on sample, application, technology and regional markets, over a five-year period, ranging from 2023 to 2028
  • Identifying the attractive opportunities in the market by determining the largest and fastest-growing segments across regions
  • Providing detailed information about the key factors influencing the growth of the market (drivers, restraints, opportunities, and industry-specific challenges)
  • Providing the regulatory framework for major countries related to the animal disinfectants market.
  • Analyzing the micro markets, with respect to individual growth trends, prospects, and their contribution to the total market

Competitive Intelligence

  • Identifying and profiling the key players in the global animal disinfectants market
  • Providing a comparative analysis of market leaders on the basis of the following:
    • Product offerings
    • Business strategies
    • Strengths and weaknesses
    • Key financials
  • Understanding the competitive landscape and identifying the major growth strategies adopted by players across the key regions
  • Analyzing the value chain and products across the key regions and their impact on the prominent market players
  • Providing insights on key product innovations and investments in the global animal disinfectants market

Available Customizations:

With the given market data, MarketsandMarkets offers customizations according to company-specific scientific needs.

The following customization options are available for the report:

Product Analysis

  • Product Matrix, which gives a detailed comparison of the product portfolio of each company

Geographic Analysis

With the given market data, MarketsandMarkets offers customizations according to the company-specific scientific needs.

  • Further breakdown of the Rest of European animal disinfectants market, by key country

Company Information

  • Detailed analyses and profiling of additional market players
Custom Market Research Services

We will customize the research for you, in case the report listed above does not meet with your exact requirements. Our custom research will comprehensively cover the business information you require to help you arrive at strategic and profitable business decisions.

Request Customization

Instant Answers with GPT - Ask Now!

Ask real questions. Get complete answers !
Report Code
AGI 7261
Published ON
Jun, 2023
Choose License Type
BUY NOW
  • SHARE
X
Request Customization
Speak to Analyst
Speak to Analyst
OR FACE-TO-FACE MEETING
PERSONALIZE THIS RESEARCH
  • Triangulate with your Own Data
  • Get Data as per your Format and Definition
  • Gain a Deeper Dive on a Specific Application, Geography, Customer or Competitor
  • Any level of Personalization
REQUEST A FREE CUSTOMIZATION
LET US HELP YOU!
  • What are the Known and Unknown Adjacencies Impacting the Animal Disinfectants Market
  • What will your New Revenue Sources be?
  • Who will be your Top Customer; what will make them switch?
  • Defend your Market Share or Win Competitors
  • Get a Scorecard for Target Partners
CUSTOMIZED WORKSHOP REQUEST
+1-888-600-6441
  • Call Us
  • +1-888-600-6441 (Corporate office hours)
  • +1-888-600-6441 (US/Can toll free)
  • +44-800-368-9399 (UK office hours)
CONNECT WITH US
ABOUT TRUST ONLINE
©2024 MarketsandMarkets Research Private Ltd. All rights reserved
DMCA.com Protection Status Website Feedback