
Artificial Intelligence in Manufacturing Market Size, Share, Growth & Trends by Processor (MPUS, GPUs, FPGA, ASICs), Software (On-premises, Cloud), Technology (Machine Learning, NLP, Context-aware Computing, Computer Vision, Generative Al), Application - Global Forecast to 2030


Artificial Intelligence in Manufacturing Market SIZE, SHARE & TRENDS
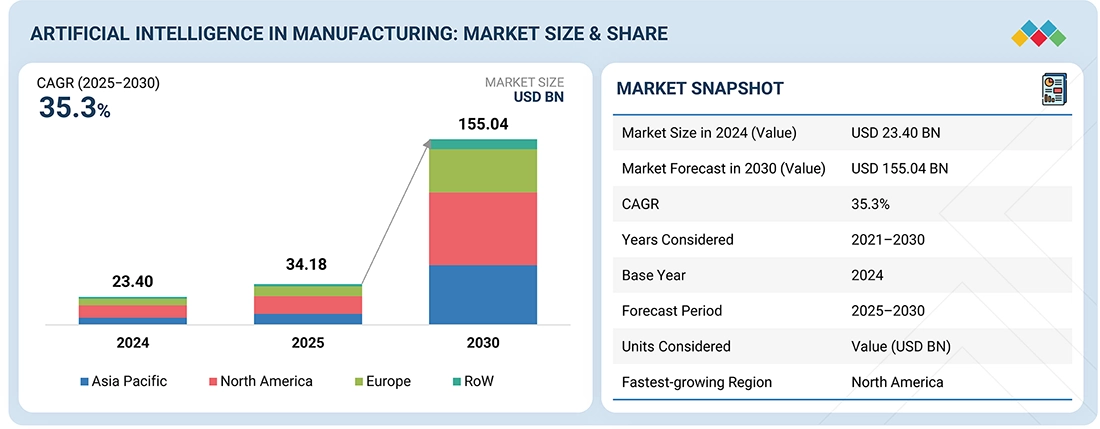
According to Marketsandmarkets, the global artificial intelligence (AI) in manufacturing market size was valued at USD 34.18 billion in 2025 and is projected to reach USD 155.04 billion by 2030, growing at a CAGR of 35.3% from 2025 to 2030. AI in manufacturing leverages machine learning, computer vision, and intelligent automation to optimize production processes, enhance quality control, and minimize downtime. Market growth is accelerated by the rapid adoption of smart factories, the integration of digital twin technology, and the rising demand for predictive and prescriptive analytics in sectors such as automotive, energy & power, electronics, and heavy machinery. Additionally, advancements in robotics and real-time data analytics enable manufacturers to achieve greater flexibility, sustainability, and operational resilience.
MARKET SNAPSHOT TABLE
| REPORT METRIC | DETAILS |
|---|---|
| Market Size in 2025 (Value) | USD 34.18 Billion |
| Market Forecast in 2030 (Value) | USD 155.04 Billion |
| Growth Rate | CAGR of 35.3% from 2025–2030 |
| Years Considered | 2021–2030 |
| Base Year | 2024 |
| Forecast Period | 2025–2030 |
| Units Considered | Value (USD Million/Billion) |
| Report Coverage | Revenue Forecast, Company Ranking, Competitive Landscape, Growth Factors, and Trends |
| Segments Covered |
|
| Regional Scope | North America, Europe, Asia Pacific, the Middle East, Latin America, and Africa |
| Top Companies |
|
| Growth Drivers |
|
Market Size & Forecast
KEY TAKEAWAYS
- The North America AI in manufacturing market accounted for a 43.1% revenue share in 2024.
- By offering, the services segment is expected to register the highest CAGR of 40.5%.
- By technology, the Generative AI segment is projected to grow at the fastest rate from 2025 to 2030.
- By industry, the automotive segment is expected to dominate the market.
- NVIDIA Corporation, Siemens, and IBM were identified as Star players in the AI in manufacturing market, as they have focused on innovation and have broad industry coverage and strong operational & financial strength.
- Ui Path, Automation Anywhere, Inc., have distinguished themselves among startups and SMEs due to their strong product portfolio and business strategy.
The artificial intelligence in manufacturing market size is set to expand significantly in the coming years, fueled by the growing emphasis on smart automation and the need to optimize production efficiency. The integration of AI-powered analytics, machine learning models, and real-time data processing transforms manufacturing operations, enabling improved quality control, reduced downtime, and enhanced flexibility, while also driving innovation and cost savings across industries.
Source: Secondary Research, Interviews with Experts, MarketsandMarkets Analysis
TRENDS & DISRUPTIONS IMPACTING CUSTOMERS' CUSTOMERS
The impact on consumers’ business in the artificial intelligence in manufacturing market growth is shaped by evolving industry dynamics and technological disruptions. Manufacturers across asset-intensive sectors are the primary adopters, with production efficiency, quality control, and automation representing key focus areas. Shifts such as the adoption of predictive analytics, smart factory initiatives, and stricter operational standards directly influence manufacturers’ profitability. These operational gains and compliance need, in turn, to accelerate demand for AI-driven systems and services, fueling the overall market growth.
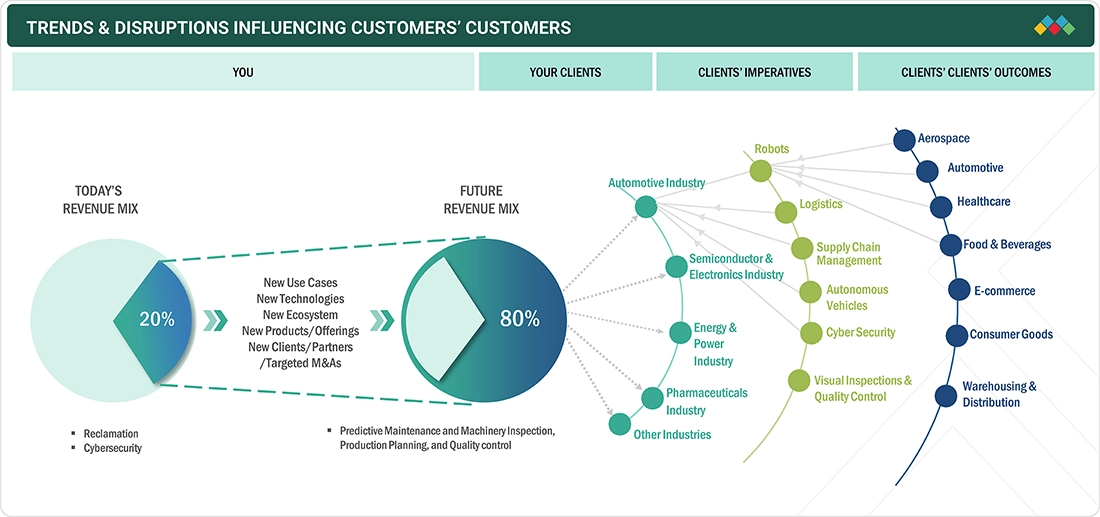
Source: Secondary Research, Interviews with Experts, MarketsandMarkets Analysis
MARKET DYNAMICS
Level
-
Increasing adoption of IIoT and connected devices across manufacturing plants

-
Growing inclination toward AI-enabled decision making in manufacturing

Level
-
Poor data integrity and data availability gaps in legacy systems

-
Barriers to enterprise-wide AI deployment in manufacturing

Level
-
Emerging trend of managing global plants remotely with AI

-
Shifting focus from mass production to smart customization

Level
-
Complexities in aligning AI output with dynamic manufacturing environments

-
Sustaining AI accuracy in dynamic production environments

Source: Secondary Research, Interviews with Experts, MarketsandMarkets Analysis
Driver: Increasing adoption of IIoT and connected devices across manufacturing plants
The rising adoption of IIoT and connected devices is revolutionizing manufacturing by enabling real-time data capture, predictive insights, and seamless system integration. This connectivity drives operational efficiency, minimizes downtime, and supports informed decision-making across production processes. By leveraging AI in these intelligent, interconnected environments, manufacturers can optimize resource utilization, enhance productivity, and maintain a competitive edge in an increasingly digital and data-driven industrial landscape.
Restraint: Poor data integrity and data availability gaps in legacy systems
Legacy manufacturing systems often suffer from fragmented or incomplete data, limiting the effectiveness of AI-driven insights. Poor data quality and availability gaps impede predictive analytics, process optimization, and real-time decision-making. Integrating AI into such environments becomes challenging, requiring significant investments in data cleansing, system upgrades, and connectivity enhancements to ensure actionable intelligence and reliable operational outcomes.
Opportunity: Shifting focus from mass production to smart customization
The evolving market demand for personalized products presents a strategic opportunity for AI adoption in manufacturing. By leveraging intelligent analytics, manufacturers can move beyond traditional mass production to deliver flexible, customized outputs efficiently. AI enables dynamic production planning, adaptive resource allocation, and real-time quality control, allowing organizations to meet diverse customer preferences while optimizing costs and maintaining high throughput in increasingly competitive markets.
Challenge: Complexities in aligning AI output with dynamic manufacturing environments
Manufacturing environments are highly dynamic, with constantly changing production schedules, supply chains, and operational conditions. Aligning AI-driven recommendations with these fluid processes is complex, requiring continuous model updates, sensor integration, and system calibration. Ensuring that AI output remains accurate, actionable, and contextually relevant demands significant technical expertise, robust data frameworks, and cross-functional collaboration across engineering, IT, and operations teams.
Artificial Intelligence in Manufacturing Market Share: COMMERCIAL USE CASES ACROSS INDUSTRIES
| COMPANY | USE CASE DESCRIPTION | BENEFITS |
|---|---|---|
 |
Transitioned from inefficient manual inspections to GE Vernova’s risk-based operational monitoring system for improved asset visibility | Improved monitoring efficiency | Reduced risks, prevented shutdowns | Saved USD 1M | Enabled proactive high-quality maintenance recommendations |
 |
Implemented AI-guided assistant to simplify connector selection, automate prototyping, and accelerate design using Microsoft Azure and Siemens tools | Reduced configuration time 95% | Enabled instant prototyping | Improved sales efficiency | Boosted innovation by freeing engineers for high-value tasks |
 |
Adopted Siemens NX CAM and digital tools to automate CNC operations, standardize processes, and improve collaboration across teams | Reduced scrap rate below 1% | Boosted productivity | Accelerated design cycles | Improved accuracy | Optimized skilled labor utilization |
 |
Mitsubishi Motors Corporation partnered with IBM Consulting to implement SAP S/4HANA, modernize core processes, integrate operations, and enhance real-time decision-making | Reduced inefficiencies | Automated workflows | Improved visibility | Enhanced collaboration | Boosted scalability | Strengthened long-term competitive growth potential |
 |
Shell International B.V. partnered with C3.ai to deploy predictive maintenance, using ML models on 10,000+ assets with Azure-based analytics pipelines | Generated 15M daily predictions | Reduced downtime | Improved safety | Saved millions | Optimized reliability | Supported net-zero 2050 goals |
Logos and trademarks shown above are the property of their respective owners. Their use here is for informational and illustrative purposes only.
MARKET ECOSYSTEM
The artificial intelligence in manufacturing ecosystem is rapidly transforming the industry by integrating cutting-edge hardware, powerful software platforms, and specialized services. AI hardware providers deliver the high-performance computing backbone, while Al software providers enable real-time insights, automation, and predictive capabilities. Backed by AI service providers, manufacturers gain end-to-end solutions that unlock efficiency, reduce downtime, and accelerate digital transformation. This ecosystem positions Al as a game-changer for driving competitiveness and sustainable growth in the manufacturing market.
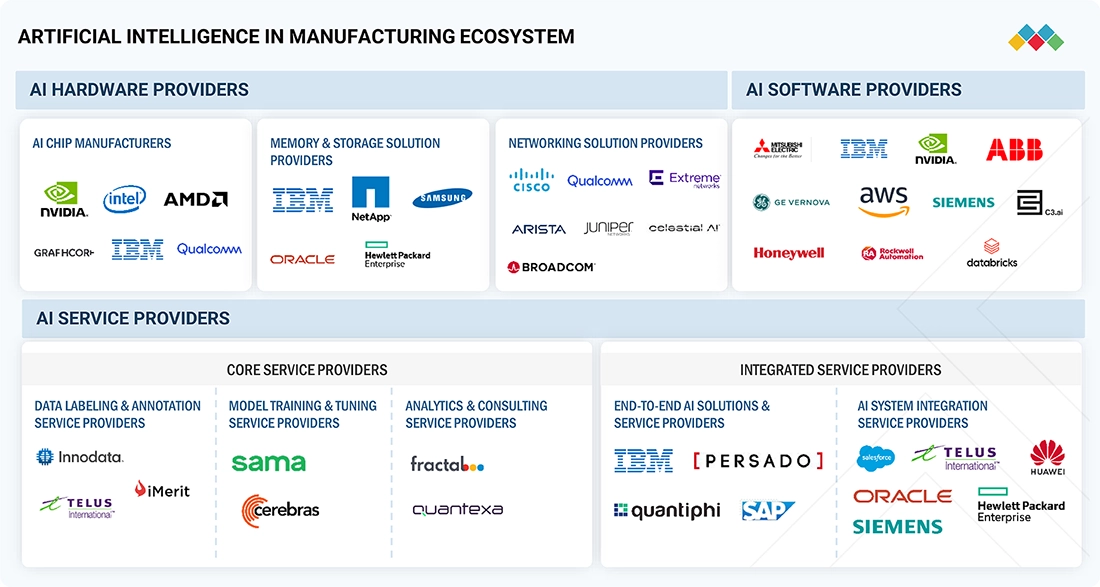
Logos and trademarks shown above are the property of their respective owners. Their use here is for informational and illustrative purposes only.
MARKET SEGMENTS

Source: Secondary Research, Interviews with Experts, MarketsandMarkets Analysis
Artificial Intelligence in Manufacturing Market, By Offering
The software segment held the largest share in 2024, as advanced analytics, machine learning models, and predictive maintenance platforms form the core of the market. Their ability to transform raw operational data into actionable insights drives adoption across industries. Continuous innovations in AI algorithms, cloud integration, and real-time data processing further strengthen the software segment’s dominance in optimizing manufacturing efficiency and decision-making.
Artificial Intelligence in Manufacturing Market, By Technology
The machine learning segment held a leading share in 2024, as ML algorithms enable predictive analytics, anomaly detection, and adaptive process optimization in manufacturing. By learning from historical and real-time operational data, machine learning drives smarter decision-making, reduces downtime, and enhances production efficiency. Continuous advancements in ML model accuracy, scalability, and integration with IoT and AI platforms further reinforce their dominance across industries.
Artificial Intelligence in Manufacturing Market, By Application
The predictive maintenance and machinery inspection segment held the largest share in 2024, driven by the need to minimize unplanned downtime and optimize equipment performance. AI-powered monitoring and analytics enable early detection, real-time condition assessment, and actionable insights, helping manufacturers extend asset life, reduce maintenance costs, and improve overall operational efficiency across industries.
Artificial Intelligence in Manufacturing Market, By Industry
The automotive industry is a key adopter of AI in manufacturing, leveraging intelligent automation, predictive maintenance, and quality inspection solutions to enhance production efficiency and reduce defects. AI-driven analytics and robotics enable streamlined assembly lines, optimized supply chains, and faster innovation cycles, helping manufacturers meet growing consumer demand and maintain competitiveness in a rapidly evolving market.
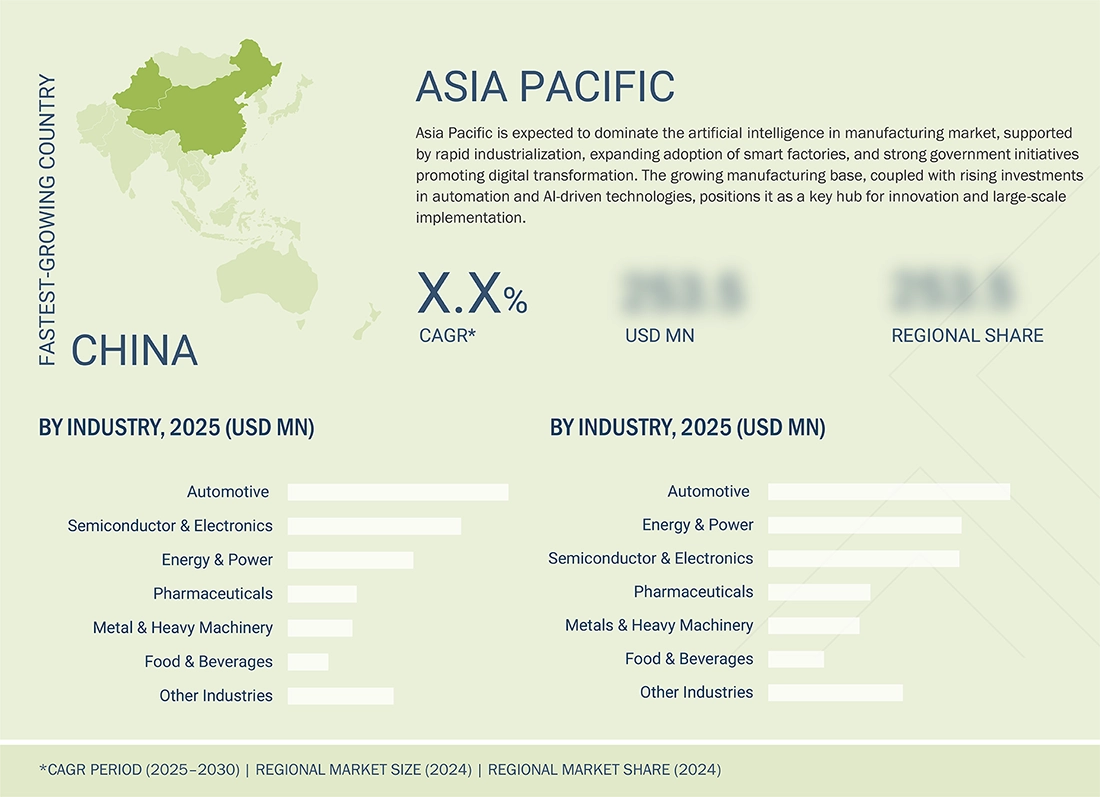
REGION
Asia Pacific to be the fastest-growing region in the global artificial intelligence in manufacturing market growth during the forecast period
Asia Pacific is set to surge with the highest CAGR in the artificial intelligence in manufacturing market, fueled by rapid industrial digitization, smart factory revolutions, and aggressive AI and IoT investments. Booming manufacturing hubs, proactive government initiatives, and rising demand for precision-engineered, customized products propel the region to the forefront of industrial transformation.
Artificial Intelligence in Manufacturing Market Trends: COMPANY EVALUATION MATRIX
In the artificial intelligence in manufacturing market matrix, NVIDIA Corporation (Star) holds a strong position with its advanced AI platforms, GPUs, and edge computing solutions, enabling real-time data processing, predictive maintenance, and process optimization across multiple industries. Siemens (Star) also leads with a comprehensive portfolio of industrial AI software, analytics tools, and automation solutions, delivering high operational efficiency and reliability. These companies drive widespread adoption of AI technologies by offering integrated solutions that enhance productivity, reduce downtime, and optimize manufacturing performance.
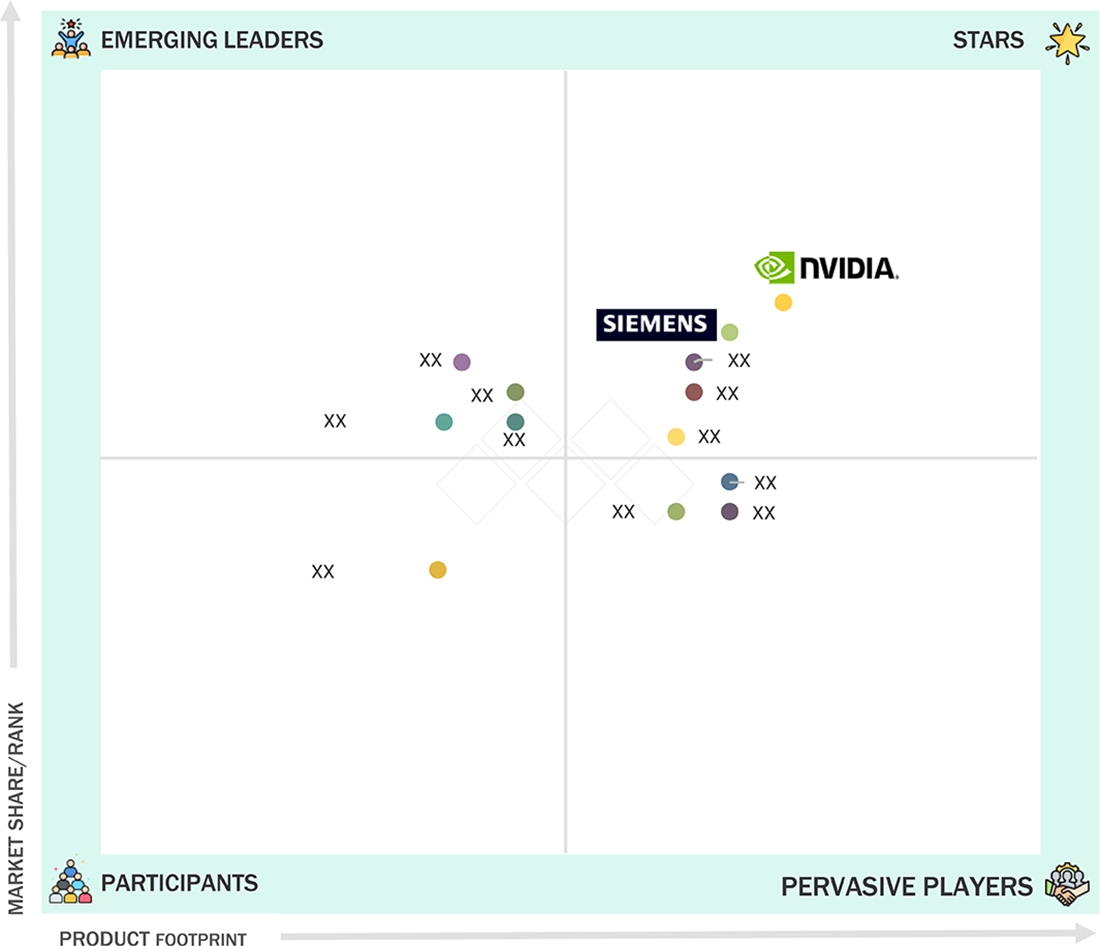
Source: Secondary Research, Interviews with Experts, MarketsandMarkets Analysis
WHAT IS IN IT FOR YOU: Artificial Intelligence in Manufacturing Market Growth REPORT CONTENT GUIDE
DELIVERED CUSTOMIZATIONS
We have successfully delivered the following deep-dive customizations:
| CLIENT REQUEST | CUSTOMIZATION DELIVERED | VALUE ADDS |
|---|---|---|
| Global AI Platform Provider | Trend analysis of AI adoption in automotive, aerospace, and electronics Identification of top manufacturing AI investment priorities Benchmarking regional AI policies and government support | Align offerings with industry investment priorities Unlock growth across multiple verticals Support compliance with local AI regulations Strengthen long-term scalability roadmap Build competitive edge through industry insights |
| Emerging AI Specialists | Benchmarking AI adoption in energy, utilities, and manufacturing sectors Case studies on AI for asset performance and predictive maintenance Evaluation of regional AI adoption trends (US, EU, and Asia Pacific) | Identify best-fit markets for expansion Enable scalable deployment planning Strengthen positioning in smart energy and industrial AI Build stronger partnerships with ecosystem players |
| Cross-Industry AI Solution Providers | Segmentation of AI demand across discrete, process, and hybrid manufacturing Competitive profiling of AI-first players vs. traditional automation vendors Case studies of successful AI implementation at scale | Sharpen customer targeting strategies Strengthen positioning against larger incumbents Identify fast-growth customer segments Enhance scalability planning |
RECENT DEVELOPMENTS
- July 2025 : IBM (US) launched its most advanced set of AI models, called Granite 3.0. These new models are designed to help businesses use AI more easily and cost-effectively across different operations. Granite 3.0 models can handle tasks such as summarizing information, answering questions, and sorting data, making them highly useful for improving efficiency and decision-making.
- December 2024 : NVIDIA Corporation (US) acquired AI startup Run:ai (Israel) for USD 700 million to enhance its AI workload optimization capabilities. This acquisition is expected to benefit the AI in manufacturing market by improving GPU resource efficiency and enabling smarter, more scalable deployment of AI applications across industrial operations.
- October 2024 : Siemens (Germany) announced the acquisition of Altair Engineering (US), a global leader in AI and simulation software, in a USD 10 billion deal. This move enhances Siemens' leadership in industrial software by adding powerful design, simulation, and data science tools to its portfolio. The acquisition is aimed at creating the most comprehensive AI-powered design and simulation platform, further strengthening Siemens Xcelerator’s digital capabilities. With Altair's technology, Siemens can offer manufacturers smarter product development, faster innovation cycles, and more efficient operations.
- October 2024 : Microsoft (US) and Siemens (Germany) announced a strategic collaboration to integrate Microsoft Azure OpenAI Service into Siemens’ industrial solutions. This partnership is aimed at accelerating AI-driven transformation across the industrial sector. By combining Siemens’ expertise in automation and manufacturing with Microsoft’s advanced AI capabilities, the collaboration enables businesses to access powerful cloud-based AI tools. These tools are designed to solve complex problems, increase productivity, and drive innovation, making industrial operations more intelligent, connected, and efficient.
- September 2024 : Intel Corporation (US) launched the Gaudi 3 AI Accelerator, a powerful chip designed to improve the efficiency of large-scale AI workloads. Built with high memory capacity and fast data transfer capabilities, Gaudi 3 is optimized to support leading AI tools and platforms. Its integration with IBM Cloud enhances performance and cost-efficiency, making it an attractive solution for enterprises seeking to scale their AI operations. This launch reinforces Intel’s commitment to advancing AI infrastructure and enabling smarter, faster, and more affordable AI computing across industries.
Table of Contents
 Exclusive indicates content/data unique to MarketsandMarkets and not available with any competitors.
Methodology
The study involved four major activities in estimating the current size of the AI in manufacturing market. Exhaustive secondary research has been conducted to gather information on the market, adjacent markets, and the overall AI in manufacturing landscape. These findings, assumptions, and projections were validated through primary research involving interviews with industry experts and key stakeholders across the value chain. Both top-down and bottom-up approaches were utilized to estimate the overall market size. Subsequently, market breakdown and data triangulation techniques were applied to determine the sizes of various segments and subsegments. Two key sources, secondary and primary, were leveraged to conduct a comprehensive technical and commercial assessment of the AI in manufacturing market.
Secondary Research
Various secondary sources have been referred to in the secondary research process to identify and collect important information for this study. The secondary sources include annual reports, press releases, and investor presentations of companies; white papers; journals and certified publications; and articles from recognized authors, websites, directories, and databases. Secondary research has been conducted to obtain key information about the industry’s supply chain, the market’s value chain, the total pool of key players, market segmentation according to the industry trends (to the bottom-most level), regional markets, and key developments from market- and technology-oriented perspectives. The secondary data has been collected and analyzed to determine the overall market size, and further validated by primary research.
Primary Research
Extensive primary research was conducted after gaining knowledge about the current scenario of the AI in manufacturing market through secondary research. Several primary interviews were conducted with experts from the demand and supply sides across four major regions—North America, Europe, Asia Pacific, and RoW. This primary data was collected through questionnaires, emails, and telephonic interviews.

Note: Other designations include sales and product managers and project engineers. The three tiers of the companies are defined based on their total revenue in 2024: Tier 1 - revenue ≥ USD 1 billion; Tier 2 - revenue USD 100 million–USD 1 billion; and Tier 3 - revenue < USD 100 million.
To know about the assumptions considered for the study, download the pdf brochure
Market Size Estimation
Both top-down and bottom-up approaches have been used to estimate and validate the total size of the AI in manufacturing market. These methods have also been used extensively to estimate the size of various subsegments on the market. The following research methodology has been used to estimate the market size:
- Major players in the industry and markets have been identified through extensive secondary research.
- The industry’s value chain and market size (in terms of value) have been determined through primary and secondary research processes.
- All percentage shares, splits, and breakdowns have been determined using secondary sources and verified through primary sources.
Artificial Intelligence in Manufacturing Market : Top-Down and Bottom-Up Approach

Data Triangulation
After arriving at the overall size of the AI in manufacturing market from the market size estimation process explained above, the total market has been split into several segments and subsegments. Data triangulation and market breakdown procedures have been employed, wherever applicable, to complete the overall market engineering process and arrive at the exact statistics for all segments and subsegments of the market. The data has been triangulated by studying various factors and trends from both the demand and supply sides. Along with this, the market size has been validated using both top-down and bottom-up approaches.
Market Definition
Artificial Intelligence (AI) in manufacturing refers to the use of advanced technologies that simulate human intelligence to analyze data, interact with machines, and carry out key processes. It enables functions such as material handling, equipment monitoring, quality checks, and self-diagnostics, tasks that traditionally required human labor or operator-assisted robotics, to be performed faster, more accurately, and at lower cost. By minimizing manual intervention and optimizing resources, AI improves productivity, reduces downtime, and enhances operational efficiency. As a result, it serves as a strategic driver of digital transformation, strengthening competitiveness and resilience in the global manufacturing sector.
Key Stakeholders
- Semiconductor companies
- Technology providers
- Universities and research organizations
- System integrators
- AI solution providers
- AI platform providers
- Cloud service providers
- AI system providers
- AI service providers
- Energy and power companies
- Automobile companies
- Aircraft companies
- Textile companies
- Heavy metal companies
- Food & beverage companies
- Packaging companies
- Pharmaceutical companies
- Manufacturing consulting companies
- Investors and venture capitalists
- Manufacturers implementing AI technology
Report Objectives
- To define, describe, and forecast the artificial intelligence (AI) in manufacturing market, in terms of value, based on offering, technology, application, and industry
- To describe and forecast the artificial intelligence in manufacturing market, in terms of value, based on region—North America, Europe, Asia Pacific, and Rest of the World (RoW)
- To provide detailed information on drivers, restraints, opportunities, and challenges influencing market growth
- To strategically analyze micromarkets with respect to individual growth trends, prospects, and contributions to the total market
- To provide information on patent analysis, technology analysis, pricing analysis, Porter’s Five Forces analysis, key stakeholders and buying criteria, key conferences and events, regulatory bodies, government agencies, and regulations pertaining to the market under study
- To analyze the probable impact of the recession on the market in the near future
- To study the complete value chain of the artificial intelligence in manufacturing ecosystem, along with market trends and case studies
- To profile key players and comprehensively analyze their market positions in terms of ranking and core competencies, along with detailing the competitive landscape for market leaders
- To analyze the competitive developments such as joint ventures, collaborations, agreements, contracts, partnerships, mergers & acquisitions, product launches, and research & development (R&D) in the artificial intelligence in manufacturing market
Customization Options
With the market data given, MarketsandMarkets offers customizations according to the company’s specific needs. The following customization options are available for the report:
Company Information
- Detailed analysis and profiling of additional market players (up to 5)
Key Questions Addressed by the Report
What is the current size of the global Artificial Intelligence (AI) in Manufacturing market?
The global AI in Manufacturing market is estimated at USD 34.18 billion in 2025 and is projected to reach USD 155.04 billion by 2030. (MarketsandMarkets)
What is the expected growth rate of the AI in Manufacturing market?
The market is expected to grow at a CAGR of 35.3% from 2025 to 2030, driven by increasing adoption of smart manufacturing technologies and Industry 4.0 initiatives. (MarketsandMarkets)
What are the key growth drivers for the AI in Manufacturing market?
Major growth drivers include the rapid expansion of Industrial IoT (IIoT), rising demand for predictive maintenance, increasing deployment of smart factories, adoption of digital twins, and the need for real-time production optimization. (PR Newswire)
Which industry segment holds the largest share of the AI in Manufacturing market?
The automotive industry is expected to dominate the market due to extensive use of AI for robotics, quality inspection, predictive maintenance, supply chain optimization, and autonomous manufacturing systems. (MarketsandMarkets)
Which technology segment is expected to grow the fastest?
Generative AI is projected to register the highest CAGR during the forecast period, driven by its applications in design optimization, process automation, simulation, and intelligent decision-making. (MarketsandMarkets)
Which region leads the global AI in Manufacturing market?
North America accounted for 43.1% of market revenue in 2024, supported by strong AI investments, advanced manufacturing infrastructure, and early adoption of industrial automation technologies. (MarketsandMarkets)
Which region is expected to experience the fastest growth?
Asia Pacific is forecast to record the highest CAGR through 2030, driven by rapid industrialization, smart factory deployments, government digitalization initiatives, and manufacturing growth in China, India, Japan, and South Korea. (MarketsandMarkets)
What are the major trends shaping the AI in Manufacturing industry?
Key trends include integration of AI with digital twins, deployment of edge AI and industrial IoT platforms, adoption of generative AI, AI-powered robotics, machine vision systems, and cloud-based manufacturing analytics. (MarketsandMarkets)
Who are the leading companies in the AI in Manufacturing market?
Major market participants include NVIDIA Corporation, Siemens AG, IBM Corporation, ABB Ltd., and Honeywell International Inc.. These companies provide AI-enabled automation, analytics, robotics, and industrial software solutions. (MarketsandMarkets)
What is the future outlook for the AI in Manufacturing industry?
The market outlook remains highly positive as manufacturers increasingly invest in intelligent automation, AI-powered quality control, predictive maintenance, sustainability initiatives, and autonomous production systems to improve operational efficiency


Anil
Apr, 2022
To understand potential of AI in manufacturing Industry. .