
Automated Stationary NDT & Inspection Systems Market Size, Share & Trends

Automated Stationary NDT & Inspection Systems Market Size, Share & Trends by in-line System Type, Ultrasonic Testing (UT), Phased Array Ultrasonic Testing (PAUT), Eddy Current Testing (ECT), Metals & Metallurgy, Rail, Oil & Gas, Aerospace - Global Forecast to 2030


AUTOMATED STATIONARY NDT & INSPECTION SYSTEMS MARKET SIZE, SHARE & TRENDS
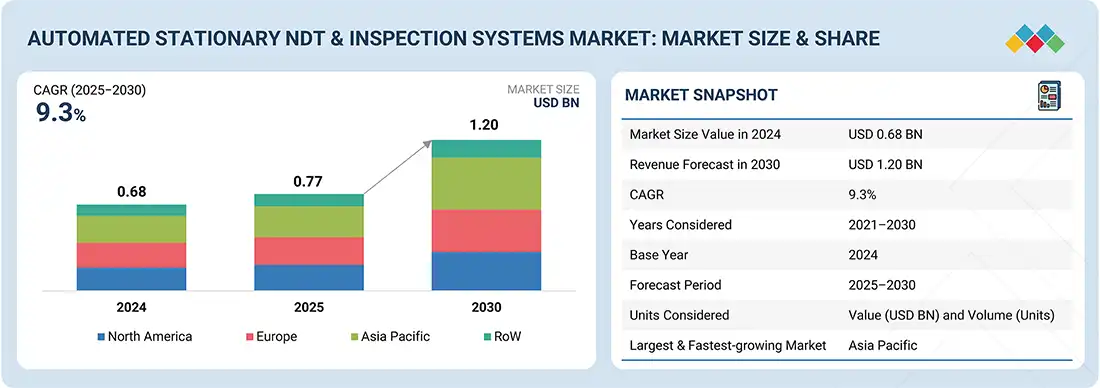
According to Marketsandmarkets, The global automated stationary NDT & inspection system market size was valued at USD 0.77 billion in 2025 and is projected to reach USD 1.20 billion by 2030, growing at a CAGR of 9.3% from 2025 to 2030. This is primarily driven by the rising demand for inline, real-time quality assurance across high-throughput production environments, along with stringent regulatory and safety compliance requirements. Industries are increasingly adopting automated inspection systems to enhance reliability, precision, and consistency in defect detection, while also extending the operational life of aging infrastructure. Government initiatives, such as the US Department of Energy’s modernization programs and the European Green Deal, further reinforce this momentum.
MARKET SNAPSHOT TABLE
| REPORT METRIC | DETAILS |
|---|---|
| Market Size in 2025 (Value) | USD 0.77 Billion |
| Market Forecast in 2030 (Value) | USD 1.20 Billion |
| Growth Rate | CAGR of 9.3% from 2025–2030 |
| Years Considered | 2021–2030 |
| Base Year | 2024 |
| Forecast Period | 2025-2030 |
| Units Considered | Value (USD Billion) and Volume (In Units) |
| Report Coverage | Revenue Forecast, Company Ranking, Competitive Landscape, Growth Factors, and Trends |
| Top Companies |
|
| Growth Drivers |
|
| Segments Covered | By System Type: Inline and Offline | By Technology: UT (Ultrasonic Testing), ECT (Eddy Current Testing), MFLT (Magnetic Flux Leakage Testing), VT (Visual Testing / Machine Vision Testing), and Other Technologies | By Vertical: Oil & Gas, Railway, Metal & Metallurgy, Aerospace, and Other Verticals |
| Regional Scope | North America, Asia Pacific, Europe, and Rest of the World (RoW) |
Market Size & Forecast
• 2025 Market Size: USD 0.77 Billion
• 2030 Projected Market Size: USD 1.20 Billion
• CAGR (2025-2030): 9.3%
• Inline segment: Highest CAGR
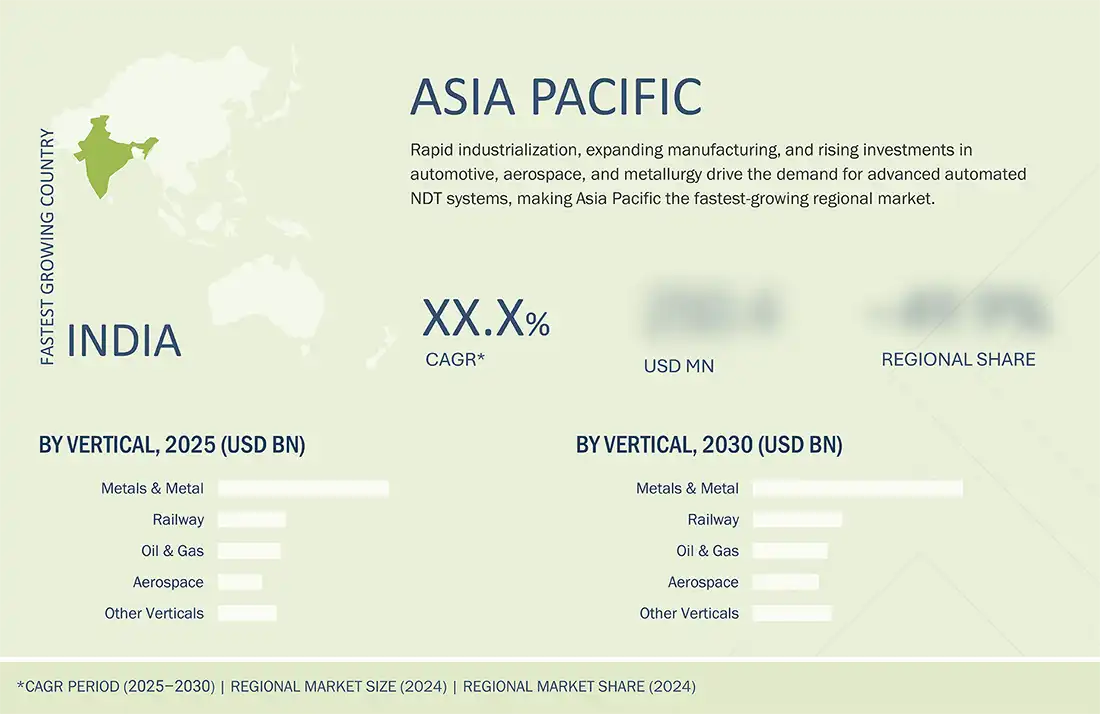
• Asia Pacific : Fastest growing market
KEY TAKEAWAYS
- The automated stationary NDT & inspection systems market in the Asia Pacific accounted for a 31.5% revenue share in 2024.
- By system type, the inline segment is expected to register the highest CAGR of 12.0%.
- By technology, the ultrasonic testing segment is expected to dominate the market with a market share of 45.7% in 2025
- By vertical, the aerospace sector will grow the fastest during the forecast period.
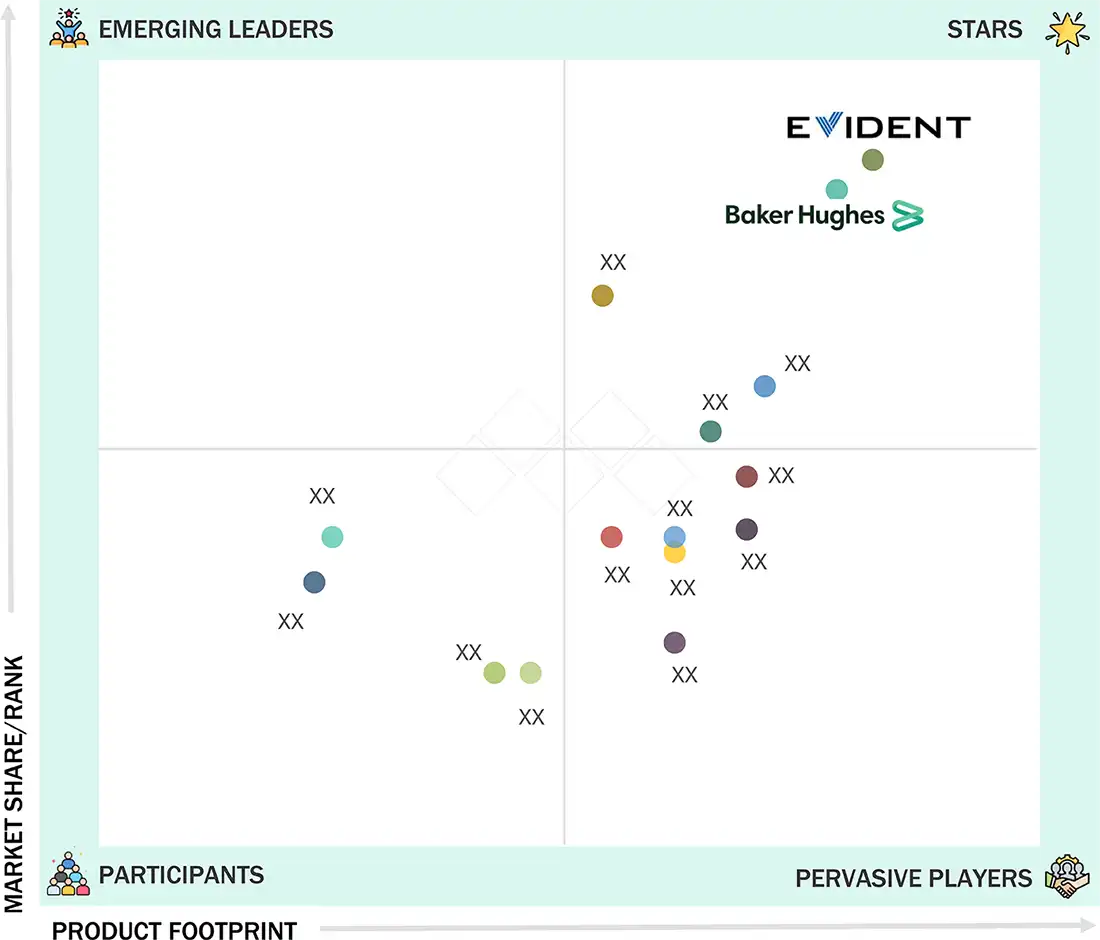
- Evident, Baker Hughes, Eddyfi, FOERSTER, and ScanMaster were identified as some of the star players in the vertical farming market (global), given their strong market share and product footprint.
- Inductosense, TiHive, voidsy, ThiaX, and Lumafield, among others, have distinguished themselves among startups and SMEs by securing strong footholds in specialized niche areas, underscoring their potential as emerging market leaders.
The automated stationary NDT & inspection systems industry is set to expand rapidly due to the rising demand for reliable, high-speed, and automated defect detection in critical industries, such as oil & gas, rail, aerospace, and metals. Advancements in ultrasonic, eddy current, magnetic flux leakage, and visual testing technologies enhance accuracy and efficiency. Increasing focus on asset integrity, regulatory compliance, and digitalization—AI and IoT integration—further supports broad industrial adoption.
Source: Secondary Research, Interviews with Experts, MarketsandMarkets Analysis
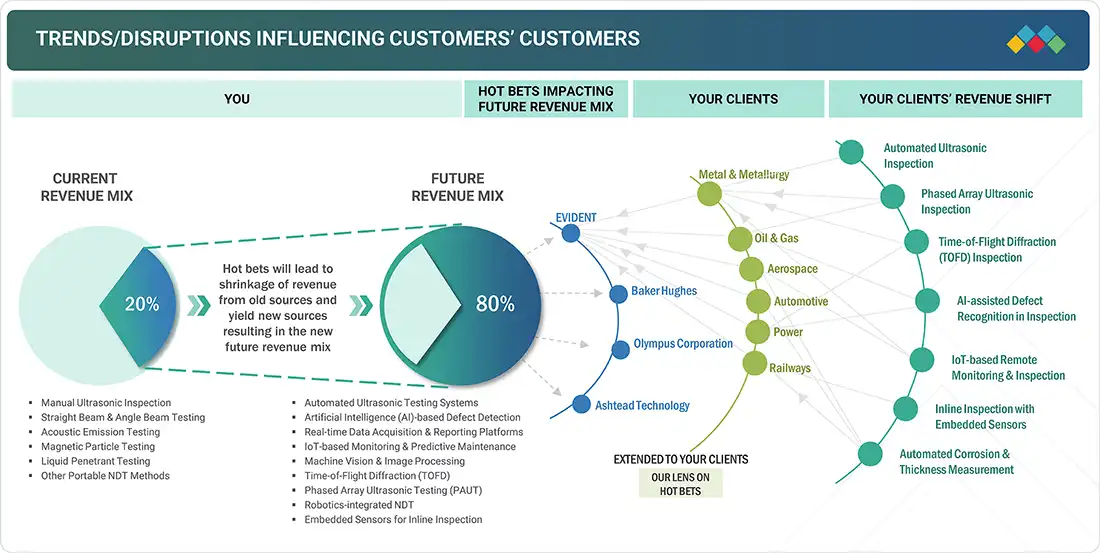
TRENDS & DISRUPTIONS IMPACTING CUSTOMERS' CUSTOMERS
The impact of customer buying behavior is reshaping revenue models as end users increasingly demand automation, precision, and predictive capabilities in NDT & inspection. Traditional methods, such as manual UT, MPT, and LPT, are giving way to advanced solutions, such as PAUT, TOFD, robotics-integrated NDT, and AI-driven defect recognition. This disruption creates new revenue streams for suppliers while driving efficiency, compliance, and safety improvements across oil & gas, aerospace, railways, and metals & metallurgy industries.
Source: Secondary Research, Interviews with Experts, MarketsandMarkets Analysis
AUTOMATED STATIONARY NDT & INSPECTION SYSTEMS MARKET DYNAMICS
Level
-
Growing adoption of real-time, inline automated stationary NDT systems

-
Compliance with evolving global safety and inspection standards

Level
-
High capital investments and long ROI cycles

-
Integration-related complexities associated with existing infrastructure

Level
-
Evolution of modular and multi-technology inspection platforms

-
Rapid industrialization and infrastructure growth across emerging economies

Level
-
Limited availability of field-proven use cases and integration expertise

-
Absence of standardized protocols and interfaces

Source: Secondary Research, Interviews with Experts, MarketsandMarkets Analysis
Driver: Growing adoption of real-time, inline automated stationary NDT systems
The adoption of real-time, inline automated stationary NDT systems is accelerating as industries demand faster, more accurate inspection without disrupting production. This shift improves efficiency, reduces downtime, and enhances defect detection accuracy, making such systems increasingly integral to high-volume sectors, such as metals, automotive, and oil & gas where continuous monitoring ensures quality and safety compliance.
Restraint: Integration-related complexities associated with existing infrastructure
Despite strong demand, integrating automated stationary NDT systems into existing production lines remains a challenge. Many facilities have legacy infrastructure that requires costly customization, downtime, and workforce retraining. These complexities slow deployment and discourage adoption, particularly among cost-sensitive industries, limiting the pace at which automation can fully replace manual and semi-automated inspection practices.
Opportunity: Evolution of modular and multi-technology inspection platforms
A major opportunity lies in the evolution of modular and multi-technology inspection platforms that combine UT, PAUT, ECT, and vision-based methods into single, flexible systems. These platforms reduce redundancy, enhance adaptability, and allow industries to scale inspection capabilities as needs evolve. This versatility supports multi-vertical adoption, creating strong growth potential in aerospace, railways, and metals, where diverse defect profiles must be addressed.
Challenge: Limited availability of field-proven use cases and integration expertise
The market faces challenges from a lack of field-proven case studies and limited integration expertise. End users remain cautious, often waiting for demonstrable ROI and performance validation before large-scale investments. Additionally, insufficiently skilled integrators slow adoption, particularly for complex deployments requiring multi-technology systems. Overcoming this barrier will be critical for unlocking broader confidence and accelerating the market’s transition to fully automated inspection.
Automated Stationary NDT & Inspection Systems Market: COMMERCIAL USE CASES ACROSS INDUSTRIES
| COMPANY | USE CASE DESCRIPTION | BENEFITS |
|---|---|---|
|
|
Automated phased array ultrasonic testing (PAUT) benches for aircraft composite structures | Detects micro-defects in carbon-fiber composites, ensures structural integrity, and reduces inspection time by 40% |
|
|
Inline ultrasonic testing systems for continuous steel plate and pipe production | 100% real-time defect detection, reduced scrap, compliance with global metallurgical safety standards |
|
|
Automated Magnetic Flux Leakage Testing (MFLT) for rail track inspection at manufacturing plants | Early detection of cracks and corrosion, improved passenger safety, and extended track lifecycle |
|
|
Stationary immersion UT systems for refinery piping and pressure vessel inspection | Prevents leakage/failure, improves operational safety, and reduces unplanned downtime |
|
|
Automated machine vision and laser-based VT systems for automotive welding line inspection | 100% inline weld quality checks, reduced recalls, and improved throughput and cost savings |
|
|
Automated PAUT/ECT systems for weld inspection in ship hulls and LNG storage tanks | Enhanced weld reliability, faster certification compliance, and reduced manual re-inspection |
Logos and trademarks shown above are the property of their respective owners. Their use here is for informational and illustrative purposes only.
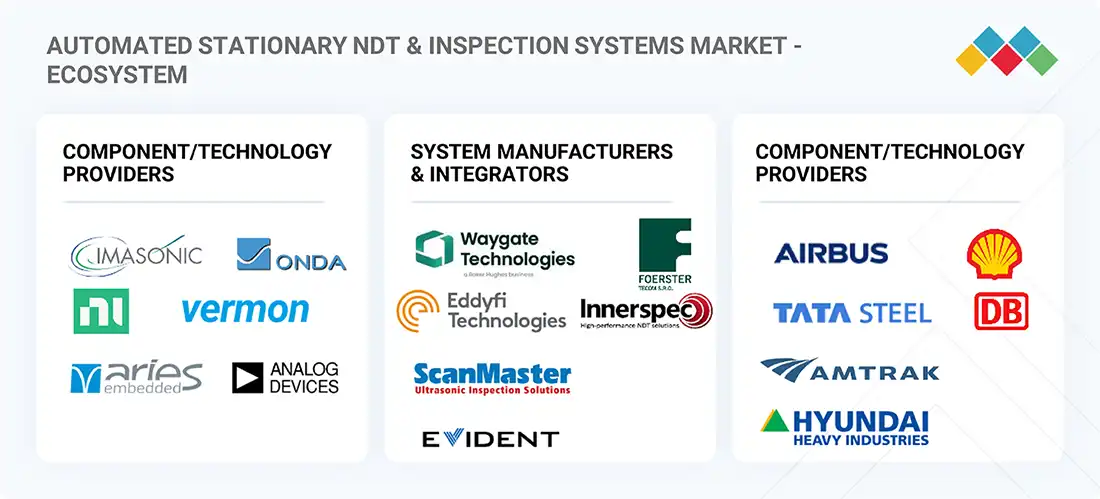
AUTOMATED STATIONARY NDT & INSPECTION SYSTEMS MARKET ECOSYSTEM
The automated stationary NDT & inspection system market comprises a dynamic ecosystem involving equipment manufacturers, such as Evident Scientific (Japan), Waygate Technologies (US), and Institut Dr. FOERSTER (Germany), alongside technology providers, such as Zetec (US), Eddyfi Technologies (Canada), and Magnetic Analysis Corporation (US). These firms collaborate with system integrators, service vendors, and end users in sectors such as aerospace and metallurgy to deliver tailored solutions. Regulatory bodies and standards organizations ensure safety and quality compliance, while supporting infrastructure—ranging from data analytics platforms to automation hardware—enables integration, innovation, and sustained market growth through cross-functional collaboration.
Logos and trademarks shown above are the property of their respective owners. Their use here is for informational and illustrative purposes only.
AUTOMATED STATIONARY NDT & INSPECTION SYSTEMS MARKET SEGMENTS
Source: Secondary Research, Interviews with Experts, MarketsandMarkets Analysis
Automated Stationary NDT & Inspection Systems Market, By System Type
Offline systems currently hold the largest market share in the automated stationary NDT & inspection systems market. These systems are extensively used for batch testing and high-precision inspections in industries such as aerospace, metals, and oil & gas, where production can be paused for detailed quality checks. While offline systems dominate today, inline systems are rapidly gaining traction due to their real-time defect detection, higher throughput, and process efficiency, aligning with Industry 4.0 and the shift toward continuous production monitoring.
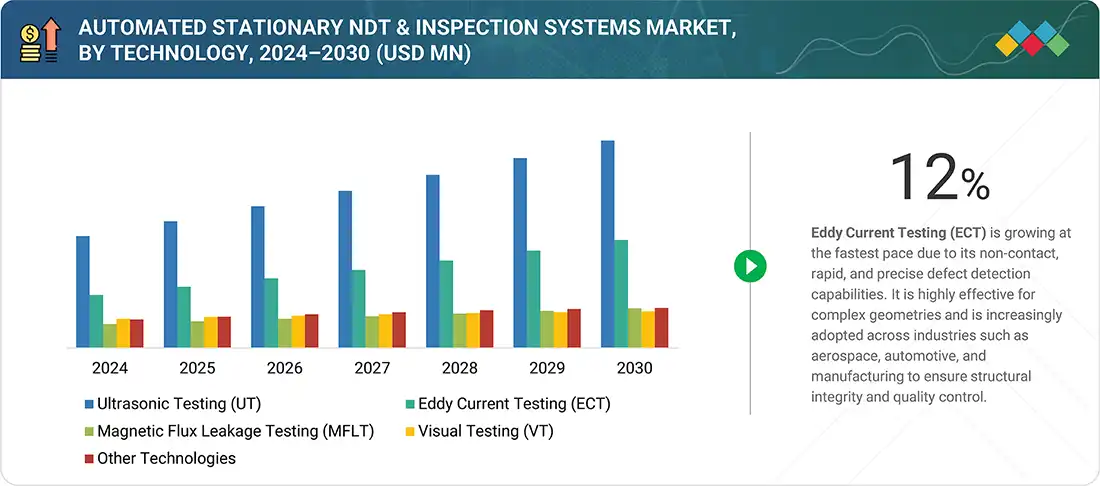
Automated Stationary NDT & Inspection Systems Market, By Technology
Ultrasonic testing (UT) accounts for the largest market share due to its versatility and reliability across multiple industries, including aerospace, automotive, and metallurgy. UT is widely adopted for flaw detection, thickness measurement, and weld inspections, making it essential for ensuring product quality and safety. While Eddy Current Testing (ECT) is the fastest-growing technology, favored for contactless and precise defect detection in complex geometries, it still trails UT. Other technologies such as MFLT and VT serve niche applications, supporting specialized inspection requirements.
Automated Stationary NDT & Inspection Systems Market, By Vertical
The metals & metallurgy sector holds the largest market share, driven by the need for consistent quality control, defect-free production, and compliance with global standards. This vertical relies heavily on automated inspection systems to ensure material integrity during high-volume manufacturing. Although smaller in size, aerospace is the fastest-growing vertical, fueled by rising use of advanced composites, strict safety regulations, and demand for precision inspections. Rail, oil & gas, and other industries are also expanding adoption, particularly for maintenance and safety compliance.
AUTOMATED STATIONARY NDT & INSPECTION SYSTEMS MARKET BY REGION
Asia Pacific is expected to be the fastest-growing region in the global automated stationary NDT & inspection systems market during the forecast period
Asia Pacific is projected to grow at the highest rate in the automated stationary NDT & inspection systems market growth.This growth is attributed to the rapid industrialization, the increasing investment in manufacturing, and the expansion of industries such as automotive, aerospace, and metals & metallurgy. Countries such as China, India, and Japan are leading the adoption of advanced inspection technologies to enhance product quality and meet global safety standards. Rising infrastructure projects and government initiatives supporting automation further accelerate demand across diverse industrial applications.
Automated Stationary NDT & Inspection Systems Market: COMPANY EVALUATION MATRIX
In the Automated Stationary NDT & Inspection Systems companies matrix, Evident and Baker Hughes stand out as Stars, with strong market presence and wide product portfolios that drive adoption across aerospace, oil & gas, and metals industries. Several vendors fall into the Pervasive Players category, reflecting solid offerings with moderate share, while Emerging Leaders show promising growth through innovative automated solutions, positioning themselves to advance toward the leaders’ quadrant in the coming years.
Source: Secondary Research, Interviews with Experts, MarketsandMarkets Analysis
KEY MARKET PLAYERS
- EVIDENT (Japan)
- Baker Hughes Company (US)
- Zetec, Inc. (US)
- Eddyfi (Canada)
- FOERSTER Holding GmbH (Germany)
- OKOndt Group (Ukraine)
- MME Group (Netherlands)
- Magnetic Analysis Corporation (US)
- Phoenix Inspection Systems Limited (Australia)
- Karl Deutsch (Germany)
- Nordinkraft AG (Germany)
- Innerspec Technologies Inc. (US)
- ScanMaster (Israel)
- CMS (France)
- Rohmann GmbH (Germany)
WHAT IS IN IT FOR YOU: Automated Stationary NDT & Inspection Systems Market REPORT CONTENT GUIDE
DELIVERED CUSTOMIZATIONS
We have successfully delivered the following deep-dive customizations:
| CLIENT REQUEST | CUSTOMIZATION DELIVERED | VALUE ADDS |
|---|---|---|
| UT System Manufacturer | • Market sizing & forecast for automated & semi-automated ultrasonic testing (UT) inspection systems • Technology benchmarking of phased-array UT vs. conventional UT solutions • Competitive landscape profiling of leading UT system integrators and OEMs | • Support product strategy for UT system portfolio • Identify high-growth end-use verticals (aerospace, metals, and oil & gas) • Highlight differentiation opportunities in semi-automated inspection |
| Railway Infrastructure Company | • Customer landscape mapping for rail track & rolling stock inspection • Benchmarking adoption of ultrasonic, eddy current, and visual testing systems • Analysis of regional/regulatory drivers for automated inspection in rail | • Improve operational reliability and safety • Identify cross-regional growth opportunities • Target partnerships for predictive maintenance |
| Metals & Metallurgy Plant | • Mapping of automated UT, EMAT, and laser-based testing adoption in steel & aluminum plants • Evaluation of switching barriers from manual to automated inspection • Competitor case studies on NDT system integration | • Support efficiency-driven modernization plans • Pinpoint ROI opportunities through automation • Enable targeting of high-volume and high-margin plants |
| Aerospace Manufacturer | • Patent & technology landscape for automated NDT in composites & turbine blades • Benchmarking of leading vendors (inline/offline solutions) • Adoption roadmaps for advanced VT and acoustic emission systems | • Support entry into high-spec aerospace programs • Identify OEM-driven adoption trends • Secure advantage in IP-backed innovation |
| Global NDT Equipment Supplier | • Global & regional capacity benchmarking of system suppliers • Pipeline of new product launches & technology upgrades • End-user demand profiling across oil & gas, rail, metals, and aerospace | • Strengthen long-term go-to-market strategy • Identify high-growth verticals and regions • Assess supply-demand gaps for competitive advantage |
RECENT DEVELOPMENTS
- June 2025 : Previan, a global industrial technology group specializing in advanced diagnostics for critical infrastructure, announced a strategic evolution under which Eddyfi Technologies and NDT Global would operate as fully independent business entities. This move enables each unit to pursue tailored leadership, financing, and growth strategies.
- March 2025 : Foerster GmbH&Co.KG, a global leader in NDT innovation, acquired Prüftechnik NDT GmbH (formerly part of Fluke Corporation) to significantly expand its technology portfolio and global footprint. The acquisition enabled Foerster to broaden its product and service offerings, tap into a wider expert network, and drive synergies across R&D and support operations.
- January 2025 : Wabtec Corporation acquired Evident’s Inspection Technologies division for USD 1.78 billion, enhancing its portfolio in digital non-destructive testing (NDT) and industrial inspection solutions.
- October 2024 : GE Aerospace and Waygate Technologies jointly developed an AI-assisted engine borescope to enhance defect detection accuracy and inspection speed in commercial jet engine maintenance.
- June 2024 : Waygate Technologies (Baker Hughes) launched the new Krautkrämer RotoArray ultrasonic system, designed for high-speed, precision inspection of cylindrical components in aerospace and automotive manufacturing.
Table of Contents
 Exclusive indicates content/data unique to MarketsandMarkets and not available with any competitors.
Methodology
The study involved major activities in estimating the current size of the automated stationary NDT & inspection systems market. Exhaustive secondary research has been done to collect information on the market, peer market, and parent market. To validate these findings, assumptions, and sizing with industry experts across the supply chain through primary research has been the next step. Both top-down and bottom-up approaches have been employed to estimate the complete market size. After that, market breakdown and data triangulation methods have been used to estimate the market size of segments and subsegments. Secondary and primary sources have been used to identify and collect information for an extensive technical and commercial study of the automated stationary NDT & inspection systems market.
Secondary Research
Various secondary sources have been referred to in the secondary research process to identify and collect information important for this study. The secondary sources include annual reports, press releases, and investor presentations of companies; white papers; journals and certified publications; and articles from recognized authors, websites, directories, and databases. Secondary research has been conducted to obtain key information about the industry’s supply chain, the market’s value chain, the total pool of key players, market segmentation according to the industry trends (to the bottom-most level), regional markets, and key developments from market- and technology-oriented perspectives. The secondary data has been collected and analyzed to determine the overall market size, further validated by primary research.
Primary Research
Extensive primary research was conducted after gaining knowledge about the current scenario of the automated stationary NDT & inspection systems market through secondary research. Several primary interviews were conducted with experts from the demand and supply sides across four major regions—North America, Europe, Asia Pacific, and RoW. This primary data was collected through questionnaires, emails, and telephonic interviews.

Note: RoW mainly comprises the Middle East & Africa (MEA) and South America.
Other designations include product managers, sales managers, and marketing managers.
Three tiers of companies have been defined based on their total revenue as of 2024; tier 3: Revenue less than USD 500 million; tier 2: Revenue between USD 500 million and 1 billion; and tier 1: Revenue more than USD 1 billion.
To know about the assumptions considered for the study, download the pdf brochure
Market Size Estimation
The bottom-up procedure has been employed to arrive at the overall size of the automated stationary NDT & inspection systems market.
- Collected financial data from individual equipment manufacturers and system integrators focused on automated stationary NDT & inspection systems
- Focused exclusively on revenues from fixed or installed inspection systems, excluding portable, handheld, and service-based revenues
- Estimated technology-specific revenues for systems based on Ultrasonic Testing (UT), Phased Array UT (PAUT), Eddy Current Testing (ECT), Magnetic Flux Leakage Testing (MFLT), Visual Testing (VT), Laser-based NDT, Acoustic Emission Testing, EMAT, and other emerging or hybrid NDT technologies
- Analyzed segment-wise revenue splits across key verticals such as oil & gas, rail, metals & metallurgy, aerospace, automotive, power generation, and other verticals
- Extracted product-level and vertical-specific revenue data from public company filings, investor reports, and direct disclosures
- Identified and mapped key market participants, including global OEMs, regional integrators, and specialized technology vendors across various NDT technologies and industry sectors
- Aggregated all data points to arrive at the total estimated market size for automated stationary NDT & inspection systems
The top-down approach has been used to estimate and validate the total size of the automated stationary NDT & inspection systems market.
- Assessed the overall NDT equipment market and filtered it to focus solely on the automated stationary NDT & inspection systems segment
- Segmented the market by key NDT technologies such as Ultrasonic Testing (UT), Phased Array UT (PAUT), Eddy Current Testing (ECT), Magnetic Flux Leakage Testing (MFLT), Visual Testing (VT), and other emerging methods
- Estimated market split by system type, differentiating between in-line and offline automated systems
- Calculated the share of each technology across major end-use verticals, including Metals & Metallurgy, Oil & Gas, Rail, Aerospace, Automotive, Power Generation, and others
- Mapped market size by region—North America, Europe, Asia Pacific, and Rest of the World (RoW)—for each technology and vertical
- Further refined estimates by analyzing the intra-regional share of countries within each broader geography
- Consolidated the above layers to derive the final market size and segmentation for the automated stationary NDT & inspection systems market
Automated Stationary NDT & Inspection Systems Market : Top-Down and Bottom-Up Approach

Data Triangulation
After arriving at the overall market size-using the market size estimation processes as explained above-the market has been split into several segments and subsegments. To complete the entire market engineering process and arrive at the exact statistics of each market segment and subsegment, data triangulation and market breakdown procedures have been employed, wherever applicable. The data has been triangulated by studying various factors and trends from the demand and supply sides in the automated stationary NDT & inspection systems market.
Market Definition
The Automated Stationary NDT (Non-Destructive Testing) & Inspection Systems encompasses permanently installed or fixed-position systems designed to evaluate the integrity, properties, or defects of materials and components without causing damage. These systems operate in-line or at fixed inspection stations within manufacturing, maintenance, or quality control environments. They utilize technologies such as Ultrasonic Testing (UT), Phased Array UT (PAUT), Eddy Current Testing (ECT), Magnetic Flux Leakage Testing (MFLT), Visual Testing (VT via machine vision), Laser-based NDT, Acoustic Emission Testing, Electromagnetic Acoustic Transducers (EMAT), and emerging hybrid methods. Unlike portable or manual inspection tools, automated stationary systems are integrated into production lines or test cells, enabling continuous, high-throughput, and repeatable inspection processes. These systems are used by equipment manufacturers and integrators (excluding NDT services) across critical industries such as Oil & Gas, Rail, Metals & Metallurgy, Aerospace, Automotive, General Manufacturing, Power Generation, and Marine. The market scope excludes radiography/CT, thermography, magnetic particle and penetrant testing, and handheld/manual inspection devices.
Key Stakeholders
- Equipment Manufacturers
- System Integrators
- Software & Analytics Providers
- Component & Sensor Suppliers
- End-use Industries
- Regulatory Bodies
- Standards Organizations
- Research Institutions
- Certification Bodies
- Distributors & Channel Partners
- Industry Associations
- Investors & Financial Institutions
- Automation & Robotics Providers
- Maintenance & Calibration Service Providers
Report Objectives
- To define, describe, and forecast the size of the automated stationary NDT & inspection systems market by technology, vertical, and system type, in terms of value
- To describe and forecast the market size for various segments concerning key regions, namely, North America, Europe, Asia Pacific, and RoW, in terms of value
- To provide detailed information regarding the key factors such as drivers, restraints, opportunities, and challenges influencing the growth of the market
- To understand and analyze the impact of evolving technologies on the overall supply chain of the automated stationary NDT & inspection systems market and upcoming trends in the ecosystem
- To provide macroeconomic outlooks with respect to the main geographies, namely, North America, Europe, Asia Pacific, and RoW
- To provide a detailed overview of the automated stationary NDT & inspection systems market, industry trends, and use cases
- To strategically analyze micromarkets for individual growth trends, prospects, and contributions to the total market
- To provide ecosystem analysis, trends/disruptions impacting customer business, case study analysis, ecosystem analysis, and Gen AI impact related to the automated stationary NDT & inspection systems market
- To analyze the opportunities in the market for stakeholders by identifying high-growth segments and detailing the competitive landscape for market players
- To profile the key players and comprehensively analyze their market position in terms of the market share and core competencies, along with a detailed competitive landscape for the market leaders
- To analyze the competitive developments, such as acquisitions, product launches, expansions, agreements, partnerships, and collaborations carried out by market players
Available customizations:
With the given market data, MarketsandMarkets offers customizations according to the company‘s specific needs. The following customization options are available for the report
Company Information
- Detailed analysis and profiling of additional market players (up to five)
Key Questions Addressed by the Report
What is the current size of the Automated Stationary NDT & Inspection Systems Market?
The global Automated Stationary NDT & Inspection Systems Market is estimated at around USD 0.77 billion in 2025 and is projected to reach approximately USD 1.20 billion by 2030.
What is the expected growth rate of the Automated Stationary NDT & Inspection Systems Market?
The market is expected to grow at a CAGR of 9.3% during 2025–2030 due to increasing demand for automated quality inspection and safety compliance.
What are the major growth drivers of the Automated Stationary NDT & Inspection Systems Market?
Key drivers include real-time inline inspection adoption, stringent safety standards, shortage of skilled inspectors, infrastructure modernization, and AI-based defect detection.
What are the key trends shaping the Automated Stationary NDT Market?
Major trends include AI/ML integration, machine vision inspection, multi-technology platforms, digitalization, and smart manufacturing adoption.
Which region dominates the Automated Stationary NDT & Inspection Systems Market?
Asia Pacific is a leading region, accounting for around 31.5% revenue share in 2024, supported by industrial growth and automation adoption.
Which technology segment holds the largest market share?
Ultrasonic Testing (UT) is expected to dominate the market with approximately 45.7% market share in 2025 due to high accuracy and broad industrial usage.
Which system type is expected to grow fastest?
The inline automated NDT system segment is expected to grow fastest, with around 12.0% CAGR during 2025–2030 due to continuous production-line inspection needs.
Which industries use automated stationary NDT inspection systems?
Major industries include metals & metallurgy, oil & gas, aerospace, railways, automotive, and manufacturing sectors for defect detection and quality assurance.
Who are the major companies in the Automated Stationary NDT & Inspection Systems Market?
Leading companies include Evident Corporation, Baker Hughes (Waygate Technologies), Eddyfi Technologies, Institut Dr. Foerster GmbH & Co. KG, and Magnetic Analysis Corporation.
What does the Automated Stationary NDT & Inspection Systems Market report analyze?
The report covers market size, forecast, system type, technologies such as UT and ECT, applications, industries, regional analysis, competitive landscape, trends, and growth opportunities through 2030.
Need a Tailored Report?
Customize this report to your needs
Get 10% FREE Customization
Customize This ReportPersonalize This Research
- Triangulate with your Own Data
- Get Data as per your Format and Definition
- Gain a Deeper Dive on a Specific Application, Geography, Customer or Competitor
- Any level of Personalization
Let Us Help You
- What are the Known and Unknown Adjacencies Impacting the Automated Stationary NDT & Inspection Systems Market
- What will your New Revenue Sources be?
- Who will be your Top Customer; what will make them switch?
- Defend your Market Share or Win Competitors
- Get a Scorecard for Target Partners

Custom Market Research Services
We Will Customise The Research For You, In Case The Report Listed Above Does Not Meet With Your Requirements
Get 10% Free CustomisationTESTIMONIALS

Tetsuya Ohhira
Business Development Manager-Technology Business
Nikon Corporation,
Leading Japanese MNC specializing in optics and imaging productswww.nikon.com
MarketsandMarkets™ response
is quick. Their attitude is flexible and positive. Analyst Insights are globally considered and
significant. Client Services quickly respond to our inquiry and demand. Their wide range of global
surveys help us make our strategic plan.
We hope Knowledge Store will be easier to search
for a report.
VP - Marketing & Business Development
Leading Provider of Process Control Solutions
We engaged with MarketsandMarkets on a study to perform an analysis and recommend a Go-To-Market strategy for metrology and process control in the semiconductor market. The study was tailored to our targets and needs with well-defined milestones. Our overall experience with the MarketsandMarkets team was very good throughout the project in all aspects including the analysis methodologies used, the quality and depth of primary and secondary data sets, the professionalism and flexibility of the team and the ability to meet the target schedule and milestones. We want to thank MarketsandMarkets team for a job well done.
Growth opportunities and latent adjacency in Automated Stationary NDT & Inspection Systems Market


Joseph
Apr, 2026
In what ways are complementary technologies like robotics, edge computing, and Industrial IoT reshaping the value proposition of automated stationary NDT solution.