The research study involved extensive secondary sources, such as company annual reports/presentations, industry association publications, magazine articles, directories, technical handbooks, World Economic Outlook, trade websites, technical articles, and databases, to identify and collect information on the battery thermal management system market. Primary sources, such as experts from related industries, automobile OEMs, and suppliers, were interviewed to obtain and verify critical information and assess the growth prospects and market estimations.
Secondary Research
Secondary sources for this research study include corporate filings, such as annual reports, investor presentations, and financial statements; trade, business, and professional associations; whitepapers, marklines, and the OICA (International Organization of Motor Vehicle Manufacturers); certified publications; articles by recognized authors; directories; and databases. Secondary data was collected and analyzed to determine the overall market size, further validated by primary research.
Primary Research
Extensive primary research was conducted after understanding the BTMS market scenario through secondary research. Several primary interviews were conducted with market experts from the demand side (vehicle manufacturers, country-level government associations, and trade associations) and the supply side (BTMS manufacturers, component providers, and system integrators). The regions considered for the research include North America, Europe, the Asia Pacific, and the Rest of the World. Approximately 17% and 83% of primary interviews were conducted from the demand and supply sides. Primary data was collected through questionnaires, emails, and telephonic interviews. In the canvassing of primaries, various departments within organizations, such as sales, operations, and marketing, were covered to provide a holistic viewpoint in this report.
After interacting with industry experts, brief sessions were conducted with highly experienced independent consultants to reinforce the findings from the primaries. This, along with the in-house subject matter experts’ opinions, led to the findings described in this report.

To know about the assumptions considered for the study, download the pdf brochure
Market Size Estimation
A detailed market estimation approach was followed to estimate and validate the volume and value of the BTMS market and other submarkets, as mentioned below.
-
Key players in the BTMS market were identified through secondary research. Their global market share was determined through primary and secondary research.
-
The research methodology included studying the annual and quarterly financial reports & regulatory filings of major market players and interviews with industry experts for detailed market insights.
-
All major penetration rates, percentage shares, splits, and breakdowns for the BTMS market across end users were determined using secondary sources and verified through primary sources.
-
All key macro indicators affecting the revenue growth of the market segments and subsegments were accounted for, viewed in extensive detail, verified through primary research, and analyzed to get the validated and verified quantitative & qualitative data.
-
The gathered market data was consolidated and added with detailed inputs, analyzed, and presented in this report.
Global BTMS Market Size: Bottom-Up Approach

To know about the assumptions considered for the study, Request for Free Sample Report
Global BTMS Market Size: Top-Down Approach

Data Triangulation
After arriving at the overall market size through the aforementioned methodology, the BTMS market was split into several segments and subsegments. The data triangulation procedure was employed, wherever applicable, to complete the overall market engineering process and arrive at the exact market value for key segments and subsegments. The extrapolated market data was triangulated by studying various macro indicators and regional trends from both the demand- and supply-side participants.
Market Definition
BTMS Market: According to Grayson Thermal Systems, BTMS encompasses technologies and solutions that help regulate and control the temperature of batteries in electric vehicles, specifically battery electric (BEV), plug-in hybrid electric vehicles (PHEVs), and fuel cell electric (FCEV) vehicles. These systems help maintain optimal battery performance, range, and service life by ensuring that batteries operate within a specified temperature range. BTMS includes various components such as cooling systems, heating systems, insulation materials, sensors, and control algorithms to efficiently manage battery temperatures under different operating conditions.
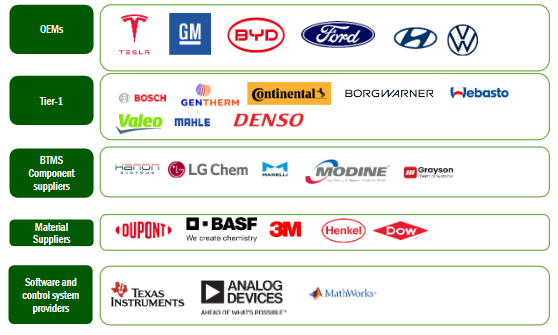
Key Stakeholders
-
Automobile Original Equipment Manufacturers (OEM)
-
Automotive electronics system integrators
-
Automotive Parts Manufacturers’ Association (APMA)
-
Electric Drive Transportation Association (EDTA)
-
Electric power infrastructure suppliers
-
Electric Vehicle Association of Asia Pacific (EVAAP)
-
Electric vehicle hardware suppliers
-
Manufacturers of automotive wireless charging systems for EVs
-
Manufacturers of electric vehicle charging system
-
Society of Manufacturers of Electric Vehicles (SMEV)
-
World Electric Vehicle Association (WEVA)
Report Objectives
-
To segment and forecast the size of the battery thermal management system (BTMS) market in terms of volume (thousand units) and value (USD million)
-
To define, describe, and forecast the size of the BTMS market based on technology type, battery type, vehicle type, battery capacity, offering, propulsion, and region
-
To analyze regional markets for growth trends, prospects, and their contribution to the overall market
-
To segment and forecast the market size, by technology (active, passive, and hybrid)
-
To segment and forecast the market size, by battery type (lithium-ion and solid state)
-
To segment and forecast the market size, by vehicle type (passenger vehicles and commercial vehicles)
-
To segment and forecast the market size, by battery capacity (<100 kWh, 100–200 kWh, 200–500 kWh, and >500 kWh)
-
To segment and forecast the market size, by offering (BTMS with battery and BTMS without battery)
-
To segment and forecast the market size, by propulsion type (battery electric vehicles, plug-in hybrid electric vehicles, and fuel cell electric vehicles)
-
To forecast the market size by region (North America, Europe, Asia Pacific, and Rest of the World)
-
To analyze technological developments impacting the market
-
To provide detailed information about the major factors influencing the market growth (drivers, challenges, restraints, and opportunities)
-
To strategically analyze the market, considering individual growth trends, prospects, and contributions to the total market
-
To study the following concerning the market (Value chain analysis, Ecosystem analysis, Technology analysis, HS code, Case study analysis, patent analysis, Regulatory analysis, Key stakeholders and buying criteria, and key conferences and events.)
-
To estimate the following with respect to the BTMS market (Pricing analysis, propulsion type, by region, and market ranking analysis).
-
To strategically profile key players and comprehensively analyze their market ranking and core competencies
-
To analyze the impact of the recession on the market
-
To track and analyze competitive developments such as deals, product developments, expansions, and other developments carried out by key industry participants.
Available Customizations
With the given market data, MarketsandMarkets offers customizations in accordance to the company’s specific needs.
-
BTMS MARKET, BY VEHICLE TYPE AT THE COUNTRY LEVEL (FOR COUNTRIES NOT COVERED IN THE REPORT)
COMPANY INFORMATION:
-
Profiling of additional market players (Up to 5)

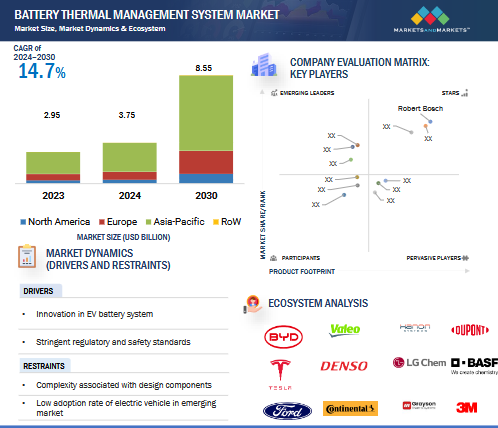


 EUROPE SECOND HIGHEST MARKET IN 2024-2030
 GERMANY LARGEST GROWING MARKET IN REGION
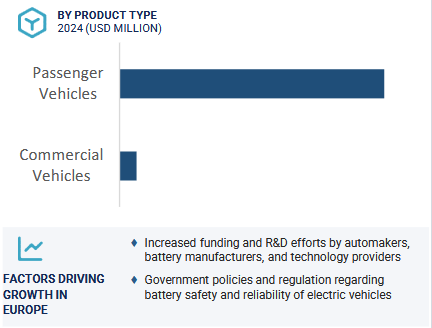


Growth opportunities and latent adjacency in Battery Thermal Management System Market