
Cashew Nutshell Liquid Market

Cashew Nutshell Liquid Market by Product (PF Resins, Epoxy Resins, Epoxy Curing Agents, Surfactants, Polyols, Friction Linings), Application (Adhesive, Coating, Foam & Insulation, Laminate, Personal Care, Fuel), Region (Asia Pacific, North America, Europe, Middle East & Africa, South America) - Global Forecast to 2030


OVERVIEW
Source: Secondary Research, Interviews with Experts, MarketsandMarkets Analysis
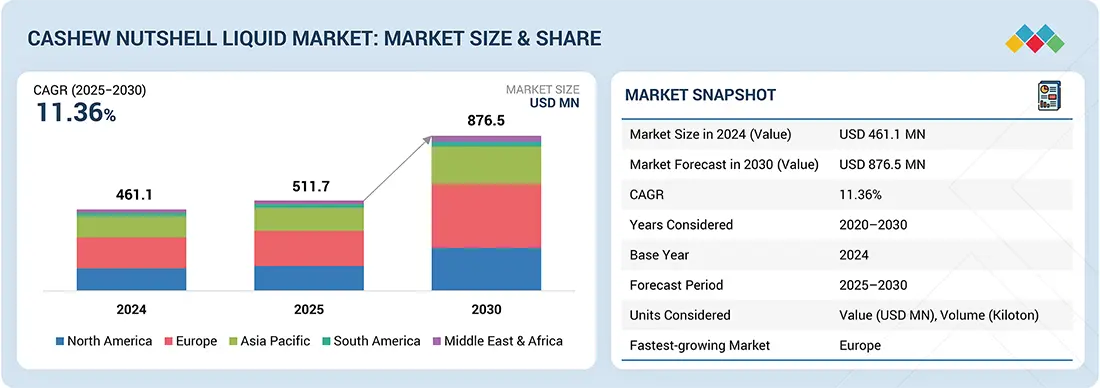
The cashew nutshell liquid market is projected to reach USD 876.5 million by 2030 from USD 511.7 million in 2025, at a CAGR of 11.36% from 2025 to 2030. Cashew nutshell liquid (CNSL) is a by-product of the cashew industry. The cashew nut has a shell outside, which is a soft honeycomb structure containing a dark reddish-brown viscous liquid or oil called CNSL. The liquid has multiple applications in polymer industries, such as friction linings, adhesives, coatings, laminating resins, rubber compounding resins, cashew cements, PU-based polymers, surfactants, epoxy resins, foundry chemicals, and intermediates for the chemical industry. The cashew nutshell liquid market is growing due to its increasing adoption as a sustainable, bio-based alternative to petroleum-derived chemicals in coatings, adhesives, friction materials, and specialty applications.
KEY TAKEAWAYS
-
BY PRODUCT TYPEThe epoxy modifiers & resins segment is projected to register the second-highest CAGR of 11.21% due to the demand for enhanced corrosion and chemical resistance in industrial coatings, increasing use in composite/adhesive formulations, and manufacturers’ shift toward bio-based, high-performance additives.
-
BY APPLICATIONThe friction linings segment is growing at a CAGR of 13.27% owing to the rising production of automobiles, increasing demand for high-performance brake pads and clutch facings, and the superior heat resistance, durability, and eco-friendly advantages offered by cashew nutshell liquid derivatives.
-
BY REGIONEurope's cashew nutshell liquid market is projected to grow at a CAGR of 12.71%, driven by stringent environmental regulations and increasing regulatory pressure to move away from petroleum-based raw materials.
-
COMPETITIVE LANDSCAPEThe major market players have adopted both organic and inorganic strategies, including expansions, collaborations, acquisitions, and investments. For instance, COIM USA, a specialty chemical manufacturer, acquired a 20-acre property from Palmer International. The acquisition included existing logistics infrastructure and a new renewable polyol product line derived chiefly from CNSL.
The cashew nutshell liquid (CNSL) market is expected to grow rapidly. This growth perspective is linked to the fact that CNSL-derived products are in huge demand, due to the mounting demand for bio-based and sustainable material, as well as high performing offering in several industries. CNSL is a natural secondary phenolic lipid obtained from the cashew nutshell that has gained popularity with its flexibility and environmentally friendly properties, and it can be used as resins, coatings, friction linings, adhesives, and surfactants.
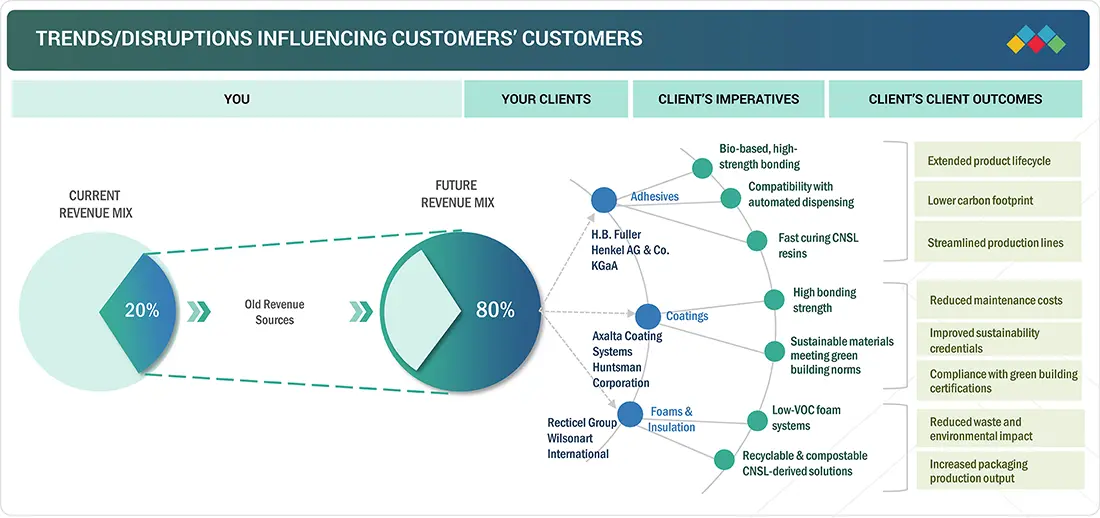
TRENDS & DISRUPTIONS IMPACTING CUSTOMERS' CUSTOMERS
The megatrends such as sustainability, bio-based material adoption, and green chemistry regulations are reshaping revenue streams in the CNSL market. With increasing global pressure to move away from petrochemical-based products, CNSL is gaining prominence across diverse industries for its renewable origin and multifunctional performance.
Source: Secondary Research, Interviews with Experts, MarketsandMarkets Analysis
MARKET DYNAMICS
Level
-
Increasing preference for bio-based alternatives

-
Growing government initiatives supporting cashew industry

Level
-
Emissions and fume release during processing

-
Lack of standardization and inconsistent quality

Level
-
CNSL biofuel blends for marine fuel

-
R&D in CNSL applications accelerating commercial adoption

Level
-
Availability of substitutes

Source: Secondary Research, Interviews with Experts, MarketsandMarkets Analysis
Driver: Increasing preference for bio-based alternatives
One key factor influencing the growth of the cashew nutshell liquid market is the increasing global preference for bio-based alternatives. As industries and consumers become more concerned about the environmental impact of less sustainable and hazardous materials, cashew nutshell liquid emerges as a promising renewable resource that can replace petroleum-based chemicals in various processes. Since it is produced from agricultural waste, cashew nutshell liquid aligns well with the principles of a circular economy and green chemistry, making it an attractive option for manufacturers aiming to reduce their carbon footprint.
Restraint: Emissions and fume release during processing
The production of emissions and fumes during the processing and handling of cashew nutshell liquid (CNSL) is a significant concern in the global market. Although CNSL is a bio-based product and has some environmental benefits, its extraction and modification involve thermal and chemical processes that can generate harmful fumes and emissions. When heating or decarboxylating CNSL, especially in uncontrolled or poorly ventilated environments, phenolic fumes may be released. These fumes can pose health risks to workers, causing skin and eye irritation, respiratory issues, and potentially leading to long-term exposure problems.
Opportunity: CNSL biofuel blends for marine fuel
The use of CNSL biofuel blends as marine fuel presents a promising opportunity in the global market, especially as the shipping industry faces increasing pressure to reduce its carbon footprint and reliance on fossil fuels. Shipping is one of the top contributors to global greenhouse gas (GHG) emissions, and with the International Maritime Organization (IMO) enforcing mandatory emission reduction targets, the adoption of low-carbon and alternative fuel options is becoming essential. CNSL-based biofuels provide renewable and eco-friendly energy that can be blended with conventional marine fuels, effectively lowering overall emissions without requiring drastic modifications to engine technology.
Challenge: Availability of substitutes
Availability of substitutes is one of the major problems that limit the expansion of the CNSL market. Although CNSL has a series of benefits associated with it, including its renewable, biodegradable, and agricultural waste derivative, there are a number of existing alternatives that perform similarly but with higher stream consistency, scale capabilities, and performance properties, both chemical and physical. In the products used in resins, coatings, adhesives, and friction linings, CNSL-based products have little competition as more widely used sensitized petroleum-derived phenols, epoxy resins, acrylics, and formaldehyde-based systems have decades-long accumulation of technical experience and implementation in the industry.
Cashew Nutshell Liquid Market: COMMERCIAL USE CASES ACROSS INDUSTRIES
| COMPANY | USE CASE DESCRIPTION | BENEFITS |
|---|---|---|
 |
Uses CNSL-based resins in industrial adhesives and sealants | Enhances adhesion, flexibility, and sustainability with bio-based content |
 |
Incorporates CNSL derivatives in specialty adhesives and coatings | Provides strong bonding with improved water/chemical resistance and reduced reliance on petroleum-based phenols |
 |
Employs CNSL-based curing agents in protective and anticorrosion coatings | Increases durability, chemical resistance, and eco-friendliness of coatings |
 |
Uses CNSL-derived polyols and resins in polyurethanes and epoxy systems | Improves mechanical strength, reduces VOCs, and supports renewable chemistry initiatives |
 |
Integrates CNSL polyols into foam and insulation products | Enhances sustainability with renewable inputs while maintaining thermal performance and flexibility |
Logos and trademarks shown above are the property of their respective owners. Their use here is for informational and illustrative purposes only.
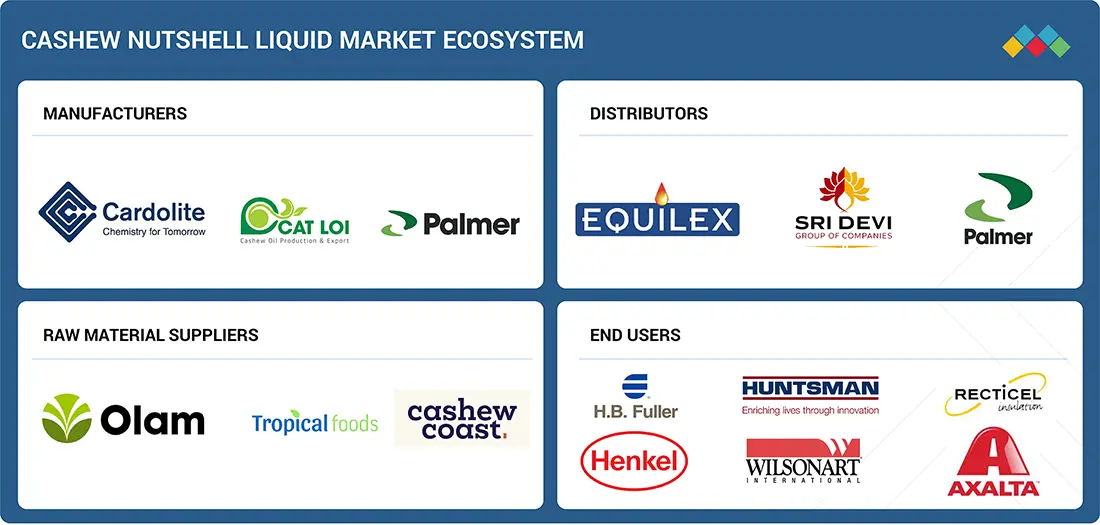
MARKET ECOSYSTEM
The cashew nutshell liquid market ecosystem involves identifying and analyzing interconnected relationships among various stakeholders, including raw material suppliers, manufacturers, distributors, and end users. Raw material suppliers are the source of raw materials for cashew nutshell liquid manufacturers. The manufacturers use technologies to produce cashew nutshell liquid. The distributors and suppliers are the ones who establish contact between the manufacturing companies and end users to concentrate on the supply chain, increasing operational efficiency and profitability.
Logos and trademarks shown above are the property of their respective owners. Their use here is for informational and illustrative purposes only.
MARKET SEGMENTS
Source: Secondary Research, Interviews with Experts, MarketsandMarkets Analysis
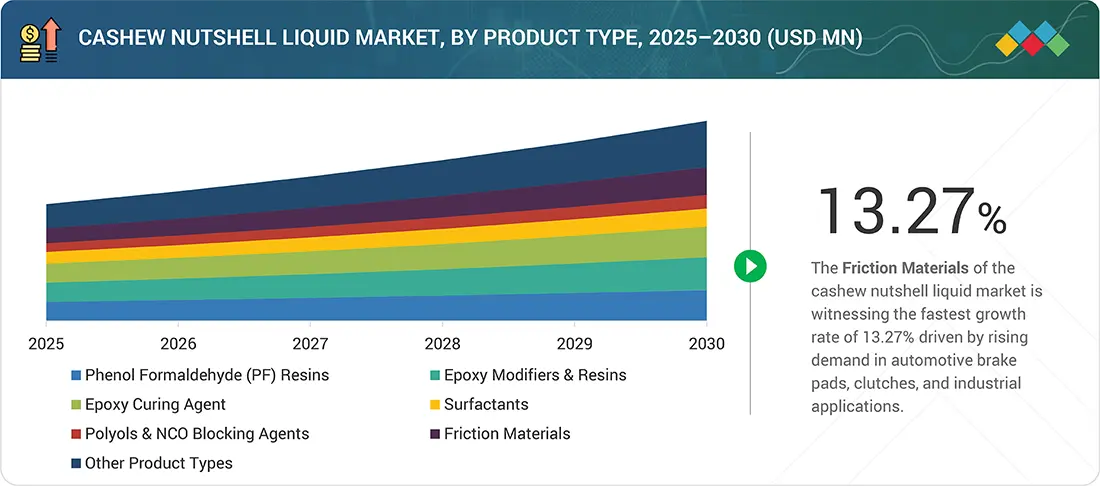
Cashew Nutshell Market, by Product Type
Friction materials are rapidly becoming the fastest-growing segment in the global cashew nutshell liquid (CNSL) market. This market includes demulsifiers, oilfield additives, and specialty chemicals. The significant growth in the friction materials segment is primarily driven by the increasing demand for high-performance, heat-resistant, and environmentally friendly materials in the automotive, railway, and industrial machinery production industries. CNSL-derived products possess remarkable properties, such as exceptional heat resistance, strong binding capabilities, and resistance to wear and deformation. These characteristics make them particularly valuable in applications like brake pads, clutch plates, disc brakes, and industrial friction linings.
Cashew Nutshell Market, by Application Type
Coatings dominate the cashew nutshell liquid market (CNSL) in terms of application due to the unique chemical characteristics of CNSL-derived compounds. This is primarily driven by the increasing demand for sustainable and high-performance coating solutions. Cinnamyl alcohol, particularly the primary active component cardanol found in CNSL, is highly valued in the coatings industry because of its phenolic structure combined with a long chain of aliphatic groups. This structure provides a balance between rigidity, flexibility, and hydrophobicity. As a result, CNSL is recognized as an excellent raw material for producing alkyds, epoxies, phenolic resins, and polyurethane coatings, which are used in industrial, protective, marine, and decorative applications.
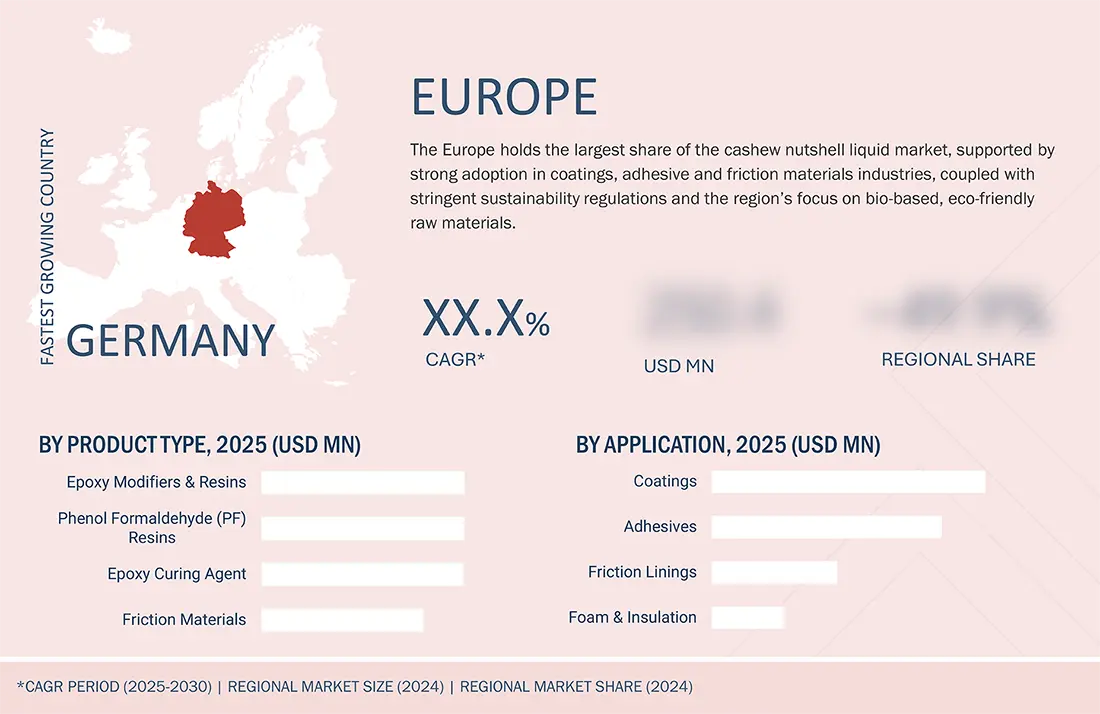
REGION
Europe is expected to be the largest and fastest-growing market for cashew nutshell liquid during the forecast period
Europe is expected to lead the market for cashew nutshell liquid at the regional level, with the fastest projected growth in market share. This is largely due to the region's strong commitment to sustainability, a preference for bio-based products, and a well-developed industrial complex. European countries are actively working to reduce gray emissions, substitute fuel-based crude materials, and implement sustainable chemical practices. All of these initiatives align well with the unique value offered by cashew nutshell liquid, which is a non-edible, renewable resource derived from waste by-products. This makes it an innovative bio-feedstock for various industries, allowing them to reduce their environmental impact without compromising product quality.
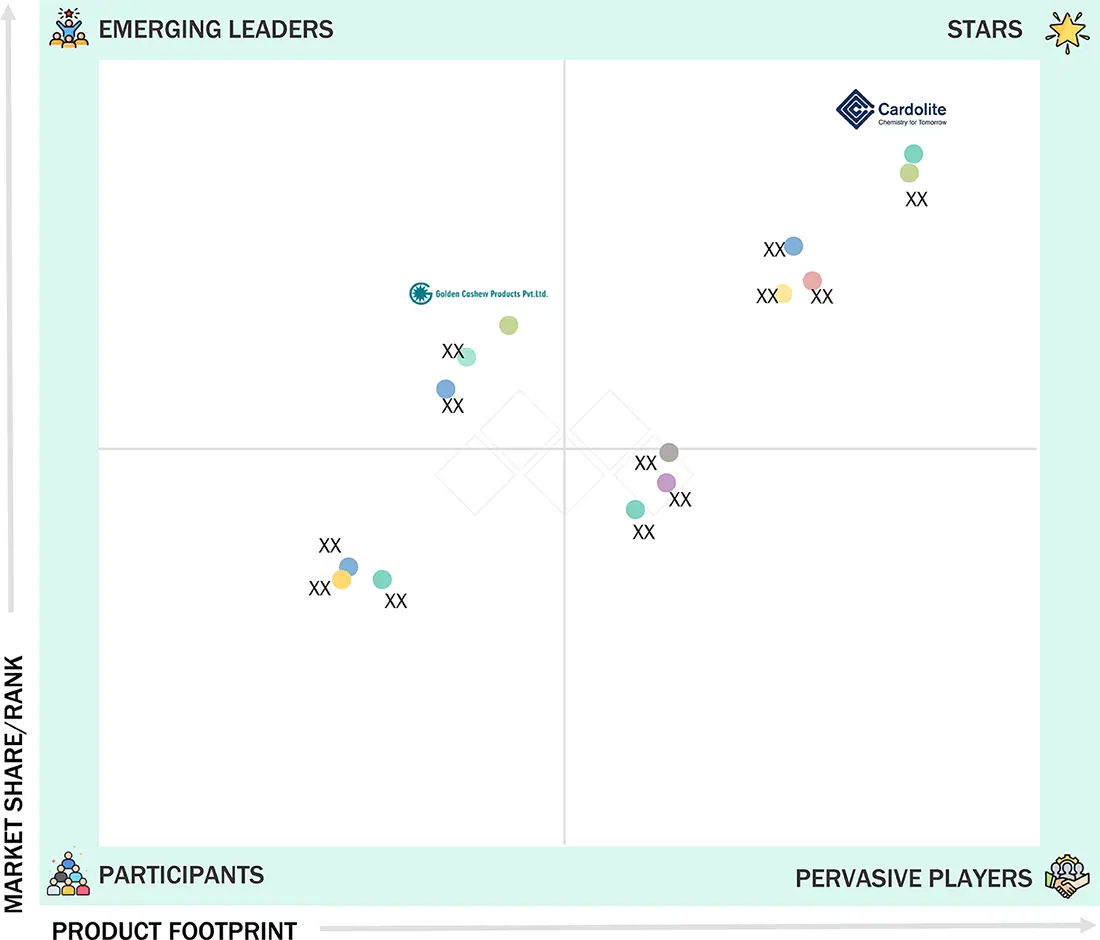
Cashew Nutshell Liquid Market: COMPANY EVALUATION MATRIX
In the cashew nutshell liquid market matrix, Cardolite Corporation (Star) leads with a strong market presence and wide product portfolio, driving large-scale adoption across applications. Golden Cashew Products Pvt. Ltd. (Emerging Leader) is gaining traction with cashew nutshell liquid solutions like coatings and adhesives across industries. While Cardolite Corporation dominates with scale, Cashew Products Pvt. Ltd. shows strong growth potential to advance toward the leaders’ quadrant.
Source: Secondary Research, Interviews with Experts, MarketsandMarkets Analysis
KEY MARKET PLAYERS
MARKET SCOPE
| REPORT METRIC | DETAILS |
|---|---|
| Market Size in 2024 (Value) | USD 461.1 MN |
| Market Forecast in 2030 (Value) | USD 876.5 MN |
| Growth Rate | CAGR of 11.36% from 2025-2030 |
| Years Considered | 2020−2030 |
| Base Year | 2024 |
| Forecast Period | 2025−2030 |
| Units Considered | Value (USD Million), Volume (Kiloton) |
| Report Coverage | Revenue forecast, company ranking, competitive landscape, growth factors, and trends |
| Segments Covered | • Product Type: Phenol Formaldehyde (PF) Resins, Epoxy Modifiers & Resins, Epoxy Curing Agent, Surfactants, Polyols & NCO Blocking Agents, Friction Materials, and Other Product Types • By Application: Adhesives, Coatings, Foam & Insulation, Laminates, Fri |
| Regions Covered | Asia Pacific, North America, Europe, South America, and Middle East & Africa |
WHAT IS IN IT FOR YOU: Cashew Nutshell Liquid Market REPORT CONTENT GUIDE
DELIVERED CUSTOMIZATIONS
We have successfully delivered the following deep-dive customizations:
| CLIENT REQUEST | CUSTOMIZATION DELIVERED | VALUE ADDS |
|---|---|---|
| Europe -based Cashew Nutshell Liquid Manufacturer | • Detailed Europe-based company profiles of competitors (financials, product portfolio) • Customer landscape mapping by application sector • Partnership ecosystem analysis | • Identify interconnections and supply chain blind spots • Detect customer migration trends across applications • Highlight untapped customer clusters for market entry |
| Asia Pacific-based Cashew Nutshell Liquid Manufacturer | • Global & regional production capacity benchmarking • Customer base profiling across the applications | • Strengthen forward integration strategy • Identify high-demand customers for long-term supply contracts • Assess supply-demand gaps for competitive advantage |
RECENT DEVELOPMENTS
- May 2025 : COIM USA, a specialty chemical manufacturer, acquired 20-acre property from Palmer International. The acquisition included existing logistics infrastructure and a new renewable polyol product line derived chiefly from CNSL.
- December 2022 : Palmer International expanded its operations by purchasing an existing facility at TexAmericas Center in New Boston, Texas (Texarkana region). The company committed an initial investment of USD 10 million to install equipment throughout 2023. This move was driven by capacity constraints at Palmer’s Pennsylvania site and the desire to capitalize on Texas’s business-friendly environment and logistical advantages.
Table of Contents
 Exclusive indicates content/data unique to MarketsandMarkets and not available with any competitors.
Methodology
The study involved four major activities in estimating the size of the CNSL market. Exhaustive secondary research was done to collect information on the market, the peer market, and the parent market. The next step was to validate these findings, assumptions, and sizing with industry experts across the value chain through primary research. Both top-down and bottom-up approaches were employed to estimate the complete market size. After that, the market breakdown and data triangulation procedures were used to estimate the market size of the segments and subsegments.
Secondary Research
Secondary sources used in this study included annual reports, press releases, and investor presentations of companies; white papers; certified publications; articles from recognized authors; and gold standard & silver standard websites such as Factiva, ICIS, Bloomberg, and others. The findings of this study were verified through primary research by conducting extensive interviews with key officials such as CEOs, VPs, directors, and other executives.
Primary Research
The CNSL market comprises several stakeholders, such as raw material suppliers, end-product manufacturers, and regulatory organizations in the supply chain. The demand side of this market is characterized by key opinion leaders in various applications for the CNSL market. The supply side is characterized by advancements in technology and diverse application industries. Various primary sources from both the supply and demand sides of the market were interviewed to obtain qualitative and quantitative information. The breakdown of interviews with experts is illustrated in the figure below:
Breakdown of Interviews With Experts

Note: Tier 1, Tier 2, and Tier 3 companies are classified based on their market revenue in 2023/2024, available in the public domain, product portfolios, and geographical presence.
Other designations include consultants and sales, marketing, and procurement managers.
To know about the assumptions considered for the study, download the pdf brochure
| COMPANY NAME | DESIGNATION | |
|---|---|---|
| Georgia-Pacific | Senior Manager | |
| Boise Cascade | Innovation Manager | |
| Weyerhaeuser Company | Vice-President | |
| UPM | Production Supervisor | |
| SVEZA Group | Sales Manager | |
Market Size Estimation
Both top-down and bottom-up approaches were used to estimate and validate the total size of the CNSL market. These methods were also used extensively to estimate the size of various subsegments in the market. The research methodology used to estimate the market size includes the following:
- The key players in the industry have been identified through extensive secondary research.
- The supply chain of the industry has been determined through primary and secondary research.
- All percentage shares, splits, and breakdowns have been determined using secondary sources and verified through primary sources.
- All possible parameters that affect the markets covered in this research study have been accounted for, viewed in extensive detail, verified through primary research, and analyzed to obtain the final quantitative and qualitative data.

Data Triangulation
After arriving at the overall market size—using the market size estimation processes as explained above—the market was split into several segments and subsegments. To complete the overall market engineering process and arrive at the exact statistics of each market segment and subsegment, data triangulation, and market breakdown procedures were employed, wherever applicable. The data was triangulated by studying various factors and trends from both the demand and supply sides in the CNSL industry.
Market Definition
CNSL is a by-product of the cashew industry. The cashew nut has a shell outside, which is a soft honeycomb structure containing a dark reddish-brown viscous liquid or oil called CNSL. The liquid has multiple applications in polymer industries, such as friction linings, adhesives, coatings, laminating resins, rubber compounding resins, cashew cements, PU-based polymers, surfactants, epoxy resins, foundry chemicals, and intermediates for the chemical industry.
Stakeholders
- Adhesive and coating manufacturers
- Raw material suppliers
- Manufacturing technology providers
- Industry associations
- Stakeholders in the adhesive and coatings industry
- Traders, distributors, and suppliers of CNSL
- NGOs, government bodies, regional agencies, and research organizations
Report Objectives
- To analyze and forecast the CNSL market in terms of value and volume
- To provide detailed information about the key factors (drivers, restraints, opportunities, and challenges) influencing market growth
- To define, segment, and project the size of the global CNSL market based on product type, and application
- To project the market size for five main regions: North America, Europe, Asia Pacific, the Middle East & Africa, and South America, with their key countries
- To analyze the micromarkets concerning individual growth trends, prospects, and their contribution to the overall market
- To analyze opportunities in the market for stakeholders and provide a competitive landscape of the market leaders
- To track and analyze R&D and competitive developments, such as expansions, product launches, collaborations, investments, partnerships, agreements, developments, collaborations, and mergers & acquisitions in the CNSL market
Key Questions Addressed by the Report
Who are the major players in the cashew nutshell liquid market?
Major players include Cardolite Corporation (US), GHW (Vietnam) Co. Ltd., Palmer International (US), LC Buffalo Co. Ltd. (Vietnam), Cat Loi Cashew Oil Production & Export Joint Stock Company (Vietnam), SENESEL sp. z o.o. (Poland), Zhejiang Wansheng Co., Ltd. (China), Cashew Chem India (India), Sri Devi Group (India), and ADMARK Polycoats Pvt. Ltd. (India).
What are the drivers and opportunities for the cashew nutshell liquid market?
Drivers include rising demand from coatings and adhesives industries, government initiatives supporting the cashew sector, and preference for bio-based alternatives. Opportunities are expected from technological advancements in manufacturing.
Which strategies are the key players focusing upon in the cashew nutshell liquid market?
The key strategies adopted are product launches, partnerships, mergers & acquisitions, agreements, and expansions to grow their global footprint.
What is the expected growth rate of the cashew nutshell liquid market between 2025 and 2030?
The market is projected to grow at a CAGR of 11.36% in terms of value during the forecast period.
Which major factors are expected to restrain the growth of the cashew nutshell liquid market?
Growth is expected to be restrained by emissions and fume release during processing, lack of standardization, and inconsistent product quality.
Need a Tailored Report?
Customize this report to your needs
Get 10% FREE Customization
Customize This ReportPersonalize This Research
- Triangulate with your Own Data
- Get Data as per your Format and Definition
- Gain a Deeper Dive on a Specific Application, Geography, Customer or Competitor
- Any level of Personalization
Let Us Help You
- What are the Known and Unknown Adjacencies Impacting the Cashew Nutshell Liquid Market
- What will your New Revenue Sources be?
- Who will be your Top Customer; what will make them switch?
- Defend your Market Share or Win Competitors
- Get a Scorecard for Target Partners

Custom Market Research Services
We Will Customise The Research For You, In Case The Report Listed Above Does Not Meet With Your Requirements
Get 10% Free CustomisationTESTIMONIALS

We at Nissan Chemicals Corporation have been clients of MarketsandMarkets for more than a year now. We recently consulted MarketsandMarkets for a study, the team at MarketsandMarkets was extremely professional and organized. The business insights were very detailed and aligned well with our expectations that really helped us formulate the Business Plans and device new strategies for development themes. MarketsandMarkets offers a unique combination of expertise and dedicated engagement model. Their research findings have helped us in designing our Pricing Strategy which will make it easier for us to predict the future sales and profits for the next ten years. We look forward to working with MarketsandMarkets in the future.
VP of Strategy & New Business Development
Leading Specialty Chemical Company
The MarketsandMarkets Engagement Model, composed of both the Knowledge Store and advisory custom research, has greatly helped us in understanding our markets and making strategic decisions. The Knowledge Store is a fast way to allow everyone in our organization to understand more about most any market they are interested in. The ability to then get custom research done and get answers to specific strategic questions and market insight has been spectacular. The Markets and Markets team feel more like colleagues than vendors and their services have helped us change our culture where statements of things like growth opportunities and competitive position are always backed by industry research.

Rich Gibson,
Director, Corporate Strategy
Milliken & Company,
Leading Industrial Manufacturer of specialty chemical, floor covering, performance and protective textile materials, and healthcaremilliken.com
MarketsandMarkets is a trusted resource that helps us to better understand markets that are near-adjacencies-whether its technology, value chain or geography. Their Knowledge Store platform provides a dashboard of markets and their characteristics which is easy to use and saves us time.
Adam Shaw,
Market Development and Strategy Manager
AdvanSix Inc. USA,
An American Leader in Chemicalswww.advansix.com
The Knowledge Store from MarketsandMarkets is a valuable tool which has helped my team acquire greater insight in to the end markets that our business serves. This has enabled us to help our company build stronger strategies throughout our planning process.
TOSHIO KINOSHITA
Senior Chif Consultion Research & Consulting Division
Mitsubishi Chemical Research Corporation,
Leading Manufacturer of Chemical Productswww.mitsubishichem-res.co.jp/en/

We recently engaged with MarketsandMarkets for a study, the team not only clearly understood our business objectives but was also extremely professional in the way they handled the entire project. The study was efficiently conducted in a phase-wise manner, and the engagement model furnished us with high-quality business insights that far exceeded our expectations at each phase. We were especially happy that MarketsandMarkets could provide us with both, an English as well as a Japanese version of the study. A special thanks to the Analyst Team and Client Services Team, whose fluency in Japanese enhanced our comfort level, as we could converse with them in our preferred language.
Independent entrepreneurs
Arrow Precision
We approached MarketsandMarkets for study on Proppants Market, and their work exceeded our expectations. The study conducted was comprehensive and enabled us to view the market through the various dimensions. In addition, the team was extraordinarily responsive throughout the process and resolved our queries on time. I strongly recommend MarketsandMarkets and will certainly consider them for additional market assessments we will need in the future.
Global engineering company, Japan
Deputy Manager,
Strategic Planning OfficeThe high-quality insights shared by the MarketsandMarkets team helped us understand the pharmaceutical plant designers in a specific geography. It also captured the risks that we may likely face in communicating with our potential partners. The study would enable us identify partners, which would impact our future growth.


Growth opportunities and latent adjacency in Cashew Nutshell Liquid Market