Aerospace Testing Market by Material Testing, Environmental Testing, Structural/Component Testing, Avionics/Flight & Electronics Testing, Propulsion System Testing, In-house, Commercial, Military & Defense, Space Exploration - Global Forecast to 2030

icon1
USD 6.91 BN
MARKET SIZE, 2030
icon2
CAGR 4.6%
(2025-2030)
icon3
278
REPORT PAGES
icon4
217
MARKET TABLES

OVERVIEW

certificate-testing-market Overview

Source: Secondary Research, Interviews with Experts, MarketsandMarkets Analysis

The aerospace testing market is projected to reach USD 6.91 billion by 2030 from USD 5.50 billion in 2025, at a CAGR of 4.6% from 2025 to 2030. The growth of the aerospace testing market is driven by the rising demand for commercial aircraft in developing economies, and growing use of UAVs in military and commercial applications

KEY TAKEAWAYS

  • By Region
    The North America aerospace testing market dominated with a 39.2% revenue share in 2024.
  • By End User
    By end user, the space exploration segment is expected to register the highest CAGR of 7.4%.
  • By Testing Type
    By testing type, the avionics/flight & electronics testing segment is projected to grow at the fastest rate from 2025 to 2030.
  • By Sourcing
    By sourcing, the outsourced segment is expected to register the highest CAGR of 5.7%.
  • Competitive Landscape
    SGS, Intertek, and Element Materials Technology stand out as Star players in the aerospace testing market thanks to their global lab networks, strong accreditation depth, and end-to-end testing capabilities. Their expertise across materials, NDT, environmental, engine, and avionics testing helps OEMs and Tier-1 suppliers speed up certification and reduce program risk. Continuous investments in advanced test rigs and aerospace-grade quality systems further strengthen their leadership and industry trust.
  • Competitive Landscape
    Astroscale and Accion Systems stand out as high-potential startups in the aerospace testing space, driven by cutting-edge satellite servicing and propulsion technologies that require intensive qualification and verification. Their rapid innovation and agile development models position them as emerging disruptors in next-generation space systems testing

The aerospace testing market is growing steadily as next-gen aircraft, engines, and space systems demand higher reliability and tighter certification standards. With advanced materials, electrified propulsion, and complex avionics becoming mainstream, traditional testing methods fall short, driving strong adoption of advanced structural, environmental, and performance testing solutions.

TRENDS & DISRUPTIONS IMPACTING CUSTOMERS' CUSTOMERS

The aerospace testing market is rapidly evolving as AI-driven predictive tools, digital twins, and advanced NDT reshape how modern aircraft are validated. Beyond traditional structural and environmental testing, the sector is shifting toward hot areas like structural health monitoring, autonomous systems, and avionics cybersecurity. With rising demand for lightweight materials, fuel efficiency, and stricter safety compliance, customers now expect faster cycles, higher reliability, and lower maintenance costs. This transformation is unlocking new growth opportunities and pushing the industry toward smarter, more sustainable testing practices.

certificate-testing-market Disruptions

Source: Secondary Research, Interviews with Experts, MarketsandMarkets Analysis

MARKET DYNAMICS

Drivers
Impact
Level
  • Rising demand for commercial aircraft in developing economies
  • Growing use of UAVs in military and commercial applications
RESTRAINTS
Impact
Level
  • Complex and time-consuming testing process due to stringent regulations
OPPORTUNITIES
Impact
Level
  • Development of advanced aircraft technologies creating need for specialized testing
  • Need for new testing methodologies to cater to evolving aerospace technologies
CHALLENGES
Impact
Level
  • Budget constraints necessitating aerospace companies to cut testing costs

Source: Secondary Research, Interviews with Experts, MarketsandMarkets Analysis

Driver: Rising demand for commercial aircraft in developing economies

Rapid urbanization and a growing middle class in developing economies are increasing the demand for air travel. This trend is expected to continue as economic growth in these regions sustains the need for larger commercial fleets and new aircraft models, driving the aerospace testing market to ensure quality and safety standards.

Restraint: Complex and time-consuming testing process due to stringent regulations

The aerospace industry is highly regulated, with stringent safety and quality standards to protect passengers and ensure operational integrity. Meeting these regulatory requirements can be complex, requiring extensive documentation, rigorous testing, and validation processes that significantly increase time and costs. As regulations evolve, staying compliant can become even more challenging, limiting the speed and flexibility of the aerospace testing process.

Opportunity: Development of advanced aircraft technologies creating need for specialized testing

As aerospace companies develop new technologies, such as lightweight materials, hybrid-electric propulsion systems, and autonomous flight capabilities, there is an increasing demand for specialized testing to validate these advancements. Ensuring safety, reliability, and regulatory compliance for these novel technologies requires tailored testing solutions, presenting a significant growth opportunity for the aerospace testing market.

Challenge: Budget constraints necessitating aerospace companies to cut testing costs

Aerospace companies often face budget constraints due to rising operational costs, such as increased prices for raw materials, fuel, and labor, along with ongoing supply chain disruptions that further inflate expenses. These financial pressures can lead companies to prioritize cost-cutting measures, including reductions in testing budgets. Additionally, competitive pressures to release new technologies quickly may drive companies to streamline or limit testing to maintain speed to market.

AEROSPACE TESTING MARKET SIZE, SHARE AND TRENDS: COMMERCIAL USE CASES ACROSS INDUSTRIES

COMPANY USE CASE DESCRIPTION BENEFITS
Full-scale structural testing, fatigue testing, and vibration analysis for commercial aircraft platforms (737, 787). Ensures airframe durability, improves safety margins, reduces maintenance risk, and accelerates certification timelines.
Environmental, climatic, and materials testing for composite-rich aircraft such as the A350 and A320neo. Enhances material reliability, validates performance under extreme conditions, and supports lightweight design adoption.
Aerodynamic, thermal, and propulsion testing for defense aircraft (F-35, F-22) and hypersonic systems. Boosts mission reliability, validates high-speed performance, and supports advanced propulsion innovations.

Logos and trademarks shown above are the property of their respective owners. Their use here is for informational and illustrative purposes only.

MARKET ECOSYSTEM

The aerospace testing ecosystem comprises three key segments: component manufacturers, testing service providers, and end users. Aerospace component manufacturers like GE Aerospace, Collins Aerospace, Airbus, Honeywell, and Safran design and produce essential parts and systems for aircraft and spacecraft, setting the foundation for testing requirements. Aerospace testing service providers such as DEKRA, TÜV SÜD, Eurofins, TÜV Rheinland, and Intertek play a critical role in validating safety, performance, and regulatory compliance, offering specialized testing services across materials, electronics, and structural components. Finally, end users, including major aerospace companies like SpaceX, Boeing, NASA, Northrop Grumman, and Raytheon Technologies, rely on these tested components and systems to innovate and operate in the aerospace sectors, from commercial aviation to defense and space exploration.

certificate-testing-market Ecosystem

Logos and trademarks shown above are the property of their respective owners. Their use here is for informational and illustrative purposes only.

MARKET SEGMENTS

certificate-testing-market Segments

Source: Secondary Research, Interviews with Experts, MarketsandMarkets Analysis

aerospace testing Market, By Testing Type

The avionics/flight & electronics testing segment is projected to register the highest CAGR during the forecast period. This high growth is attributed to the rapid advancements in aircraft electronics, including next-generation flight control systems, communication technologies, navigation systems, and autonomous systems. As aircraft become more reliant on sophisticated electronics to enhance safety, efficiency, and performance, rigorous testing of these systems becomes increasingly critical. The rise of electric aircraft and the growing demand for unmanned aerial vehicles (UAVs) further drive the need for comprehensive avionics testing.

aerospace testing Market, By Sourcing

The in-house sourcing segment is expected to dominate the aerospace testing market due to the highly specialized and stringent requirements involved in aerospace testing. Many aerospace companies prefer to keep testing operations in-house to maintain greater control over the quality, security, and confidentiality of sensitive data and proprietary technologies. Additionally, having in-house capabilities allows for faster turnaround times, customization of testing processes, and seamless integration into the development and production workflow.

aerospace testing Market, By End User

In 2024, the commercial aviation sector dominates the aerospace testing market, primarily due to the continuous demand for new aircraft to accommodate growing global air travel. Factors such as increasing passenger traffic, fleet expansion by airlines, and the need for more fuel-efficient, next-generation aircraft contribute to the dominance of this segment. Additionally, the emphasis on safety, regulatory compliance, and performance optimization in commercial aviation leads to rigorous testing requirements. Aircraft manufacturers and operators prioritize extensive material, structural, environmental, and electronic testing to ensure safety and reliability, which is driving the growth of aerospace testing in the commercial segment.

REGION

Asia Pacific to be fastest-growing region in global aerospace testing market during forecast period

The aerospace testing market is experiencing the fastest growth in the Asia Pacific region. The region's rapid economic growth, particularly in countries like China, India, and Japan, is driving an increase in both commercial and military aircraft production. The rising demand for air travel, fueled by expanding middle-class populations and urbanization, is pushing airlines to invest in new, fuel-efficient aircraft. This, in turn, is driving the demand for comprehensive aerospace testing services. Moreover, governments in Asia Pacific are investing significantly in defense and space programs. All these factors are boosting the need for specialized testing services in Asia Pacific.

certificate-testing-market Region

AEROSPACE TESTING MARKET SIZE, SHARE AND TRENDS: COMPANY EVALUATION MATRIX

In the aerospace testing market matrix, SGS stands firmly in the Leaders' Quadrant for third-party Inspection, Testing, and Certification (TIC), with a dominant global network and comprehensive service offerings for the entire aerospace value chain (including NDT, materials, and certification). Airbus, positioned as a emerging leader, is strengthening its footprint through its massive, in-house OEM testing capabilities for new aircraft development, cutting-edge R&D, and proprietary test facility operation.

certificate-testing-market Evaluation Metrics

Source: Secondary Research, Interviews with Experts, MarketsandMarkets Analysis

KEY MARKET PLAYERS

MARKET SCOPE

REPORT METRIC DETAILS
Market Size in 2025 (Value) USD 5.50 Billion
Market Forecast in 2030 (Value) USD 6.91 Billion
Growth Rate CAGR of 4.6% from 2025-2030
Years Considered 2021-2030
Base Year 2024
Forecast Period 2025-2030
Units Considered Value (USD Million)
Report Coverage Revenue forecast, company ranking, competitive landscape, growth factors, and trends
Segments Covered
  • By Testing Type:
    • Material Testing
    • Structural/Component Testing
    • Environmental Testing
    • Fuel Testing
    • Avionics/Flight & Electronics Testing
    • Propulsion System Testing
    • Other Testing Services
  • By Sourcing:
    • In-house
    • Outsourced
  • By End User:
    • Commercial
    • Military & Defense
    • Space Exploration
    • Other End Users
Regions Covered North America, Asia Pacific, Europe, Rest of the World

WHAT IS IN IT FOR YOU: AEROSPACE TESTING MARKET SIZE, SHARE AND TRENDS REPORT CONTENT GUIDE

certificate-testing-market Content Guide

DELIVERED CUSTOMIZATIONS

We have successfully delivered the following deep-dive customizations:

CLIENT REQUEST CUSTOMIZATION DELIVERED VALUE ADDS
Leading Indian Aerospace OEM
  • Competitive benchmarking of full-scale structural test rigs across global players
  • Supply chain risk assessment for actuators, DAQ & hydraulic systems
  • Enabled identification of previously hidden crack initiation under Indian-specific environmental loads
  • Allowed client to become South Asia’s largest independent structural test centre with full DGCA/EASA traceability
Global Tier-1 Aerospace Test System Supplier
  • Accurate market sizing (2024-2035) for high-thrust & altitude engine test cells
  • Detailed competitor analysis
  • Technology roadmap focusing on combined altitude + humidity simulation
  • Enabled early identification of preferred-supplier status in upcoming GTRE & DRDO projects
  • Allowed client to secure three exclusive co-development MoUs with defense labs
International Propulsion Test Equipment Manufacturer
  • Gap analysis of health-monitoring systems for semi-cryogenic & cryogenic engines
  • Competitive Benchmarking
  • Testing services trends & roadmap
  • Regulatory updates across the globe
  • Global Regulatory Access and Risk Mitigation by providing accredited
  • Understanding and expanding into different testing services
  • Detecting potential catastrophic failures better

RECENT DEVELOPMENTS

  • October 2024 : TÜV Rheinland acquired Safetec Nordic AS, a Norwegian consulting firm specializing in risk management and safety solutions. This acquisition strengthens TÜV Rheinland’s services in safety engineering, particularly in sectors such as oil & gas, transportation, and other high-risk industries. The addition of Safetec enhances TÜV Rheinland’s capabilities in managing risks related to safety, environmental impact, and technical integrity, aligning with their mission to provide comprehensive safety services worldwide.
  • September 2024 : TÜV Rheinland acquired ICARO, an Italian engineering and consulting firm specializing in health, safety, environment, and process safety (HSE). The acquisition aligns with TÜV Rheinland’s strategy to strengthen its service offerings in the energy and environmental sectors, expanding its capabilities in Italy.
  • August 2024 : Boeing partnered with AI Engineering Services Limited (AIESL) to enhance maintenance, repair, and overhaul (MRO) services for the Indian Navy’s P-8I fleet. The partnership will focus on in-country component repairs and landing gear overhauls, supporting the long-term sustainment of the P-8I aircraft. This partnership strengthens Boeing’s commitment to local capabilities, advancing India’s defense industry self-reliance.
  • April 2024 : Bureau Veritas partnered with ST Engineering to support the development of AirX’s Wing Ground Technology, which aims to enhance operational efficiency in aviation. This collaboration focuses on optimizing aircraft maintenance and reducing downtime through innovative inspection and testing techniques. The partnership will leverage Bureau Veritas’ expertise in testing and certification to ensure compliance with safety standards, helping to improve the reliability of aircraft maintenance procedures while integrating advanced technologies into the aviation sector.
  • April 2024 : Bureau Veritas collaborated with French airline Amelia (Regourd Aviation) to achieve the highest operational safety and regulatory compliance standards. This collaboration aimed to enhance Amelia’s safety measures and certification processes, which aligned with stringent aviation regulations.
  • COLUMN 'A' SHOULD BE IN TEXT FORMAT AND NOT DATE FORMAT :


Table of Contents

Exclusive indicates content/data unique to MarketsandMarkets and not available with any competitors.

TITLE
PAGE NO
1
INTRODUCTION


25
2
RESEARCH METHODOLOGY


29
3
EXECUTIVE SUMMARY


41
4
PREMIUM INSIGHTS


45
5
MARKET OVERVIEW
Booming aerospace market driven by advanced tech, government investments, and rising UAV applications.


48
 
5.1
MARKET DYNAMICS


5.1.1
DRIVERS


5.1.1.1
RISING DEMAND FOR COMMERCIAL AIRCRAFT IN DEVELOPING ECONOMIES


5.1.1.2
GROWING USE OF UAVS IN MILITARY AND COMMERCIAL APPLICATIONS


5.1.1.3
SIGNIFICANT INVESTMENTS BY GOVERNMENTS IN MILITARY AND DEFENSE AIRCRAFT


5.1.2
RESTRAINTS


5.1.2.1
COMPLEX AND TIME-CONSUMING TESTING PROCESS DUE TO STRINGENT REGULATIONS


5.1.3
OPPORTUNITIES


5.1.3.1
DEVELOPMENT OF ADVANCED AIRCRAFT TECHNOLOGIES CREATING NEED FOR SPECIALIZED TESTING


5.1.3.2
NEED FOR NEW TESTING METHODOLOGIES TO CATER TO EVOLVING AEROSPACE TECHNOLOGIES


5.1.4
CHALLENGES


5.1.4.1
BUDGET CONSTRAINTS NECESSITATING AEROSPACE COMPANIES TO CUT TESTING COSTS


5.2
TRENDS/DISRUPTIONS IMPACTING CUSTOMER BUSINESS


5.3
SUPPLY CHAIN ANALYSIS


5.4
ECOSYSTEM ANALYSIS


5.5
INVESTMENT AND FUNDING SCENARIO


5.6
TECHNOLOGY ANALYSIS


5.6.1
KEY TECHNOLOGIES


5.6.1.1
ADDITIVE MANUFACTURING AND ROBOTICS


5.6.1.2
TRADITIONAL MOLDING


5.6.1.3
AUTOMATED LAY-UP


5.6.2
COMPLEMENTARY TECHNOLOGIES


5.6.2.1
ADVANCED PLACED PLY


5.6.3
ADJACENT TECHNOLOGIES


5.6.3.1
AUTOMATED TEST EQUIPMENT (ATE)


5.6.3.2
DATA ACQUISITION (DAQ) AND CONTROL SYSTEMS


5.7
PATENT ANALYSIS


5.8
TRADE ANALYSIS


5.8.1
IMPORT SCENARIO (HS CODE 8807)


5.8.2
EXPORT SCENARIO (HS CODE 8807)


5.9
KEY CONFERENCES AND EVENTS, 2025–2026


5.10
CASE STUDY ANALYSIS


5.10.1
CASE STUDY 1: VELOCITY COMPOSITES EXPANDS INTO US MARKET AND SUPPORTS GKN AEROSTRUCTURES


5.10.2
CASE STUDY 2: GKN AEROSPACE AND GE AEROSPACE EXTEND PARTNERSHIP FOR AEROENGINE DEVELOPMENT AND PRODUCTION


5.10.3
CASE STUDY 3: HEXCEL INTRODUCES LATEST HEXTOW CARBON FIBER INNOVATION


5.11
TARIFF AND REGULATORY LANDSCAPE


5.11.1
TARIFF ANALYSIS


5.11.2
REGULATORY BODIES, GOVERNMENT AGENCIES, AND OTHER ORGANIZATIONS


5.11.3
STANDARDS


5.12
PORTER’S FIVE FORCES ANALYSIS


5.12.1
THREAT OF NEW ENTRANTS


5.12.2
THREAT OF SUBSTITUTES


5.12.3
BARGAINING POWER OF SUPPLIERS


5.12.4
BARGAINING POWER OF BUYERS


5.12.5
INTENSITY OF COMPETITIVE RIVALRY


5.13
KEY STAKEHOLDERS AND BUYING CRITERIA


5.13.1
KEY STAKEHOLDERS IN BUYING PROCESS


5.13.2
BUYING CRITERIA


5.14
IMPACT OF AI/GEN AI ON AEROSPACE TESTING MARKET


5.14.1
INTRODUCTION


5.14.2
USE OF AI/GEN AI IN AEROSPACE TESTING APPLICATIONS


5.14.3
IMPACT OF AI/GEN AI ON AEROSPACE TESTING MARKET


5.15
IMPACT OF 2025 US TARIFF ON AEROSPACE TESTING MARKET


5.15.1
INTRODUCTION


5.16
KEY TARIFF RATES


5.17
IMPACT ON COUNTRY/REGION


5.17.1
US


5.17.2
EUROPE


5.17.3
ASIA PACIFIC


5.18
IMPACT ON END USERS


6
AEROSPACE TESTING MARKET, BY SOURCING TYPE
Market Size & Growth Rate Forecast Analysis to 2030 in USD Million | 2 Data Tables


82
 
6.1
INTRODUCTION


6.2
IN-HOUSE


6.2.1
IN-HOUSE TESTING ENABLES MAINTAINING CONTROL OVER PROPRIETARY DESIGNS, TECHNOLOGY, AND CLASSIFIED DATA


6.3
OUTSOURCED


6.3.1
OUTSOURCING ALLOWS AEROSPACE COMPANIES TO REDUCE TESTING COSTS


7
AEROSPACE TESTING MARKET, BY TESTING TYPE
Market Size & Growth Rate Forecast Analysis to 2030 in USD Million | 100 Data Tables


86
 
7.1
INTRODUCTION


7.2
MATERIAL TESTING


7.2.1
INCREASED DEMAND FOR LIGHTWEIGHT MATERIALS TO DRIVE MARKET


7.3
FUEL TESTING


7.3.1
INCREASING GLOBAL REGULATIONS ON EMISSIONS AND FUEL EFFICIENCY DRIVING NEED FOR FUEL TESTING


7.4
ENVIRONMENTAL TESTING


7.4.1
ADOPTION OF NEW LIGHTWEIGHT, HIGH-STRENGTH MATERIALS NECESSITATING RIGOROUS ENVIRONMENTAL TESTING


7.5
STRUCTURAL/COMPONENT TESTING


7.5.1
RISING DEMAND FOR COMMERCIAL AND MILITARY AIRCRAFT FUELING STRUCTURAL AND COMPONENT TESTING


7.6
AVIONICS/FLIGHT & ELECTRONICS TESTING


7.6.1
DEVELOPMENT OF AUTONOMOUS FLYING SYSTEMS AND ELECTRIC AIRCRAFT FUELING DEMAND FOR INNOVATIVE TESTING METHODS


7.7
PROPULSION SYSTEM TESTING


7.7.1
GROWING INTEREST IN SPACE TRAVEL FUELING DEMAND FOR THOROUGH TESTING OF ROCKET PROPULSION SYSTEMS


7.8
OTHER TESTING TYPES


8
AEROSPACE TESTING MARKET, BY END USER
Market Size & Growth Rate Forecast Analysis to 2030 in USD Million | 10 Data Tables


122
 
8.1
INTRODUCTION


8.2
COMMERCIAL


8.2.1
GROWING DEMAND FOR AIR TRAVEL NECESSITATING AIRLINES TO EXPAND THEIR FLEETS


8.3
MILITARY & DEFENSE


8.3.1
GROWING DEFENSE SPENDING ACROSS MAJOR COUNTRIES SUPPORTING MARKET GROWTH


8.4
SPACE EXPLORATION


8.4.1
INCREASING INVESTMENTS IN SPACE PROGRAMS TO DRIVE MARKET


8.5
OTHER END USERS


9
AEROSPACE TESTING MARKET, BY REGION
Comprehensive coverage of 10 Regions with country-level deep-dive of 12 Countries | 66 Data Tables.


130
 
9.1
INTRODUCTION


9.2
NORTH AMERICA


9.2.1
MACROECONOMIC OUTLOOK FOR NORTH AMERICA


9.2.2
US


9.2.2.1
PRESENCE OF A STRONG AVIATION SECTOR FUELING DEMAND FOR AEROSPACE TESTING


9.2.3
CANADA


9.2.3.1
INCREASING INVESTMENTS IN AEROSPACE AND DEFENSE SECTOR TO DRIVE MARKET


9.2.4
MEXICO


9.2.4.1
EXPANDING THE AEROSPACE MANUFACTURING SECTOR TO SUPPORT MARKET GROWTH


9.3
EUROPE


9.3.1
MACROECONOMIC OUTLOOK FOR EUROPE


9.3.2
GERMANY


9.3.2.1
FOCUS ON HYDROGEN AND ELECTRIC PROPULSION SYSTEMS TO DRIVE TESTING NEEDS FOR NEW AIRCRAFT TECHNOLOGIES


9.3.3
UK


9.3.3.1
ADVANCEMENTS IN DRONES AND ADVANCED FIGHTER JETS DEVELOPMENT DRIVING AEROSPACE TESTING MARKET


9.3.4
FRANCE


9.3.4.1
ROBUST SPACE SECTOR FUELING DEMAND FOR AEROSPACE TESTING


9.3.5
SPAIN


9.3.5.1
PRESENCE OF STRONG AIRCRAFT COMPONENTS MANUFACTURING DRIVING TESTING MARKET


9.3.6
REST OF EUROPE


9.4
ASIA PACIFIC


9.4.1
MACROECONOMIC OUTLOOK FOR ASIA PACIFIC


9.4.2
CHINA


9.4.2.1
RAPIDLY INCREASING AIR TRAVEL DEMAND DRIVING PRODUCTION OF COMMERCIAL AIRCRAFT


9.4.3
JAPAN


9.4.3.1
INCREASING FOCUS ON CUTTING EMISSIONS AND NOISE TO DRIVE TESTING FOR CLEANER AEROSPACE TECHNOLOGIES


9.4.4
INDIA


9.4.4.1
SIGNIFICANT DEFENSE BUDGET AND EMPHASIS ON MODERNIZING AIR CAPABILITIES TO DRIVE MARKET


9.4.5
SOUTH KOREA


9.4.5.1
FOCUS ON UAVS AND AUTONOMOUS SYSTEMS FOR DEFENSE AND COMMERCIAL APPLICATIONS TO DRIVE MARKET


9.4.6
AUSTRALIA


9.4.6.1
REBOUND OF COMMERCIAL AVIATION INDUSTRY AND EXPANSION OF DEFENSE AIRCRAFT FLEETS TO DRIVE DEMAND


9.4.7
REST OF ASIA PACIFIC


9.5
ROW


9.5.1
MACROECONOMIC OUTLOOK FOR ROW


9.5.2
SOUTH AMERICA


9.5.2.1
RISING PASSENGER TRAFFIC AND FLEET EXPANSION TO DRIVE DEMAND FOR TESTING AND CERTIFICATION


9.5.3
MIDDLE EAST & AFRICA


9.5.3.1
GCC


9.5.3.1.1
INVESTMENTS IN DEFENSE TO ENHANCE MILITARY CAPABILITIES AND MAINTAIN REGIONAL SECURITY TO SUPPORT MARKET GROWTH


9.5.3.2
REST OF MIDDLE EAST & AFRICA


10
COMPETITIVE LANDSCAPE
Discover strategic maneuvers defining market leadership and emerging threats in the competitive landscape.


171
 
10.1
OVERVIEW


10.2
KEY PLAYER STRATEGIES/RIGHT TO WIN, 2021–2025


10.3
REVENUE ANALYSIS, 2020–2023


10.4
MARKET SHARE ANALYSIS, 2024


10.5
COMPANY VALUATION AND FINANCIAL METRICS


10.6
BRAND/PRODUCT COMPARISON


10.7
COMPANY EVALUATION MATRIX: KEY PLAYERS, 2024


10.7.1
STARS


10.7.2
EMERGING LEADERS


10.7.3
PERVASIVE PLAYERS


10.7.4
PARTICIPANTS


10.7.4.1
COMPANY FOOTPRINT


10.7.5
COMPANY FOOTPRINT: KEY PLAYERS, 2024


10.7.5.1
REGION FOOTPRINT


10.7.5.2
TESTING TYPE FOOTPRINT


10.7.5.3
END USER FOOTPRINT


10.7.5.4
SOURCING TYPE FOOTPRINT


10.8
COMPANY EVALUATION MATRIX: STARTUPS/SMES, 2024


10.8.1
PROGRESSIVE COMPANIES


10.8.2
RESPONSIVE COMPANIES


10.8.3
DYNAMIC COMPANIES


10.8.4
STARTING BLOCKS


10.8.5
COMPETITIVE BENCHMARKING: STARTUPS/SMES, 2024


10.8.5.1
DETAILED LIST OF KEY STARTUPS/SMES


10.8.5.2
COMPETITIVE BENCHMARKING OF KEY STARTUPS/SMES


10.9
COMPETITIVE SCENARIO


10.9.1
DEALS


10.9.2
EXPANSIONS


10.9.3
OTHER DEVELOPMENTS


11
COMPANY PROFILES
In-depth Company Profiles of Leading Market Players with detailed Business Overview, Product and Service Portfolio, Recent Developments, and Unique Analyst Perspective (MnM View)


201
 
11.1
KEY TESTING SERVICE PROVIDERS


11.1.1
ELEMENT MATERIALS TECHNOLOGY


11.1.1.1
BUSINESS OVERVIEW


11.1.1.2
PRODUCTS/SOLUTIONS/SERVICES OFFERED


11.1.1.3
RECENT DEVELOPMENTS


11.1.1.3.1
DEALS


11.1.1.3.2
EXPANSIONS


11.1.1.3.3
OTHER DEVELOPMENTS


11.1.1.4
MNM VIEW


11.1.1.4.1
KEY STRENGTHS


11.1.1.4.2
STRATEGIC CHOICES


11.1.1.4.3
WEAKNESSES AND COMPETITIVE THREATS


11.1.2
SGS SA


11.1.3
INTERTEK GROUP PLC


11.1.4
TÜV SÜD


11.1.5
APPLUS+


11.1.6
TÜV RHEINLAND


11.1.7
EUROFINS SCIENTIFIC


11.1.8
BUREAU VERITAS


11.1.9
DEKRA


11.1.10
MISTRAS GROUP


11.2
OTHER TESTING SERVICE PROVIDERS


11.2.1
TESTEK SOLUTIONS


11.2.2
TEKTRONIX, INC.


11.2.3
ROHDE & SCHWARZ


11.2.4
DAYTON T. BROWN, INC.


11.2.5
MTS SYSTEMS


11.2.6
APPLIED TECHNICAL SERVICES


11.2.7
ALS


11.3
KEY TESTING EQUIPMENT PROVIDERS


11.3.1
THE BOEING COMPANY


11.3.2
AIRBUS


11.3.3
LOCKHEED MARTIN CORPORATION


11.3.4
NORTHROP GRUMMAN


11.3.5
COLLINS AEROSPACE


11.4
OTHER TESTING EQUIPMENT PROVIDERS


11.4.1
GE AEROSPACE


11.4.2
GENERAL DYNAMICS


11.4.3
MOOG INC.


11.4.4
LABORATORY TESTING INC.


12
APPENDIX


269
 
12.1
INSIGHTS FROM INDUSTRY EXPERTS


12.2
DISCUSSION GUIDE


12.3
KNOWLEDGESTORE: MARKETSANDMARKETS’ SUBSCRIPTION PORTAL


12.4
CUSTOMIZATION OPTIONS


12.5
RELATED REPORTS


12.6
AUTHOR DETAILS


LIST OF TABLES


TABLE 1
RISK ASSESSMENT: AEROSPACE TESTING MARKET


TABLE 2
ROLES OF COMPANIES IN AEROSPACE TESTING ECOSYSTEM


TABLE 3
AEROSPACE TESTING MARKET: LIST OF PATENTS, 2023–2024


TABLE 4
IMPORT DATA FOR HS CODE 8807-COMPLIANT PRODUCTS, BY COUNTRY, 2020–2024 (USD MILLION)


TABLE 5
EXPORT DATA FOR HS CODE 8807-COMPLIANT PRODUCTS BY COUNTRY, 2020–2024 (USD MILLION)


TABLE 6
LIST OF KEY CONFERENCES AND EVENTS, 2025–2026


TABLE 7
US: EXPORT TARIFF FOR HS CODE 8807-COMPLIANT PRODUCTS, 2024


TABLE 8
HONG KONG: EXPORT TARIFF FOR HS CODE 8807-COMPLIANT PRODUCTS, 2024


TABLE 9
NORTH AMERICA: REGULATORY BODIES, GOVERNMENT AGENCIES, AND OTHER ORGANIZATIONS


TABLE 10
EUROPE: REGULATORY BODIES, GOVERNMENT AGENCIES, AND OTHER ORGANIZATIONS


TABLE 11
ASIA PACIFIC: REGULATORY BODIES, GOVERNMENT AGENCIES, AND OTHER ORGANIZATIONS


TABLE 12
ROW: REGULATORY BODIES, GOVERNMENT AGENCIES, AND OTHER ORGANIZATIONS


TABLE 13
PORTER’S FIVE FORCES ANALYSIS


TABLE 14
INFLUENCE OF KEY STAKEHOLDERS ON BUYING PROCESS FOR TOP THREE END USERS


TABLE 15
KEY BUYING CRITERIA FOR TOP THREE END USERS


TABLE 16
US-ADJUSTED RECIPROCAL TARIFF RATES


TABLE 17
AEROSPACE TESTING MARKET, BY SOURCING TYPE, 2021–2024 (USD MILLION)


TABLE 18
AEROSPACE TESTING MARKET, BY SOURCING TYPE, 2025–2030 (USD MILLION)


TABLE 19
AEROSPACE TESTING MARKET, BY TESTING TYPE, 2021–2024 (USD MILLION)


TABLE 20
AEROSPACE TESTING MARKET, BY TESTING TYPE, 2025–2030 (USD MILLION)


TABLE 21
MATERIAL TESTING: AEROSPACE TESTING MARKET, BY REGION, 2021–2024 (USD MILLION)


TABLE 22
MATERIAL TESTING: AEROSPACE TESTING MARKET, BY REGION, 2025–2030 (USD MILLION)


TABLE 23
NORTH AMERICA: AEROSPACE TESTING MARKET FOR MATERIAL TESTING, BY COUNTRY, 2021–2024 (USD MILLION)


TABLE 24
NORTH AMERICA: AEROSPACE TESTING MARKET FOR MATERIAL TESTING, BY COUNTRY, 2025–2030 (USD MILLION)


TABLE 25
EUROPE: AEROSPACE TESTING MARKET FOR MATERIAL TESTING, BY COUNTRY, 2021–2024 (USD MILLION)


TABLE 26
EUROPE: AEROSPACE TESTING MARKET FOR MATERIAL TESTING, BY COUNTRY, 2025–2030 (USD MILLION)


TABLE 27
ASIA PACIFIC: AEROSPACE TESTING MARKET FOR MATERIAL TESTING, BY COUNTRY, 2021–2024 (USD MILLION)


TABLE 28
ASIA PACIFIC: AEROSPACE TESTING MARKET FOR MATERIAL TESTING, BY COUNTRY, 2025–2030 (USD MILLION)


TABLE 29
ROW: AEROSPACE TESTING MARKET FOR MATERIAL TESTING, BY REGION, 2021–2024 (USD MILLION)


TABLE 30
ROW: AEROSPACE TESTING MARKET FOR MATERIAL TESTING, BY REGION, 2025–2030 (USD MILLION)


TABLE 31
SOUTH AMERICA: AEROSPACE TESTING MARKET FOR MATERIAL TESTING, BY COUNTRY, 2021–2024 (USD MILLION)


TABLE 32
SOUTH AMERICA: AEROSPACE TESTING MARKET FOR MATERIAL TESTING, BY COUNTRY, 2025–2030 (USD MILLION)


TABLE 33
MIDDLE EAST & AFRICA: AEROSPACE TESTING MARKET FOR MATERIAL TESTING, BY COUNTRY,2021–2024 (USD MILLION)


TABLE 34
MIDDLE EAST & AFRICA: AEROSPACE TESTING MARKET FOR MATERIAL TESTING, BY COUNTRY,2025–2030 (USD MILLION)


TABLE 35
FUEL TESTING: AEROSPACE TESTING MARKET, BY REGION, 2021–2024 (USD MILLION)


TABLE 36
FUEL TESTING: AEROSPACE TESTING MARKET, BY REGION, 2025–2030 (USD MILLION)


TABLE 37
NORTH AMERICA: AEROSPACE TESTING MARKET FOR FUEL TESTING, BY COUNTRY, 2021–2024 (USD MILLION)


TABLE 38
NORTH AMERICA: AEROSPACE TESTING MARKET FOR FUEL TESTING, BY COUNTRY, 2025–2030 (USD MILLION)


TABLE 39
EUROPE: AEROSPACE TESTING MARKET FOR FUEL TESTING, BY COUNTRY, 2021–2024 (USD MILLION)


TABLE 40
EUROPE: AEROSPACE TESTING MARKET FOR FUEL TESTING, BY COUNTRY, 2025–2030 (USD MILLION)


TABLE 41
ASIA PACIFIC: AEROSPACE TESTING MARKET FOR FUEL TESTING, BY COUNTRY, 2021–2024 (USD MILLION)


TABLE 42
ASIA PACIFIC: AEROSPACE TESTING MARKET FOR FUEL TESTING, BY COUNTRY, 2025–2030 (USD MILLION)


TABLE 43
ROW: AEROSPACE TESTING MARKET FOR FUEL TESTING, BY REGION, 2021–2024 (USD MILLION)


TABLE 44
ROW: AEROSPACE TESTING MARKET FOR FUEL TESTING, BY REGION, 2025–2030 (USD MILLION)


TABLE 45
SOUTH AMERICA: AEROSPACE TESTING MARKET FOR FUEL TESTING, BY COUNTRY, 2021–2024 (USD MILLION)


TABLE 46
SOUTH AMERICA: AEROSPACE TESTING MARKET FOR FUEL TESTING, BY COUNTRY, 2025–2030 (USD MILLION)


TABLE 47
MIDDLE EAST & AFRICA: AEROSPACE TESTING MARKET FOR FUEL TESTING, BY COUNTRY, 2021–2024 (USD MILLION)


TABLE 48
MIDDLE EAST & AFRICA: AEROSPACE TESTING MARKET FOR FUEL TESTING, BY COUNTRY, 2025–2030 (USD MILLION)


TABLE 49
ENVIRONMENTAL TESTING: AEROSPACE TESTING MARKET, BY REGION, 2021–2024 (USD MILLION)


TABLE 50
ENVIRONMENTAL TESTING: AEROSPACE TESTING MARKET, BY REGION, 2025–2030 (USD MILLION)


TABLE 51
NORTH AMERICA: AEROSPACE TESTING MARKET FOR ENVIRONMENTAL TESTING, BY COUNTRY, 2021–2024 (USD MILLION)


TABLE 52
NORTH AMERICA: AEROSPACE TESTING MARKET FOR ENVIRONMENTAL TESTING, BY COUNTRY, 2025–2030 (USD MILLION)


TABLE 53
EUROPE: AEROSPACE TESTING MARKET FOR ENVIRONMENTAL TESTING, BY COUNTRY, 2021–2024 (USD MILLION)


TABLE 54
EUROPE: AEROSPACE TESTING MARKET FOR ENVIRONMENTAL TESTING, BY COUNTRY, 2025–2030 (USD MILLION)


TABLE 55
ASIA PACIFIC: AEROSPACE TESTING MARKET FOR ENVIRONMENTAL TESTING, BY COUNTRY, 2021–2024 (USD MILLION)


TABLE 56
ASIA PACIFIC: AEROSPACE TESTING MARKET FOR ENVIRONMENTAL TESTING, BY COUNTRY, 2025–2030 (USD MILLION)


TABLE 57
ROW: AEROSPACE TESTING MARKET FOR ENVIRONMENTAL TESTING, BY REGION, 2021–2024 (USD MILLION)


TABLE 58
ROW: AEROSPACE TESTING MARKET FOR ENVIRONMENTAL TESTING, BY REGION, 2025–2030 (USD MILLION)


TABLE 59
SOUTH AMERICA: AEROSPACE TESTING MARKET FOR ENVIRONMENTAL TESTING, BY COUNTRY, 2021–2024 (USD MILLION)


TABLE 60
SOUTH AMERICA: AEROSPACE TESTING MARKET FOR ENVIRONMENTAL TESTING, BY COUNTRY, 2025–2030 (USD MILLION)


TABLE 61
MIDDLE EAST & AFRICA: AEROSPACE TESTING MARKET FOR ENVIRONMENTAL TESTING, BY COUNTRY, 2021–2024 (USD MILLION)


TABLE 62
MIDDLE EAST & AFRICA: AEROSPACE TESTING MARKET FOR ENVIRONMENTAL TESTING, BY COUNTRY, 2025–2030 (USD MILLION)


TABLE 63
STRUCTURAL/COMPONENT TESTING: AEROSPACE TESTING MARKET, BY REGION, 2021–2024 (USD MILLION)


TABLE 64
STRUCTURAL/COMPONENT TESTING: AEROSPACE TESTING MARKET, BY REGION, 2025–2030 (USD MILLION)


TABLE 65
NORTH AMERICA: AEROSPACE TESTING MARKET FOR STRUCTURAL/ COMPONENT TESTING, BY COUNTRY, 2021–2024 (USD MILLION)


TABLE 66
NORTH AMERICA: AEROSPACE TESTING MARKET FOR STRUCTURAL/ COMPONENT TESTING, BY COUNTRY, 2025–2030 (USD MILLION)


TABLE 67
EUROPE: AEROSPACE TESTING MARKET FOR STRUCTURAL/COMPONENT TESTING, BY COUNTRY, 2021–2024 (USD MILLION)


TABLE 68
EUROPE: AEROSPACE TESTING MARKET FOR STRUCTURAL/COMPONENT TESTING, BY COUNTRY, 2025–2030 (USD MILLION)


TABLE 69
ASIA PACIFIC: AEROSPACE TESTING MARKET FOR STRUCTURAL/COMPONENT TESTING, BY COUNTRY, 2021–2024 (USD MILLION)


TABLE 70
ASIA PACIFIC: AEROSPACE TESTING MARKET FOR STRUCTURAL/COMPONENT TESTING, BY COUNTRY, 2025–2030 (USD MILLION)


TABLE 71
ROW: AEROSPACE TESTING MARKET FOR STRUCTURAL/COMPONENT TESTING, BY REGION, 2021–2024 (USD MILLION)


TABLE 72
ROW: AEROSPACE TESTING MARKET FOR STRUCTURAL/COMPONENT TESTING, BY REGION, 2025–2030 (USD MILLION)


TABLE 73
SOUTH AMERICA: AEROSPACE TESTING MARKET FOR STRUCTURAL/ COMPONENT TESTING, BY COUNTRY, 2021–2024 (USD MILLION)


TABLE 74
SOUTH AMERICA: AEROSPACE TESTING MARKET FOR STRUCTURAL/ COMPONENT TESTING, BY COUNTRY, 2025–2030 (USD MILLION)


TABLE 75
MIDDLE EAST & AFRICA: AEROSPACE TESTING MARKET FOR STRUCTURAL/ COMPONENT TESTING, BY COUNTRY, 2021–2024 (USD MILLION)


TABLE 76
MIDDLE EAST & AFRICA: AEROSPACE TESTING MARKET FOR STRUCTURAL/ COMPONENT TESTING, BY COUNTRY, 2025–2030 (USD MILLION)


TABLE 77
AVIONICS/FLIGHT & ELECTRONICS TESTING: AEROSPACE TESTING MARKET, BY REGION, 2021–2024 (USD MILLION)


TABLE 78
AVIONICS/FLIGHT & ELECTRONICS TESTING: AEROSPACE TESTING MARKET, BY REGION, 2025–2030 (USD MILLION)


TABLE 79
NORTH AMERICA: AEROSPACE TESTING MARKET FOR AVIONICS/FLIGHT & ELECTRONICS TESTING, BY COUNTRY, 2021–2024 (USD MILLION)


TABLE 80
NORTH AMERICA: AEROSPACE TESTING MARKET FOR AVIONICS/FLIGHT & ELECTRONICS TESTING, BY COUNTRY, 2025–2030 (USD MILLION)


TABLE 81
EUROPE: AEROSPACE TESTING MARKET FOR AVIONICS/FLIGHT & ELECTRONICS TESTING, BY COUNTRY, 2021–2024 (USD MILLION)


TABLE 82
EUROPE: AEROSPACE TESTING MARKET FOR AVIONICS/FLIGHT & ELECTRONICS TESTING, BY COUNTRY, 2025–2030 (USD MILLION)


TABLE 83
ASIA PACIFIC: AEROSPACE TESTING MARKET FOR AVIONICS/FLIGHT & ELECTRONICS TESTING, BY COUNTRY, 2021–2024 (USD MILLION)


TABLE 84
ASIA PACIFIC: AEROSPACE TESTING MARKET FOR AVIONICS/FLIGHT & ELECTRONICS TESTING, BY COUNTRY, 2025–2030 (USD MILLION)


TABLE 85
ROW: AEROSPACE TESTING MARKET FOR AVIONICS/FLIGHT & ELECTRONICS TESTING, BY REGION, 2021–2024 (USD MILLION)


TABLE 86
ROW: AEROSPACE TESTING MARKET FOR AVIONICS/FLIGHT & ELECTRONICS TESTING, BY REGION, 2025–2030 (USD MILLION)


TABLE 87
SOUTH AMERICA: AEROSPACE TESTING MARKET FOR AVIONICS/FLIGHT & ELECTRONICS TESTING, BY COUNTRY, 2021–2024 (USD MILLION)


TABLE 88
SOUTH AMERICA: AEROSPACE TESTING MARKET FOR AVIONICS/FLIGHT & ELECTRONICS TESTING, BY COUNTRY, 2025–2030 (USD MILLION)


TABLE 89
MIDDLE EAST & AFRICA: AEROSPACE TESTING MARKET FOR AVIONICS/FLIGHT & ELECTRONICS TESTING, BY COUNTRY, 2021–2024 (USD MILLION)


TABLE 90
MIDDLE EAST & AFRICA: AEROSPACE TESTING MARKET FOR AVIONICS/FLIGHT & ELECTRONICS TESTING, BY COUNTRY, 2025–2030 (USD MILLION)


TABLE 91
PROPULSION SYSTEM TESTING: AEROSPACE TESTING MARKET, BY REGION, 2021–2024 (USD MILLION)


TABLE 92
PROPULSION SYSTEM TESTING: AEROSPACE TESTING MARKET, BY REGION, 2025–2030 (USD MILLION)


TABLE 93
NORTH AMERICA: AEROSPACE TESTING MARKET FOR PROPULSION SYSTEM TESTING, BY COUNTRY, 2021–2024 (USD MILLION)


TABLE 94
NORTH AMERICA: AEROSPACE TESTING MARKET FOR PROPULSION SYSTEM TESTING, BY COUNTRY, 2025–2030 (USD MILLION)


TABLE 95
EUROPE: AEROSPACE TESTING MARKET FOR PROPULSION SYSTEM TESTING, BY COUNTRY, 2021–2024 (USD MILLION)


TABLE 96
EUROPE: AEROSPACE TESTING MARKET FOR PROPULSION SYSTEM TESTING, BY COUNTRY, 2025–2030 (USD MILLION)


TABLE 97
ASIA PACIFIC: AEROSPACE TESTING MARKET FOR PROPULSION SYSTEM TESTING, BY COUNTRY, 2021–2024 (USD MILLION)


TABLE 98
ASIA PACIFIC: AEROSPACE TESTING MARKET FOR PROPULSION SYSTEM TESTING, BY COUNTRY, 2025–2030 (USD MILLION)


TABLE 99
ROW: AEROSPACE TESTING MARKET FOR PROPULSION SYSTEM TESTING, BY REGION, 2021–2024 (USD MILLION)


TABLE 100
ROW: AEROSPACE TESTING MARKET FOR PROPULSION SYSTEM TESTING, BY REGION, 2025–2030 (USD MILLION)


TABLE 101
SOUTH AMERICA: AEROSPACE TESTING MARKET FOR PROPULSION SYSTEM TESTING, BY COUNTRY, 2021–2024 (USD MILLION)


TABLE 102
SOUTH AMERICA: AEROSPACE TESTING MARKET FOR PROPULSION SYSTEM TESTING, BY COUNTRY, 2025–2030 (USD MILLION)


TABLE 103
MIDDLE EAST & AFRICA: AEROSPACE TESTING MARKET FOR PROPULSION SYSTEM TESTING, BY COUNTRY, 2021–2024 (USD MILLION)


TABLE 104
MIDDLE EAST & AFRICA: AEROSPACE TESTING MARKET FOR PROPULSION SYSTEM TESTING, BY COUNTRY, 2025–2030 (USD MILLION)


TABLE 105
OTHER TESTING TYPES: AEROSPACE TESTING MARKET, BY REGION, 2021–2024 (USD MILLION)


TABLE 106
OTHER TESTING TYPES: AEROSPACE TESTING MARKET, BY REGION, 2025–2030 (USD MILLION)


TABLE 107
NORTH AMERICA: AEROSPACE TESTING MARKET FOR OTHER TESTING TYPES, BY COUNTRY, 2021–2024 (USD MILLION)


TABLE 108
NORTH AMERICA: AEROSPACE TESTING MARKET FOR OTHER TESTING TYPES, BY COUNTRY, 2025–2030 (USD MILLION)


TABLE 109
EUROPE: AEROSPACE TESTING MARKET FOR OTHER TESTING TYPES, BY COUNTRY, 2021–2024 (USD MILLION)


TABLE 110
EUROPE: AEROSPACE TESTING MARKET FOR OTHER TESTING TYPES, BY COUNTRY, 2025–2030 (USD MILLION)


TABLE 111
ASIA PACIFIC: AEROSPACE TESTING MARKET FOR OTHER TESTING TYPES, BY COUNTRY, 2021–2024 (USD MILLION)


TABLE 112
ASIA PACIFIC: AEROSPACE TESTING MARKET FOR OTHER TESTING TYPES, BY COUNTRY, 2025–2030 (USD MILLION)


TABLE 113
ROW: AEROSPACE TESTING MARKET FOR OTHER TESTING TYPES, BY REGION, 2021–2024 (USD MILLION)


TABLE 114
ROW: AEROSPACE TESTING MARKET FOR OTHER TESTING TYPES, BY REGION, 2025–2030 (USD MILLION)


TABLE 115
SOUTH AMERICA: AEROSPACE TESTING MARKET FOR OTHER TESTING TYPES, BY COUNTRY, 2021–2024 (USD MILLION)


TABLE 116
SOUTH AMERICA: AEROSPACE TESTING MARKET FOR OTHER TESTING TYPES, BY COUNTRY, 2025–2030 (USD MILLION)


TABLE 117
MIDDLE EAST & AFRICA: AEROSPACE TESTING MARKET FOR OTHER TESTING TYPES, BY COUNTRY, 2021–2024 (USD MILLION)


TABLE 118
MIDDLE EAST & AFRICA: AEROSPACE TESTING MARKET FOR OTHER TESTING TYPES, BY COUNTRY, 2025–2030 (USD MILLION)


TABLE 119
AEROSPACE TESTING MARKET, BY END USER, 2021–2024 (USD MILLION)


TABLE 120
AEROSPACE TESTING MARKET, BY END USER, 2025–2030 (USD MILLION)


TABLE 121
COMMERCIAL: AEROSPACE TESTING MARKET, BY REGION, 2021–2024 (USD MILLION)


TABLE 122
COMMERCIAL: AEROSPACE TESTING MARKET, BY REGION, 2025–2030 (USD MILLION)


TABLE 123
MILITARY & DEFENSE: AEROSPACE TESTING MARKET, BY REGION, 2021–2024 (USD MILLION)


TABLE 124
MILITARY & DEFENSE: AEROSPACE TESTING MARKET, BY REGION, 2025–2030 (USD MILLION)


TABLE 125
SPACE EXPLORATION: AEROSPACE TESTING MARKET, BY REGION, 2021–2024 (USD MILLION)


TABLE 126
SPACE EXPLORATION: AEROSPACE TESTING MARKET, BY REGION, 2025–2030 (USD MILLION)


TABLE 127
OTHER END USERS: AEROSPACE TESTING MARKET, BY REGION, 2021–2024 (USD MILLION)


TABLE 128
OTHER END USERS: AEROSPACE TESTING MARKET, BY REGION, 2025–2030 (USD MILLION)


TABLE 129
AEROSPACE TESTING MARKET, BY REGION, 2021–2024 (USD MILLION)


TABLE 130
AEROSPACE TESTING MARKET, BY REGION, 2025–2030 (USD MILLION)


TABLE 131
NORTH AMERICA: AEROSPACE TESTING MARKET, BY COUNTRY, 2021–2024 (USD MILLION)


TABLE 132
NORTH AMERICA: AEROSPACE TESTING MARKET, BY COUNTRY, 2025–2030 (USD MILLION)


TABLE 133
NORTH AMERICA: AEROSPACE TESTING MARKET, BY TESTING TYPE, 2021–2024 (USD MILLION)


TABLE 134
NORTH AMERICA: AEROSPACE TESTING MARKET, BY TESTING TYPE, 2025–2030 (USD MILLION)


TABLE 135
NORTH AMERICA: AEROSPACE TESTING MARKET, BY END USER, 2021–2024 (USD MILLION)


TABLE 136
NORTH AMERICA: AEROSPACE TESTING MARKET, BY END USER, 2025–2030 (USD MILLION)


TABLE 137
US: AEROSPACE TESTING MARKET, BY TESTING TYPE, 2021–2024 (USD MILLION)


TABLE 138
US: AEROSPACE TESTING MARKET, BY TESTING TYPE, 2025–2030 (USD MILLION)


TABLE 139
CANADA: AEROSPACE TESTING MARKET, BY TESTING TYPE, 2021–2024 (USD MILLION)


TABLE 140
CANADA: AEROSPACE TESTING MARKET, BY TESTING TYPE, 2025–2030 (USD MILLION)


TABLE 141
MEXICO: AEROSPACE TESTING MARKET, BY TESTING TYPE, 2021–2024 (USD MILLION)


TABLE 142
MEXICO: AEROSPACE TESTING MARKET, BY TESTING TYPE, 2025–2030 (USD MILLION)


TABLE 143
EUROPE: AEROSPACE TESTING MARKET, BY COUNTRY, 2021–2024 (USD MILLION)


TABLE 144
EUROPE: AEROSPACE TESTING MARKET, BY COUNTRY, 2025–2030 (USD MILLION)


TABLE 145
EUROPE: AEROSPACE TESTING MARKET, BY TESTING TYPE, 2021–2024 (USD MILLION)


TABLE 146
EUROPE: AEROSPACE TESTING MARKET, BY TESTING TYPE, 2025–2030 (USD MILLION)


TABLE 147
EUROPE: AEROSPACE TESTING MARKET, BY END USER, 2021–2024 (USD MILLION)


TABLE 148
EUROPE: AEROSPACE TESTING MARKET, BY END USER, 2025–2030 (USD MILLION)


TABLE 149
GERMANY: AEROSPACE TESTING MARKET, BY TESTING TYPE, 2021–2024 (USD MILLION)


TABLE 150
GERMANY: AEROSPACE TESTING MARKET, BY TESTING TYPE, 2025–2030 (USD MILLION)


TABLE 151
UK: AEROSPACE TESTING MARKET, BY TESTING TYPE, 2021–2024 (USD MILLION)


TABLE 152
UK: AEROSPACE TESTING MARKET, BY TESTING TYPE, 2025–2030 (USD MILLION)


TABLE 153
FRANCE: AEROSPACE TESTING MARKET, BY TESTING TYPE, 2021–2024 (USD MILLION)


TABLE 154
FRANCE: AEROSPACE TESTING MARKET, BY TESTING TYPE, 2025–2030 (USD MILLION)


TABLE 155
SPAIN: AEROSPACE TESTING MARKET, BY TESTING TYPE, 2021–2024 (USD MILLION)


TABLE 156
SPAIN: AEROSPACE TESTING MARKET, BY TESTING TYPE, 2025–2030 (USD MILLION)


TABLE 157
REST OF EUROPE: AEROSPACE TESTING MARKET, BY TESTING TYPE, 2021–2024 (USD MILLION)


TABLE 158
REST OF EUROPE: AEROSPACE TESTING MARKET, BY TESTING TYPE, 2025–2030 (USD MILLION)


TABLE 159
ASIA PACIFIC: AEROSPACE TESTING MARKET, BY COUNTRY, 2021–2024 (USD MILLION)


TABLE 160
ASIA PACIFIC: AEROSPACE TESTING MARKET, BY COUNTRY, 2025–2030 (USD MILLION)


TABLE 161
ASIA PACIFIC: AEROSPACE TESTING MARKET, BY TESTING TYPE, 2021–2024 (USD MILLION)


TABLE 162
ASIA PACIFIC: AEROSPACE TESTING MARKET, BY TESTING TYPE, 2025–2030 (USD MILLION)


TABLE 163
ASIA PACIFIC: AEROSPACE TESTING MARKET, BY END USER, 2021–2024 (USD MILLION)


TABLE 164
ASIA PACIFIC: AEROSPACE TESTING MARKET, BY END USER, 2025–2030 (USD MILLION)


TABLE 165
CHINA: AEROSPACE TESTING MARKET, BY TESTING TYPE, 2021–2024 (USD MILLION)


TABLE 166
CHINA: AEROSPACE TESTING MARKET, BY TESTING TYPE, 2025–2030 (USD MILLION)


TABLE 167
JAPAN: AEROSPACE TESTING MARKET, BY TESTING TYPE, 2021–2024 (USD MILLION)


TABLE 168
JAPAN: AEROSPACE TESTING MARKET, BY TESTING TYPE, 2025–2030 (USD MILLION)


TABLE 169
INDIA: AEROSPACE TESTING MARKET, BY TESTING TYPE, 2021–2024 (USD MILLION)


TABLE 170
INDIA: AEROSPACE TESTING MARKET, BY TESTING TYPE, 2025–2030 (USD MILLION)


TABLE 171
SOUTH KOREA: AEROSPACE TESTING MARKET, BY TESTING TYPE, 2021–2024 (USD MILLION)


TABLE 172
SOUTH KOREA: AEROSPACE TESTING MARKET, BY TESTING TYPE, 2025–2030 (USD MILLION)


TABLE 173
AUSTRALIA: AEROSPACE TESTING MARKET, BY TESTING TYPE, 2021–2024 (USD MILLION)


TABLE 174
AUSTRALIA: AEROSPACE TESTING MARKET, BY TESTING TYPE, 2025–2030 (USD MILLION)


TABLE 175
REST OF ASIA PACIFIC: AEROSPACE TESTING MARKET, BY TESTING TYPE, 2021–2024 (USD MILLION)


TABLE 176
REST OF ASIA PACIFIC: AEROSPACE TESTING MARKET, BY TESTING TYPE, 2025–2030 (USD MILLION)


TABLE 177
ROW: AEROSPACE TESTING MARKET, BY REGION, 2021–2024 (USD MILLION)


TABLE 178
ROW: AEROSPACE TESTING MARKET, BY REGION, 2025–2030 (USD MILLION)


TABLE 179
ROW: AEROSPACE TESTING MARKET, BY TESTING TYPE, 2021–2024 (USD MILLION)


TABLE 180
ROW: AEROSPACE TESTING MARKET, BY TESTING TYPE, 2025–2030 (USD MILLION)


TABLE 181
ROW: AEROSPACE TESTING MARKET, BY END USER, 2021–2024 (USD MILLION)


TABLE 182
ROW: AEROSPACE TESTING MARKET, BY END USER, 2025–2030 (USD MILLION)


TABLE 183
SOUTH AMERICA: AEROSPACE TESTING MARKET, BY TESTING TYPE, 2021–2024 (USD MILLION)


TABLE 184
SOUTH AMERICA: AEROSPACE TESTING MARKET, BY TESTING TYPE, 2025–2030 (USD MILLION)


TABLE 185
SOUTH AMERICA: AEROSPACE TESTING MARKET, BY COUNTRY, 2021–2024 (USD MILLION)


TABLE 186
SOUTH AMERICA: AEROSPACE TESTING MARKET, BY COUNTRY, 2025–2030 (USD MILLION)


TABLE 187
MIDDLE EAST & AFRICA: AEROSPACE TESTING MARKET, BY TESTING TYPE, 2021–2024 (USD MILLION)


TABLE 188
MIDDLE EAST & AFRICA: AEROSPACE TESTING MARKET, BY TESTING TYPE, 2025–2030 (USD MILLION)


TABLE 189
MIDDLE EAST & AFRICA: AEROSPACE TESTING MARKET, BY REGION, 2021–2024 (USD MILLION)


TABLE 190
MIDDLE EAST & AFRICA: AEROSPACE TESTING MARKET, BY REGION, 2025–2030 (USD MILLION)


TABLE 191
GCC: AEROSPACE TESTING MARKET, BY TESTING TYPE, 2021-2024 (USD MILLION)


TABLE 192
GCC: AEROSPACE TESTING MARKET, BY TESTING TYPE, 2025–2030 (USD MILLION)


TABLE 193
REST OF MIDDLE EAST & AFRICA: AEROSPACE TESTING MARKET, BY TESTING TYPE, 2021–2024 (USD MILLION)


TABLE 194
REST OF MIDDLE EAST & AFRICA: AEROSPACE TESTING MARKET, BY TESTING TYPE, 2025–2030 (USD MILLION)


TABLE 195
AEROSPACE TESTING MARKET: OVERVIEW OF STRATEGIES ADOPTED BY KEY PLAYERS, FEBRUARY 2021–MARCH 2025


TABLE 196
AEROSPACE TESTING MARKET: DEGREE OF COMPETITION, 2024


TABLE 197
AEROSPACE TESTING MARKET: REGION FOOTPRINT


TABLE 198
AEROSPACE TESTING MARKET: TESTING TYPE FOOTPRINT


TABLE 199
AEROSPACE TESTING MARKET: END USER FOOTPRINT


TABLE 200
AEROSPACE TESTING MARKET: SOURCING TYPE FOOTPRINT


TABLE 201
AEROSPACE TESTING MARKET: DETAILED LIST OF KEY STARTUPS/SMES


TABLE 202
AEROSPACE TESTING MARKET: COMPETITIVE BENCHMARKING OF KEY STARTUPS/SMES


TABLE 203
AEROSPACE TESTING MARKET: DEALS, FEBRUARY 2021–MARCH 2025


TABLE 204
AEROSPACE TESTING MARKET: EXPANSIONS, FEBRUARY 2021–MARCH 2025


TABLE 205
AEROSPACE TESTING MARKET: OTHER DEVELOPMENTS, FEBRUARY 2021–MARCH 2025


TABLE 206
ELEMENT MATERIALS TECHNOLOGY: COMPANY OVERVIEW


TABLE 207
ELEMENT MATERIALS TECHNOLOGY: PRODUCTS/SOLUTIONS/SERVICES OFFERED


TABLE 208
ELEMENT MATERIALS TECHNOLOGY: DEALS


TABLE 209
ELEMENT MATERIALS TECHNOLOGY: EXPANSIONS


TABLE 210
ELEMENT MATERIALS TECHNOLOGY: OTHER DEVELOPMENTS


TABLE 211
SGS SA: COMPANY OVERVIEW


TABLE 212
SGS SA: PRODUCTS/SOLUTIONS/SERVICES OFFERED


TABLE 213
SGS SA: OTHER DEVELOPMENTS


TABLE 214
SGS SA: EXPANSIONS


TABLE 215
INTERTEK GROUP PLC: COMPANY OVERVIEW


TABLE 216
INTERTEK GROUP PLC: PRODUCTS/SOLUTIONS/SERVICES OFFERED


TABLE 217
INTERTEK GROUP PLC: DEALS


TABLE 218
INTERTEK GROUP PLC: EXPANSIONS


TABLE 219
TÜV SÜD: COMPANY OVERVIEW


TABLE 220
TÜV SÜD: PRODUCTS/SOLUTIONS/SERVICES OFFERED


TABLE 221
APPLUS+: COMPANY OVERVIEW


TABLE 222
APPLUS+: PRODUCTS/SOLUTIONS/SERVICES OFFERED


TABLE 223
APPLUS+: DEALS


TABLE 224
TÜV RHEINLAND: COMPANY OVERVIEW


TABLE 225
TÜV RHEINLAND: PRODUCTS/SOLUTIONS/SERVICES OFFERED


TABLE 226
TÜV RHEINLAND: DEALS


TABLE 227
EUROFINS SCIENTIFIC: COMPANY OVERVIEW


TABLE 228
EUROFINS SCIENTIFIC: PRODUCTS/SOLUTIONS/SERVICES OFFERED


TABLE 229
BUREAU VERITAS: COMPANY OVERVIEW


TABLE 230
BUREAU VERITAS: PRODUCTS/SOLUTIONS/SERVICES OFFERED


TABLE 231
BUREAU VERITAS: DEALS


TABLE 232
BUREAU VERITAS: OTHER DEVELOPMENTS


TABLE 233
DEKRA: COMPANY OVERVIEW


TABLE 234
DEKRA: PRODUCTS/SOLUTIONS/SERVICES OFFERED


TABLE 235
MISTRAS GROUP: COMPANY OVERVIEW


TABLE 236
MISTRAS GROUP: PRODUCTS/SOLUTIONS/SERVICES OFFERED


TABLE 237
THE BOEING COMPANY: COMPANY OVERVIEW


TABLE 238
THE BOEING COMPANY: PRODUCTS/SOLUTIONS/SERVICES OFFERED


TABLE 239
THE BOEING COMPANY: DEALS


TABLE 240
AIRBUS: COMPANY OVERVIEW


TABLE 241
AIRBUS: PRODUCTS/SOLUTIONS/SERVICES OFFERED


TABLE 242
LOCKHEED MARTIN CORPORATION: COMPANY OVERVIEW


TABLE 243
LOCKHEED MARTIN CORPORATION: PRODUCTS/SOLUTIONS/SERVICES OFFERED


TABLE 244
NORTHROP GRUMMAN: COMPANY OVERVIEW


TABLE 245
NORTHROP GRUMMAN: PRODUCTS/SOLUTIONS/SERVICES OFFERED


TABLE 246
COLLINS AEROSPACE: COMPANY OVERVIEW


TABLE 247
COLLINS AEROSPACE: PRODUCTS/SOLUTIONS/SERVICES OFFERED


TABLE 248
COLLINS AEROSPACE: EXPANSIONS


LIST OF FIGURES


FIGURE 1
AEROSPACE TESTING MARKET SEGMENTATION


FIGURE 2
AEROSPACE TESTING MARKET: RESEARCH DESIGN


FIGURE 3
BREAKDOWN OF PRIMARY INTERVIEWS, BY COMPANY TYPE, DESIGNATION, AND REGION


FIGURE 4
APPROACH 1 (SUPPLY SIDE): REVENUE GENERATED BY AEROSPACE TESTING SERVICE PROVIDERS


FIGURE 5
APPROACH 2 (DEMAND SIDE): BOTTOM-UP ESTIMATION BASED ON REGION


FIGURE 6
AEROSPACE TESTING MARKET: BOTTOM-UP APPROACH


FIGURE 7
AEROSPACE TESTING MARKET: TOP-DOWN APPROACH


FIGURE 8
AEROSPACE TESTING MARKET: DATA TRIANGULATION


FIGURE 9
AEROSPACE TESTING MARKET SIZE, 2021–2030


FIGURE 10
AVIONICS/FLIGHT & ELECTRONICS TESTING SEGMENT TO REGISTER HIGHEST CAGR DURING FORECAST PERIOD


FIGURE 11
IN-HOUSE SEGMENT TO CAPTURE LARGER SHARE OF AEROSPACE TESTING MARKET IN 2025


FIGURE 12
COMMERCIAL SEGMENT TO ACCOUNT FOR LARGEST MARKET SHARE IN 2030


FIGURE 13
ASIA PACIFIC TO RECORD HIGHEST CAGR IN AEROSPACE TESTING MARKET FROM 2025 TO 2030


FIGURE 14
INCREASE IN AIR TRAVEL AND INVESTMENT IN MILITARY AND SPACE EXPLORATION PROJECTS TO DRIVE MARKET


FIGURE 15
IN-HOUSE SEGMENT TO ACCOUNT FOR LARGEST MARKET SHARE IN 2025


FIGURE 16
COMMERCIAL TO BE LARGEST END USER OF AEROSPACE TESTING IN 2025


FIGURE 17
MATERIAL TESTING SEGMENT TO HOLD LARGEST MARKET SHARE IN 2025


FIGURE 18
NORTH AMERICA TO CAPTURE LARGEST SHARE OF AEROSPACE TESTING MARKET IN 2025


FIGURE 19
DRIVERS, RESTRAINTS, OPPORTUNITIES, AND CHALLENGES


FIGURE 20
IMPACT ANALYSIS: DRIVERS


FIGURE 21
IMPACT ANALYSIS: RESTRAINTS


FIGURE 22
IMPACT ANALYSIS: OPPORTUNITIES


FIGURE 23
IMPACT ANALYSIS: CHALLENGES


FIGURE 24
TRENDS/DISRUPTIONS INFLUENCING CUSTOMER BUSINESS


FIGURE 25
SUPPLY CHAIN ANALYSIS


FIGURE 26
AEROSPACE TESTING ECOSYSTEM


FIGURE 27
INVESTMENT AND FUNDING SCENARIO, 2019–2024


FIGURE 28
PATENTS APPLIED AND GRANTED, 2015–2024


FIGURE 29
IMPORT DATA FOR HS CODE 8807-COMPLIANT PRODUCTS FOR TOP FIVE COUNTRIES, 2020–2024


FIGURE 30
EXPORT DATA FOR HS CODE 8807-COMPLIANT PRODUCTS FOR TOP FIVE COUNTRIES, 2020–2024


FIGURE 31
PORTER’S FIVE FORCES ANALYSIS


FIGURE 32
INFLUENCE OF STAKEHOLDERS ON BUYING PROCESS FOR TOP THREE END USERS


FIGURE 33
BUYING CRITERIA FOR TOP THREE END USERS


FIGURE 34
ADOPTION OF AI/GEN AI IN AEROSPACE TESTING APPLICATIONS


FIGURE 35
IN-HOUSE SEGMENT TO ACCOUNT FOR LARGER MARKET SHARE IN 2025


FIGURE 36
AVIONICS/FLIGHT & ELECTRONICS TESTING SEGMENT TO REGISTER HIGHEST CAGR DURING FORECAST PERIOD


FIGURE 37
COMMERCIAL SEGMENT TO DOMINATE AEROSPACE TESTING MARKET DURING FORECAST PERIOD


FIGURE 38
AEROSPACE TESTING MARKET, BY REGION


FIGURE 39
INDIA TO EXHIBIT HIGHEST CAGR IN GLOBAL AEROSPACE TESTING MARKET DURING FORECAST PERIOD


FIGURE 40
ASIA PACIFIC TO RECORD HIGHEST CAGR IN AEROSPACE TESTING MARKET DURING FORECAST PERIOD


FIGURE 41
NORTH AMERICA: AEROSPACE TESTING MARKET SNAPSHOT


FIGURE 42
EUROPE: AEROSPACE TESTING MARKET SNAPSHOT


FIGURE 43
ASIA PACIFIC: AEROSPACE TESTING MARKET SNAPSHOT


FIGURE 44
AEROSPACE TESTING MARKET: REVENUE ANALYSIS OF THREE KEY PLAYERS, 2020–2023


FIGURE 45
MARKET SHARE ANALYSIS OF COMPANIES OFFERING AEROSPACE TESTING SERVICES, 2024


FIGURE 46
COMPANY VALUATION


FIGURE 47
FINANCIAL METRICS (EV/EBITDA)


FIGURE 48
BRAND/PRODUCT COMPARISON


FIGURE 49
AEROSPACE TESTING MARKET: COMPANY EVALUATION MATRIX (KEY PLAYERS), 2024


FIGURE 50
AEROSPACE TESTING MARKET: COMPANY FOOTPRINT


FIGURE 51
AEROSPACE TESTING MARKET: COMPANY EVALUATION MATRIX (STARTUPS/SMES), 2024


FIGURE 52
SGS SA: COMPANY SNAPSHOT


FIGURE 53
INTERTEK GROUP PLC: COMPANY SNAPSHOT


FIGURE 54
TÜV SÜD: COMPANY SNAPSHOT


FIGURE 55
APPLUS+: COMPANY SNAPSHOT


FIGURE 56
TÜV RHEINLAND: COMPANY SNAPSHOT


FIGURE 57
EUROFINS SCIENTIFIC: COMPANY SNAPSHOT


FIGURE 58
BUREAU VERITAS: COMPANY SNAPSHOT


FIGURE 59
DEKRA: COMPANY SNAPSHOT


FIGURE 60
MISTRAS GROUP: COMPANY SNAPSHOT


FIGURE 61
THE BOEING COMPANY: COMPANY SNAPSHOT


FIGURE 62
AIRBUS: COMPANY SNAPSHOT


FIGURE 63
LOCKHEED MARTIN CORPORATION: COMPANY SNAPSHOT


FIGURE 64
NORTHROP GRUMMAN: COMPANY SNAPSHOT


Methodology

The research study involved four major steps in estimating the size of the aerospace testing market. Exhaustive secondary research has been done to collect important information about the market and peer markets. The next step has been to validate these findings and assumptions and size them with the help of primary research with industry experts across the value chain. Both top-down and bottom-up approaches have been used to estimate the market size. After this, the market breakdown and data triangulation approaches have been adopted to estimate the market sizes of segments and subsegments.

Secondary Research

In the secondary research process, various secondary sources were referred to to identify and collect information required for this study. The secondary sources include annual reports, press releases, investor presentations of companies, white papers, and articles from recognized authors. Secondary research has been mainly done to obtain key information about the market’s value chain, the pool of key market players, market segmentation according to industry trends, regional outlook, and developments from market and technology perspectives.

In the aerospace testing market report, the global market size has been estimated using the top-down and bottom-up approaches, along with several other dependent submarkets. The major players in the market were identified using extensive secondary research, and their presence in the market was determined using secondary and primary research. All the percentage splits and breakdowns have been determined using secondary sources and verified through primary sources.

Primary Research

Extensive primary research has been conducted after understanding the aerospace testing market scenario through secondary research. Several primary interviews have been conducted with key opinion leaders from demand- and supply-side vendors across four major regions—North America, Europe, Asia Pacific, and RoW. Approximately 25% of the primary interviews have been conducted with the demand-side vendors and 75% with the supply-side vendors. Primary data has been collected mainly through telephonic interviews, which consist of 80% of the total primary interviews; questionnaires and emails have also been used to collect the data.

After successful interaction with industry experts, brief sessions were conducted with highly experienced independent consultants to reinforce the findings of our primary research. This, along with the in-house subject matter experts’ opinions, has led us to the findings as described in the report. The breakdown of primary respondents is as follows:

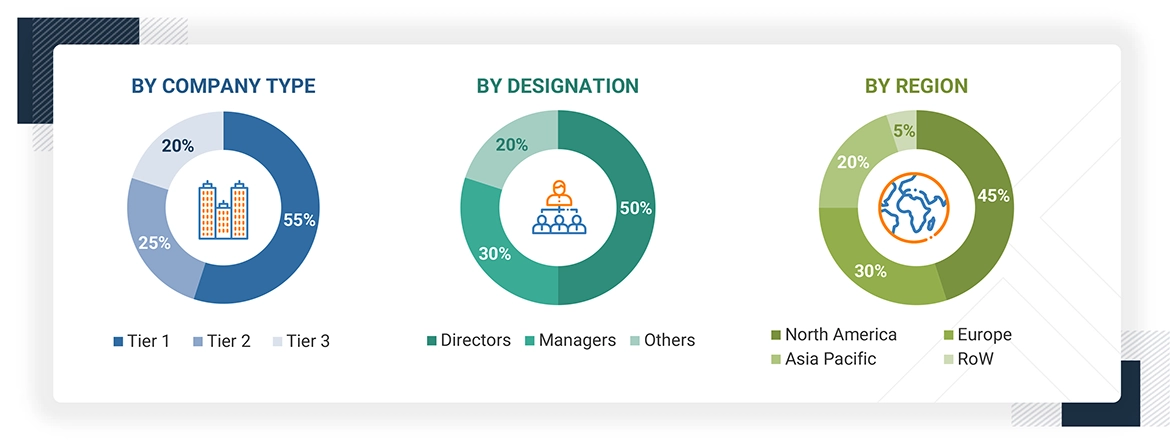
Note: “Others” includes sales, marketing, and product managers

About the assumptions considered for the study, To know download the pdf brochure

Market Size Estimation

In the complete market engineering process, top-down and bottom-up approaches and several data triangulation methods have been used to estimate and forecast the market size for the overall market segments and subsegments listed in this report. Extensive qualitative and quantitative analyses have been performed on the complete market engineering process to list the key information/insights throughout the report. The following table explains the process flow of the market size estimation.

The key players in the aerospace testing market were identified through secondary research, and their rankings in the respective regions were determined through primary and secondary research. This entire procedure involved the study of the annual and financial reports of top players, and interviews with industry experts, such as chief executive officers, vice presidents, directors, and marketing executives, for quantitative and qualitative key insights. All percentage shares, splits, and breakdowns were determined using secondary sources and verified through primary sources. All parameters that affect the markets covered in this research study were accounted for, viewed in extensive detail, verified through primary research, and analyzed to obtain the final quantitative and qualitative data. This data was consolidated, supplemented with detailed inputs and analysis from MarketsandMarkets, and presented in this report.
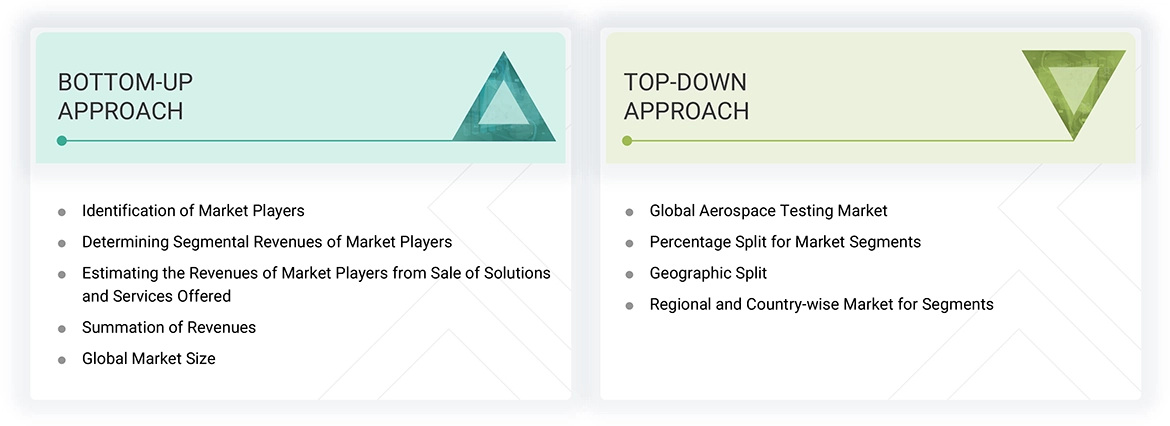
Bottom-Up Approach

  • Major companies that provide aerospace testing services were identified. This included analyzing company portfolios, service offerings, and presence across various regions.
  • The segment-specific revenues of the companies, particularly those related to aerospace testing, were determined.
  • These individual revenue figures were compiled to determine the total revenue generated across the identified companies within the sector.
  • Using this consolidated data, the global market size for aerospace testing was obtained.

Top-Down Approach

  • Estimated the overall aerospace testing market size, then segmented the global market by allocating shares to in-house and outsourced sources to determine the aerospace testing market by sourcing type
  • Estimated the aerospace testing market size by end users by assigning end user penetration splits to the global aerospace testing market based on their respective proportions of testing demand
  • Applied market share splits to the global aerospace testing market to derive the market segmentation, by testing type
  • Distributed the testing types across regions and countries by aligning regional aerospace activity with economic indicators, aerospace manufacturing presence, and national development initiatives

Aerospace Testing Market : Top-Down and Bottom-Up Approach

Data Triangulation

After arriving at the overall market size-using the market size estimation processes as explained above—the market has been split into several segments and subsegments. Data triangulation and market breakdown procedures have been employed to complete the entire market engineering process and arrive at the exact statistics of each market segment and subsegment. The data has been triangulated by studying various factors and trends from the demand and supply sides in the aerospace testing market.

Market Definition

The aerospace sector encompasses designing, developing, producing, and maintaining aircraft (airplanes, helicopters, gliders, and balloons) and spacecraft (satellites, space probes, orbital stations, and shuttles) and their component parts and accessories for civilian and military purposes. In this broader industry, the aerospace testing market is committed to inspecting and verifying these components to determine that they can meet rigorous standards of safety, performance, and regulation. The aerospace testing industry encompasses a wide range of specialist test services, such as material testing to evaluate the strength, durability, and compatibility of materials used; environmental testing to simulate harsh operating conditions, such as temperature, pressure, humidity, and vibration; structural/component testing to validate the integrity and performance of assembled structures and critical components; avionics, flight, and electronics testing to validate reliability and accuracy of onboard systems, sensors, and software; and propulsion system testing to validate engine efficiency, thrust, and operating safety. These testing procedures ensure the early detection of weaknesses or faults, enhancing the overall safety, functionality, and reliability of aerospace systems.

Key Stakeholders

  • Raw Material Suppliers
  • Aerospace Component Manufacturers
  • Testing and Certification Agencies
  • Testing Service Providers
  • Suppliers and Component Manufacturers
  • Research and Development Institutions
  • Regulatory Bodies
  • Consulting Firms
  • Testing Laboratories
  • Military and Defense Agencies
  • Airlines and Operators
  • Industry Associations
  • Investors and Financial Institutions

Report Objectives

  • To define, describe, segment, and forecast the aerospace testing market, testing type, sourcing type, and end user, in terms of value
  • To describe and forecast the market for various segments, with respect to four main regions: North America, Europe, Asia Pacific, and RoW, in terms of value
  • To provide detailed information regarding drivers, restraints, opportunities, and challenges influencing the growth of the aerospace testing market
  • To provide a detailed overview of the aerospace testing market’s supply chain, along with the ecosystem, technology trends, use cases, regulatory environment, and Porter’s five forces analysis for the market
  • To analyze industry trends, patents and innovations, and trade data (export and import data) related to aerospace testing
  • To strategically analyze the micromarkets with respect to individual growth trends, prospects, and contributions to the total market
  • To strategically profile the key players and comprehensively analyze their market share and core competencies
  • To analyze opportunities for stakeholders and provide a detailed competitive landscape of the market
  • To analyze competitive developments, such as solution/service launches/developments, collaborations, agreements, partnerships, acquisitions, and research & development (R&D), carried out by players in the aerospace testing market
  • To profile key players in the aerospace testing market and comprehensively analyze their market ranking based on their revenue, market share, and core competencies

Available Customizations

With the given market data, MarketsandMarkets offers customizations according to the specific requirements of companies. The following customization options are available for the report:

  • Detailed analysis and profiling of additional market players based on various blocks of the supply chain

Personalize This Research

  • Triangulate with your Own Data
  • Get Data as per your Format and Definition
  • Gain a Deeper Dive on a Specific Application, Geography, Customer or Competitor
  • Any level of Personalization
Request A Free Customisation

Let Us Help You

  • What are the Known and Unknown Adjacencies Impacting the Aerospace Testing Market
  • What will your New Revenue Sources be?
  • Who will be your Top Customer; what will make them switch?
  • Defend your Market Share or Win Competitors
  • Get a Scorecard for Target Partners
Customized Workshop Request

Custom Market Research Services

We Will Customise The Research For You, In Case The Report Listed Above Does Not Meet With Your Requirements

Get 10% Free Customisation

Growth opportunities and latent adjacency in Aerospace Testing Market

Turn Research into Strategy in Minutes. Generate 15+ consulting-grade intelligence outputs instantly
Interactive dashboards | Proprietary market intelligence
Try GrowthIQ →
DMCA.com Protection Status