
Surface Treatment Chemical Market

Surface Treatment Chemical Market by Product Type (Plating Chemicals, Conversion Coating, Anodizing Chemicals, Passivation Chemicals, Paint Strippers, Cleaners), Treatment Method, Base Material, End-Use Industry, and Region - Global Forecast to 2032


OVERVIEW
Source: Secondary Research, Interviews with Experts, MarketsandMarkets Analysis
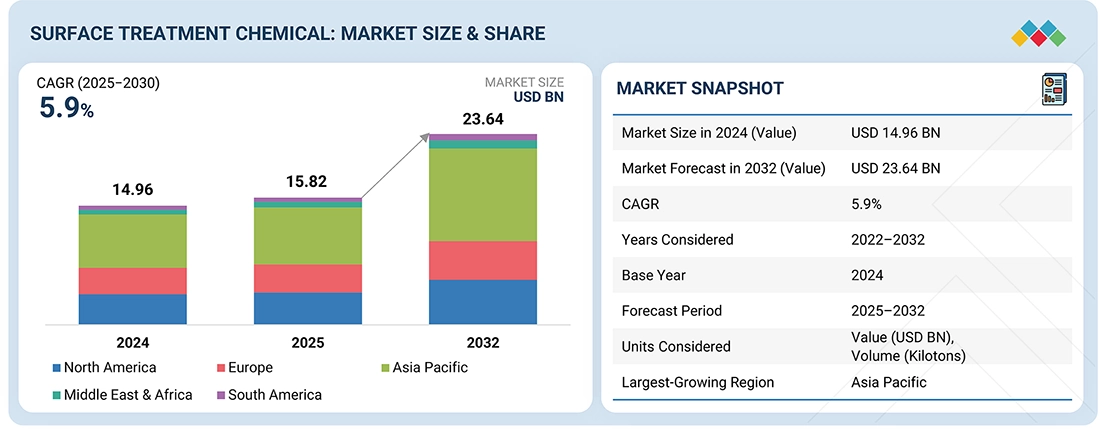
The surface treatment chemical market is projected to reach USD 23.64 billion by 2032 from USD 15.82 billion in 2025, at a CAGR of 5.9% from 2025 to 2032. This growth is primarily fueled by increasing demand from the automotive sector, where surface treatment solutions enhance dhe urability, performance, and sustainability of vehicles in line with evolving industry standards.
KEY TAKEAWAYS
-
By Product TypeAnodizing chemicals are expected to account for the third-highest market share in the surface treatment chemicals market due to their critical role in enhancing the durability, corrosion resistance, and aesthetic appeal of aluminum and its alloys. The growing use of lightweight aluminum in industries such as automotive, aerospace, construction, and consumer electronics is driving demand for anodizing processes that extend material lifespan while maintaining a premium finish.
-
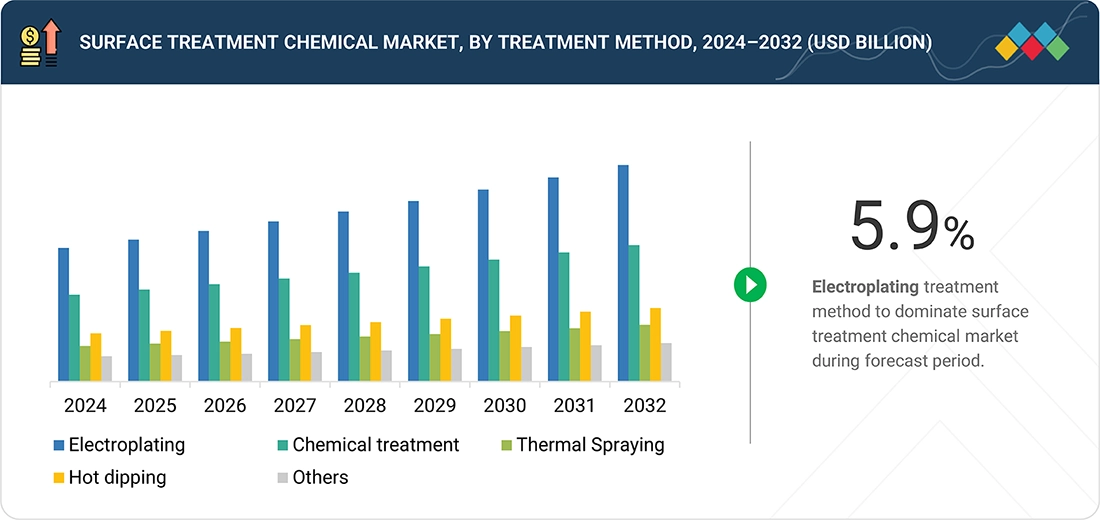
By Treatment MethodHot dipping occupies the third-largest share in the surface treatment chemicals market primarily because of its effectiveness in providing long-lasting corrosion protection, especially for steel and iron substrates. The process, widely known through hot-dip galvanizing, forms a robust metallurgical bond with zinc that significantly enhances durability and reduces maintenance costs over the lifecycle of structures and components.
-
BY Base MaterialComposites are emerging as the second-fastest-growing base material segment in the surface treatment chemicals market, driven by their increasing use in high-performance applications across the automotive, aerospace, wind energy, and electronics sectors. These industries are increasingly shifting toward lightweight, strong, and durable materials to improve fuel efficiency, reduce emissions, and enhance design flexibility—driving demand for specialized surface treatments that can improve adhesion, wear resistance, and longevity of composite structures.
-
By End-Use IndustryThe packaging industry represents the third-largest end-use market for surface treatment chemicals due to the critical need for enhanced durability, hygiene, and barrier properties in both consumer and industrial packaging. Surface treatment chemicals are widely used to improve printability, adhesion, and resistance to moisture, chemicals, and abrasion in materials such as plastics, metals, and paper-based substrates.
-
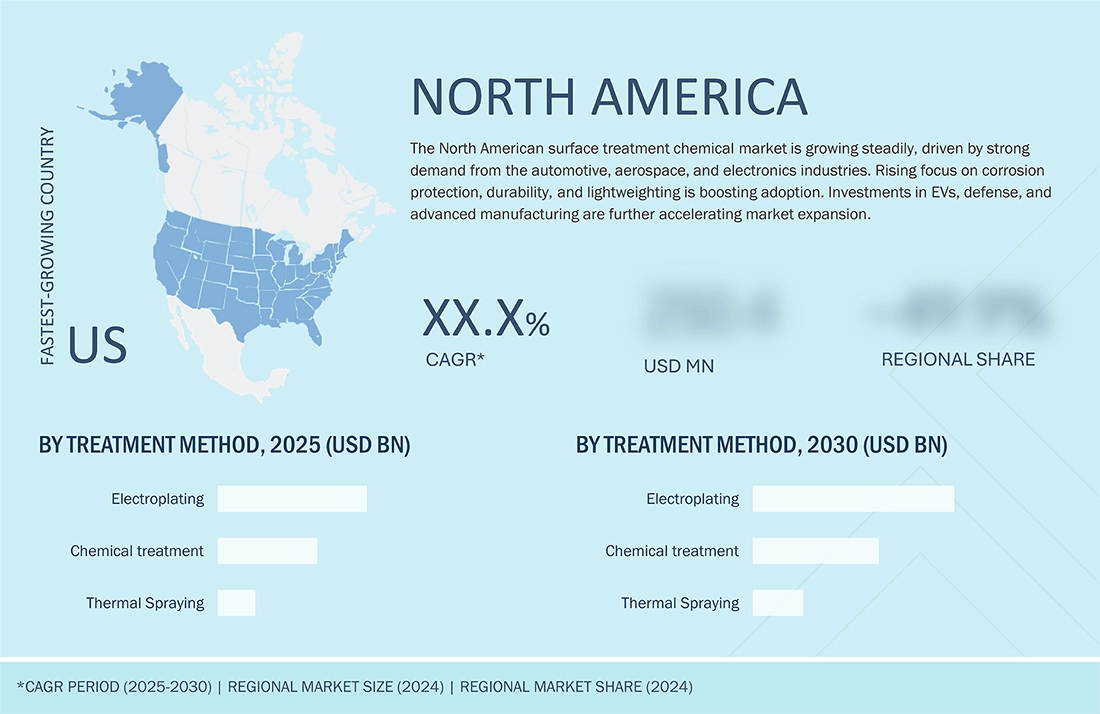
BY REGIONThe surface treatment chemical market covers Europe, North America, Asia Pacific, South America, the Middle East, and Africa. North America is the fastest-growing market for surface treatment chemicals, driven by the presence of leading automotive, aerospace, and electronics manufacturers in the region. The market is further driven by strong regulatory frameworks promoting sustainable and environmentally compliant chemistries, alongside continuous investments in advanced manufacturing and material finishing technologies.
-
COMPETITIVE LANDSCAPEMajor market players are pursuing both organic and inorganic growth strategies, including partnerships, collaborations, and investments, to strengthen their market presence. For instance, Chemetall GmbH (Germany), Henkel AG & Co. KGaA (Germany), Nippon Paint Holdings (Japan), PPG Industries (US), and Nihon Parkerizing (Japan) have engaged in multiple agreements and strategic initiatives to address the rising demand for surface treatment chemicals across automotive, construction, and electronics applications.
The surface treatment chemical market is witnessing steady growth, driven by the rising demand from automotive, construction, and electronics industries for advanced coating and treatment solutions that enhance durability, performance, and corrosion resistance. Ongoing developments, including strategic collaborations between manufacturers and end users, investments in eco-friendly and high-performance formulations, and innovations in nanotechnology-based and sustainable treatment solutions, are reshaping the market landscape.
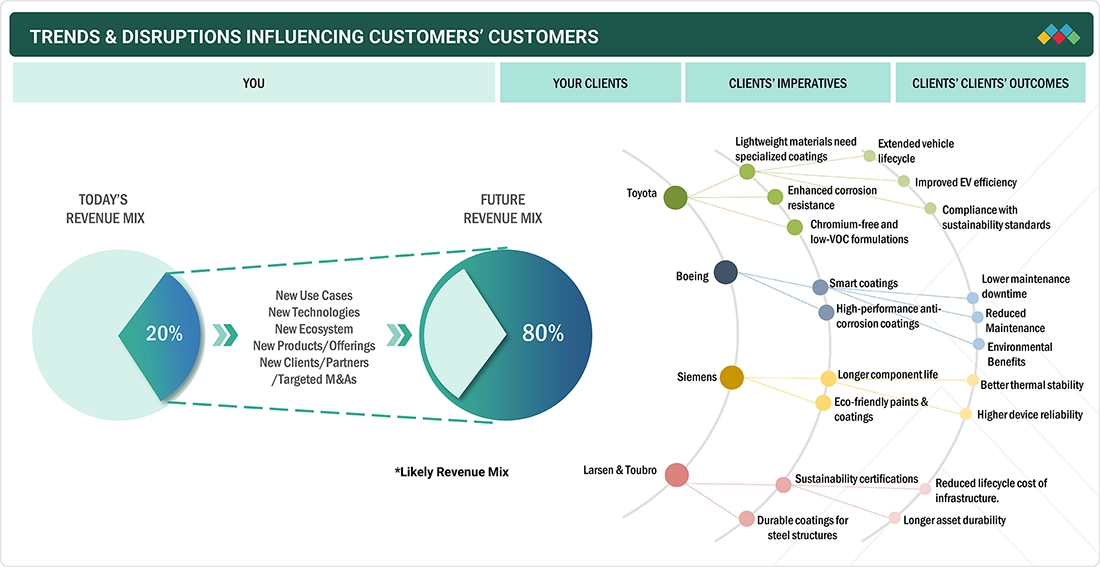
TRENDS & DISRUPTIONS IMPACTING CUSTOMERS' CUSTOMERS
The impact on consumers' business emerges from customer trends or disruptions. Hotbets are clients of surface treatment chemical manufacturers, and target applications are clients of surface treatment chemical manufacturers. Shifts, which are changing trends or disruptions, will impact the revenues of end users. The revenue impact on end users will affect the revenue of hotbets, which will further affect the revenues of surface treatment chemical manufacturers.
Source: Secondary Research, Interviews with Experts, MarketsandMarkets Analysis
MARKET DYNAMICS
Level
-
Robust demand from automotive sector

-
Semiconductor growth creating demand in the market

Level
-
Stringent compliance standards pose barriers to surface treatment chemical market

Level
-
Technological advancements in smart treatments

-
Growing adoption of lightweight aluminum alloys in EVs driving need for specialized pretreatment and coating solutions

Level
-
High costs and technical hurdles in adopting surface treatment chemicals

Source: Secondary Research, Interviews with Experts, MarketsandMarkets Analysis
Driver: Robust demand from automotive sectors
The surface treatment chemicals market is experiencing significant growth, primarily driven by the dynamic evolution of the global automotive industry. The shift toward electric vehicles (EVs) is a key catalyst, as it introduces new material science challenges and demands for specialized chemical solutions. This transformation necessitates the use of lightweight materials like aluminum alloys, which require advanced surface treatments to prevent corrosion, manage galvanic reactions in multi-metal assemblies, and ensure the long-term reliability of sensitive electronic components. The automotive industry is the largest consumer of surface treatment chemicals, with global production volumes providing a massive and consistent demand base, and this foundational demand is now being powerfully augmented by the global shift toward EVs, where the need to treat new materials and manage the complexities of multi-metal assemblies is creating a robust market for innovative, higher-value chemical solutions.
Restraint: Stringent compliance standards pose barriers to surface treatment chemical market
One of the most significant restraints for the surface treatment chemicals market is the tightening global regulatory environment, which is fundamentally reshaping both product portfolios and cost structures. Policymakers and regulatory agencies—including the European Union under REACH (Registration, Evaluation, Authorisation and Restriction of Chemicals) and the US Environmental Protection Agency (EPA)—are progressively restricting or banning substances of very high concern. The phase-out of hexavalent chromium (CrVI) is the most notable example, as it has long been indispensable for corrosion protection in aerospace and automotive applications. With recent bans in the EU and California, manufacturers are being forced into costly reformulations and process overhauls.
Opportunity: Technological advancements in smart treatments
The surface treatment chemicals market is being increasingly shaped by continuous innovation in materials science and chemical engineering, which is unlocking new frontiers in surface performance and creating opportunities for significant value capture. Advances in nanotechnology are enabling the development of ultra-thin coatings that deliver properties unattainable with traditional methods, including exceptional scratch resistance, super hydrophobicity for self-cleaning surfaces, potent anti-microbial functionality, and enhanced UV protection. These high-performance coatings are in growing demand across premium sectors such as consumer electronics, medical devices, and high-end automotive finishes.
Challenge: High costs and technical hurdles in adopting surface treatment chemicals
The surface treatment chemicals market faces mounting challenges as it transitions toward sustainable technologies, with both cost and technical hurdles proving particularly difficult to overcome. Developing, testing, and scaling environmentally friendly formulations requires substantial and long-term R&D investments, while the advanced green alternatives are often more expensive to manufacture than the legacy products they aim to replace. This creates significant cost barriers for adoption, especially in price-sensitive industries and among smaller players that operate on thin margins.
Chemical Surface Treatment Market: COMMERCIAL USE CASES ACROSS INDUSTRIES
| COMPANY | USE CASE DESCRIPTION | BENEFITS |
|---|---|---|
 |
Corrosion protection coatings for car bodies and EV components | Longer vehicle lifespan and compliance with sustainability standards |
 |
Anti-corrosion and thermal barrier coatings for aircraft structures | Enhanced safety and reduced maintenance downtime |
 |
Protective coatings for turbines and electronic components | Improved reliability and operational efficiency |
 |
Anti-corrosion and fire-resistant coatings for steel and concrete structures | Increased durability and reduced lifecycle costs |
Logos and trademarks shown above are the property of their respective owners. Their use here is for informational and illustrative purposes only.
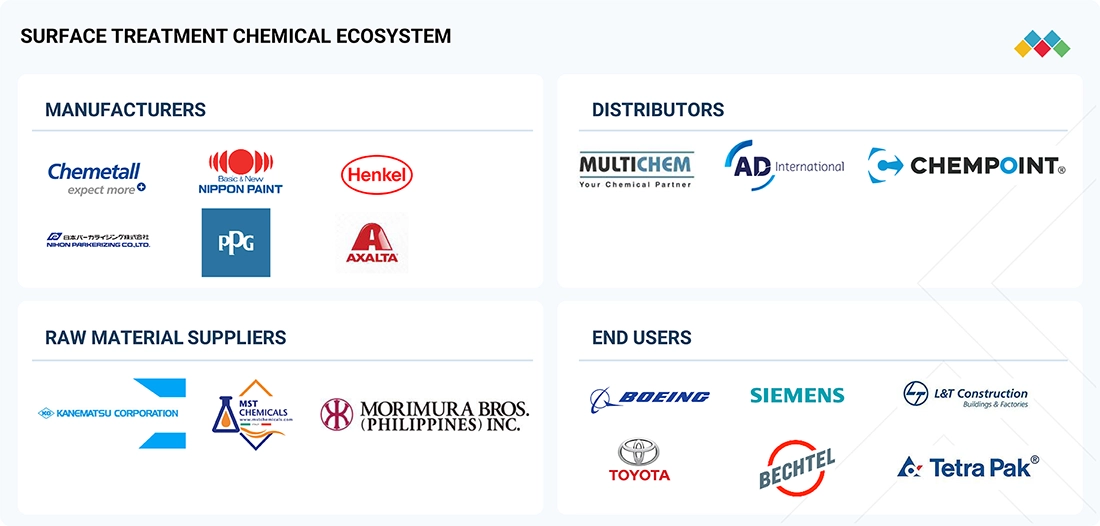
MARKET ECOSYSTEM
The surface treatment chemical market ecosystem consists of raw material suppliers (Kanematsu Corporation, MORIMURA BROS. CO., LTD., MST Chemicals SRL), manufacturers (Henkel AG & Co. KGaA, Chemetall GmbH, MKS Atotech, Nihon Parkerizing, PPG Industries, Nippon Paint Holdings), distributors (Multichem Specialities, AD International, ChemPoint), and end users (Toyota, Boeing, Siemens, Larsen & Toubro, among others). Raw materials, including acids, metal salts, solvents, and specialty additives, are processed into cleaners, conversion coatings, plating solutions, and advanced functional coatings. Manufacturers develop eco-friendly, high-performance formulations, while distributors ensure availability, technical support, and localized expertise. End users across automotive, construction, aerospace, and electronics drive demand for durability, corrosion resistance, regulatory compliance, and sustainability.
Logos and trademarks shown above are the property of their respective owners. Their use here is for informational and illustrative purposes only.
MARKET SEGMENTS
Source: Secondary Research, Interviews with Experts, MarketsandMarkets Analysis
Surface Treatment Chemical Market, By Product Type
Conversion coatings account for the second largest market share in the surface treatment chemical industry because they are widely adopted across multiple end-use sectors, especially automotive, construction, and aerospace. These coatings—such as phosphate, chromate, and oxide layers—are critical for enhancing corrosion resistance, paint adhesion, and durability of metals like steel and aluminum. Their cost-effectiveness, versatility, and ability to serve as a base layer for subsequent coatings make them indispensable in large-scale applications like automotive body panels, aircraft structures, building materials, and industrial machinery.
Surface Treatment Chemical Market, By Treatment Method
Chemical treatment holds the second largest market share by treatment method in the surface treatment chemical industry due to its versatility, cost-effectiveness, and widespread applicability across key end-use sectors such as automotive, aerospace, construction, and electronics. This method—including processes such as pickling, passivation, phosphating, and chemical conversion—enhances corrosion resistance, improves adhesion for subsequent coatings, and extends the service life of metal components. Its ability to treat large volumes of components efficiently makes it ideal for mass production environments, such as automotive body parts, building materials, and electronic components.
Surface Treatment Chemical Market, By Base Material
Metal constitutes the largest share by base material in the surface treatment chemical market due to its widespread use and the specific chemical interactions it enables in surface finishing processes. Metals such as steel, aluminum, zinc, copper, and titanium are highly reactive and can undergo conversion reactions—like phosphating, chromating, and passivation—that form tightly bonded, protective layers on their surfaces. These reactions improve corrosion resistance, enhance adhesion for subsequent paints or coatings, and provide wear resistance critical for high-performance applications. Additionally, metals’ conductive and catalytic properties facilitate uniform electroplating and electrochemical treatments, ensuring consistent coating thickness and improved surface integrity.
Surface Treatment Chemical Market, By End-Use Industry
The transportation sector—including automotive, aerospace, rail, and commercial vehicles—represents the largest end-use market for surface treatment chemicals due to the critical performance requirements of its components. Vehicles and aircraft extensively rely on metals and alloys such as steel, aluminum, and titanium, which must be protected against corrosion, wear, and fatigue. Surface treatment processes like phosphating, chromating, passivation, electroplating, and conversion coatings are essential for forming chemically bonded protective layers that enhance adhesion for paints and coatings, reduce oxidative degradation, and improve resistance to environmental stressors such as humidity, salt, and temperature fluctuations.
REGION
North America to be fastest-growing region in global surface treatment chemical market during forecast period
The North American surface treatment chemical market is expected to register the fastest growing CAGR during the forecast period, driven by strong demand from the automotive, aerospace, and electronics sectors. The region is witnessing increased adoption of advanced coatings, conversion treatments, and electroplating solutions to enhance material durability, corrosion resistance, and performance under stringent operating conditions. Regulatory pressures promoting sustainable, chromium-free, and eco-friendly chemistries are further accelerating the shift toward innovative formulations. In addition, growing investments in electric vehicles, renewable energy infrastructure, and high-tech electronics manufacturing in the US and Canada are creating new growth avenues, positioning North America as the fastest-growing market for surface treatment chemicals.
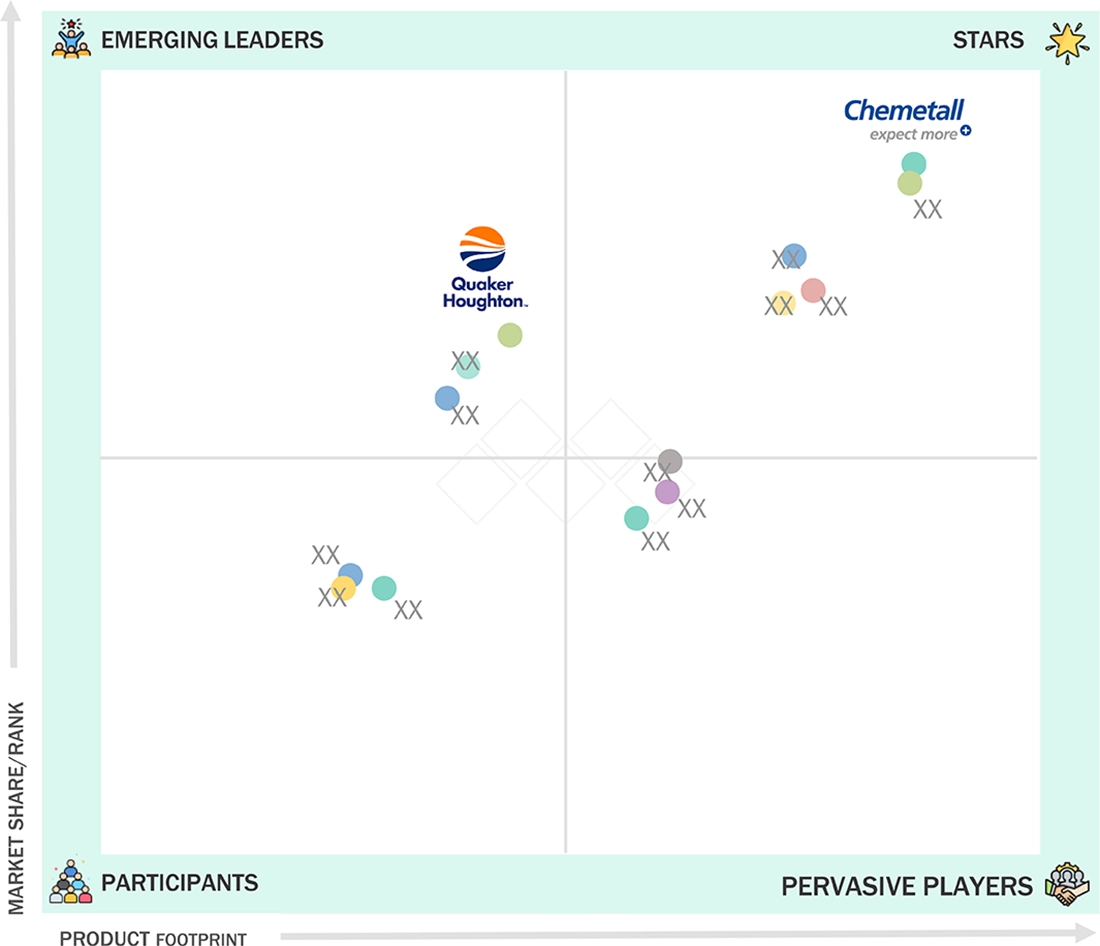
Chemical Surface Treatment Market: COMPANY EVALUATION MATRIX
In the surface treatment chemical market matrix, Chemetall GmbH (Star) leads with a strong market share and extensive product portfolio, driven by its advanced surface treatment solutions—including cleaners, conversion coatings, and functional coatings—widely adopted across automotive, aerospace, and industrial applications. Quaker Houghton (Emerging Leader) is gaining visibility with its specialized chemical formulations and tailored treatment solutions for high-performance applications, strengthening its position through innovation and niche product offerings. While Chemetall GmbH dominates through scale and a diverse product range, Quaker Houghton shows significant potential to move toward the leaders’ quadrant as demand for high-performance, sustainable, and eco-friendly surface treatment solutions continues to rise.
Source: Secondary Research, Interviews with Experts, MarketsandMarkets Analysis
KEY MARKET PLAYERS
MARKET SCOPE
| REPORT METRIC | DETAILS |
|---|---|
| Market Size in 2024 (Value) | USD 13.00 Billion |
| Market Forecast in 2030 (value) | USD 21.51 Billion |
| Growth Rate | CAGR of 6.5% from 2025-2032 |
| Years Considered | 2022-2032 |
| Base Year | 2024 |
| Forecast Period | 2025-2032 |
| Units Considered | Value (USD Million/Billion), Volume (Kiloton) |
| Report Coverage | Revenue forecast, company ranking, competitive landscape, growth factors, and trends |
| Segments Covered | By Product Type: Plating Chemicals, Conversion Coating, Anodizing Chemicals, Passivation Chemicals, Paint Strippers, Cleaners, and Others By treatment Method: Electroplating, Chemical Treatment, Thermal Spraying, Hot Dipping, and Others By Base Material: Metals, Plastics, Wood, Glass, and Composites By End-Use Industry: Transportation, Construction, Electrical & Electronics, Packaging, Industrial Machinery, Textiles, and Other End-use Industries |
| Regions Covered | North America, Asia Pacific, Europe, South America, Middle East & Africa |
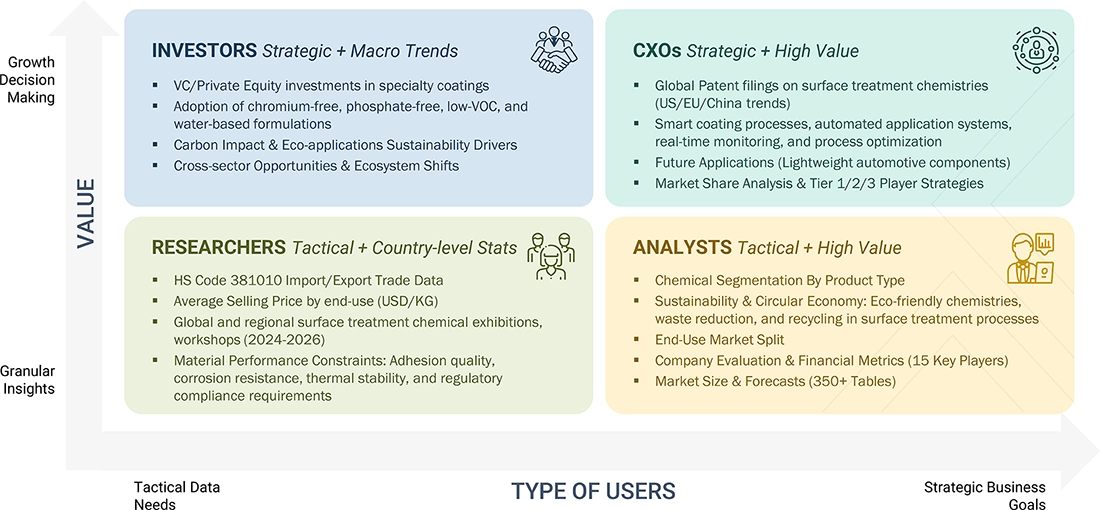
WHAT IS IN IT FOR YOU: Chemical Surface Treatment Market REPORT CONTENT GUIDE
DELIVERED CUSTOMIZATIONS
We have successfully delivered the following deep-dive customizations:
| CLIENT REQUEST | CUSTOMIZATION DELIVERED | VALUE ADDS |
|---|---|---|
| Automotive OEMs | Benchmark surface treatment chemicals across competitors (cleaners, conversion coatings, plating solutions) Map customer adoption trends across EV, ICE, and hybrid platforms Assess supplier partnerships and regional chemical sourcing | Identify cost-effective, high-performance surface treatment options Highlight emerging end-user adoption clusters Enable targeting of sustainable, low-VOC chemistries for regulatory compliance |
| Aerospace Component Manufacturers | Segmentation of surface treatment demand across commercial, defense, and space applications Benchmark adoption vs traditional coatings (chromate, phosphate) Analyze switching barriers (certification, performance, regulatory) | Insights on revenue migration to advanced eco-friendly coatings Pinpoint substitution risks & opportunities in high-performance alloys Enable targeting of premium, high-value aerospace applications |
| Electrical & Electronics OEMs | Technical & economic evaluation of specialty coatings and passivation agents Lifecycle & reliability modeling Forecast surface treatment chemical demand for electronics manufacturing | Support entry into high-tech electronics supply chains Uncover long-term reliability-driven revenue streams Strengthen ESG positioning with eco-friendly formulations |
| Construction & Infrastructure Companies | Global & regional benchmarking of anti-corrosion and fire-resistant coatings Pipeline of new eco-friendly and low-VOC chemical innovations Customer profiling across infrastructure, bridges, pipelines | Strengthen supply chain integration strategy Identify high-demand applications for long-term contracts Assess regional regulatory compliance for competitive advantage |
| Packaging & Consumer Goods Manufacturers | IP landscape & patent mapping for functional coatings in packaging Competitive analysis of chemical treatments for recyclable and biodegradable materials OEM adoption roadmaps for sustainable packaging | Support backward integration with chemical suppliers Identify functional coating applications for product differentiation Secure early-mover advantage in sustainable packaging solutions |
RECENT DEVELOPMENTS
- June 2025 : Nihon Parkerizing Co., Ltd. is setting up a new manufacturing plant in, Chennai, Tamil Nadu, through its consolidated subsidiary Nihon Parkerizing (India) Pvt. Ltd. to strengthen its supply of surface treatment chemicals in southern India. Spanning 76,563 sq. m. with a floor area of 11,490 sq. m., construction will begin in September 2025 and finish by December 2026. Complementing its existing Neemrana, Rajasthan facility, the new plant will boost regional capacity, improve logistics, and support the company’s sustainable growth and global expansion strategy.
- February 2024 : Henkel signed an agreement to acquire Seal for Life Industries, a US-based global supplier of protective coating and sealing solutions serving infrastructure sectors such as renewable energy, oil & gas, and water. Seal for Life reported sales of approximately €250 million in 2023, employs more than 650 people worldwide, and manages well-known brands including STOPAQ, CANUSA, COVALENCE, and LIFELAST. The acquisition will significantly strengthen Henkel’s Adhesive Technologies business, expanding its Maintenance, Repair, and Overhaul (MRO) portfolio with sustainability-driven solutions designed to extend asset life and improve infrastructure resilience.
- february 2024 : Chemetall, BASF’s global surface treatment unit, has opened a new Global Aluminum Competence Center in Giussano, Italy to strengthen its aluminum surface treatment capabilities. The state-of-the-art facility will centralize research and development, enabling faster innovation for anodizing and pretreatment technologies, and helping address complex chemical challenges in aluminum applications for industries such as architecture, aerospace, and automotive.
- February 2024 : MacDermid Enthone Industrial Solutions has opened a new laboratory facility in Nagoya, Japan, marking an important step in expanding local technical support and service for automotive industry partners. The inauguration event featured a ribbon cutting attended by leading company executives, customers, and dignitaries including representatives from the U.S. Consulate in Nagoya. The Nagoya lab enhances MacDermid Enthone’s capabilities to provide Japanese OEMs with access to global manufacturing, testing, and supply chain resources, focusing on sustainable anti-corrosion solutions, advanced trivalent chromium products and industry-leading electroless nickel technologies.
- September 2023 : MacDermid Enthone Industrial Solutions, an Element Solutions Inc company, acquired All-Star Chemical Company's surface finishing and cleaning chemical solutions in early 2024. All-Star’s proprietary products and expertise, especially in metal finishing for automotive and EV sectors, will be integrated into the MacDermid Enthone portfolio, with All-Star's president joining the MacDermid Enthone team. This move strengthens MacDermid Enthone’s offering and commitment to best-in-class customer service and sustainable growth in surface finishing.
Table of Contents
 Exclusive indicates content/data unique to MarketsandMarkets and not available with any competitors.
Methodology
The study involves two major activities in estimating the current market size for the surface treatment chemical market. Exhaustive secondary research was done to collect information on the market, peer market, and parent market. The next step was to validate these findings, assumptions, and sizing with industry experts across the value chain through primary research. Both top-down and bottom-up approaches were employed to estimate the complete market size. After that, market breakdown and data triangulation were used to estimate the market size of segments and subsegments.
Secondary Research
Secondary sources referred to for this research study include financial statements of companies offering surface treatment chemical and information from various trade, business, and professional associations. Secondary research has been used to obtain critical information about the industry’s value chain, the total pool of key players, market classification, and segmentation according to industry trends to the bottom-most level and regional markets. The secondary data was collected and analyzed to arrive at the overall size of the surface treatment chemical market, which was validated by primary respondents.
Primary Research
Extensive primary research was conducted after obtaining information regarding the surface treatment chemical market scenario through secondary research. Several primary interviews were conducted with market experts from both the demand and supply sides across major countries of North America, Europe, Asia Pacific, Middle East & Africa, and South America. Primary data was collected through questionnaires, emails, and telephonic interviews. The primary sources from the supply side included various industry experts, such as Chief X Officers (CXOs), Vice Presidents (VPs), Directors from business development, marketing, product development/innovation teams, and related key executives from surface treatment chemical industry vendors; material providers; distributors; and key opinion leaders. Primary interviews were conducted to gather insights such as market statistics, data on revenue collected from the products and services, market breakdowns, market size estimations, market forecasting, and data triangulation. Primary research also helped in understanding the various trends related to product type, treatment method, base material, end-use industry, and region. Stakeholders from the demand side, such as CIOs, CTOs, CSOs, and installation teams of the customer/end users who are seeking surface treatment chemical services, were interviewed to understand the buyer’s perspective on the suppliers, products, component providers, and their current usage of surface treatment chemical and future outlook of their business which will affect the overall market.
Breakup of Primary Research

To know about the assumptions considered for the study, download the pdf brochure
Market Size Estimation
The research methodology used to estimate the size of the surface treatment chemical market includes the following details. The market sizing of the market was undertaken from the demand side. The market was upsized based on the demand for surface treatment chemicals in different end-use industries at a regional level. Such procurements provide information on the demand aspects of the surface treatment chemical industry for each end-use industry. For each end-use, all possible segments of the surface treatment chemical market were integrated and mapped.

Data Triangulation
After determining the overall size from the market size estimation process explained above, the total market was divided into several segments and subsegments. The data triangulation and market breakdown procedures explained below were implemented, wherever applicable, to complete the overall market engineering process and arrive at the exact statistics for various market segments and subsegments. The data was triangulated by studying various factors and trends from the demand and supply sides. Along with this, the market size was validated using both the top-down and bottom-up approaches.
Market Definition
The surface treatment chemical market encompasses a broad range of chemical formulations and solutions used to modify, enhance, or protect the surface properties of materials, primarily metals, plastics, ceramics, and composites. These chemicals are designed to enhance the durability, corrosion resistance, adhesion, lubricity, and functional performance of substrates in various industrial, automotive, aerospace, electronics, medical, and other end-use applications. Surface treatment chemicals play a critical role in preparing materials for further processing or finishing, such as coating, painting, plating, or bonding. They can be applied through various treatment methods, including electroplating, chemical treatment, thermal spraying, hot dipping, and plasma treatment, among others.
Each method relies on specific chemical formulations tailored to the substrate and desired outcome, such as passivation solutions, conversion coatings, cleaning agents, pickling acids, and functional coatings. The market encompasses chemicals for pre-treatment, which clean and activate the surface to enhance adhesion; coating and finishing, which provide protective or decorative layers; and functional modification, which imparts properties such as hydrophobicity, antimicrobial characteristics, or electrical conductivity. Surface treatment chemicals are widely used across industries, including automotive, aerospace, construction, electronics, medical and pharmaceutical devices, and heavy machinery, reflecting the increasing demand for high-performance, long-lasting, and environmentally compliant materials.
Stakeholders
- Surface Treatment Chemical Manufacturers
- Surface Treatment Chemical Distributors and Suppliers
- End-use Industries
- Universities, Governments, and Research Organizations
- Associations and Industrial Bodies
- R&D Institutes
- Environmental Support Agencies
- Investment Banks and Private Equity Firms
- Research and Consulting Firms
Report Objectives
- To define, describe, and forecast the surface treatment chemical market size in terms of volume and value
- To provide detailed information regarding the key factors, such as drivers, restraints, opportunities, and challenges influencing market growth
- To analyze and project the global surface treatment chemical market, by product type, by treatment method, by base material, by end-use industry, and by region
- To forecast the market size concerning five main regions (along with country-level data), namely, North America, Europe, Asia Pacific, Middle East & Africa, and South America, and analyze the significant region-specific trends
- To strategically analyze micromarkets with respect to individual growth trends, prospects, and contributions of the submarkets to the overall market
- To analyze the market opportunities and the competitive landscape for stakeholders and market leaders
- To assess recent market developments and competitive strategies, such as agreements, contracts, acquisitions, partnerships & collaborations, and new product developments/new product launches, to draw the competitive landscape
- To strategically profile the key market players and comprehensively analyze their core competencies
Key Questions Addressed by the Report
Which are the major companies in the Surface Treatment Chemical Market?
Major companies include Henkel AG & Co. KGaA, PPG Industries, BASF SE, Nippon Paint Holdings, Element Solutions Inc., and Quaker Houghton.
Which end users in the Surface Treatment Chemical Market are likely to exhibit the highest CAGR during the forecast period?
Automotive, aerospace, electronics, and industrial machinery manufacturers are expected to exhibit the highest CAGR due to increasing demand for corrosion protection and surface durability.
Which offerings in the Surface Treatment Chemical Market are likely to drive growth over the coming years?
Cleaners, plating chemicals, and conversion coatings are expected to drive growth as they improve adhesion, corrosion resistance, and surface performance.
What are the drivers and opportunities for the Surface Treatment Chemical Market?
The market is driven by growing automotive production, demand for corrosion-resistant materials, industrial expansion, and the development of eco-friendly and low-VOC treatment chemicals.
What are the restraints and challenges for the players in the Surface Treatment Chemical Market?
Key challenges include strict environmental regulations, hazardous chemical handling concerns, and volatility in raw material prices.
Need a Tailored Report?
Customize this report to your needs
Get 10% FREE Customization
Customize This ReportPersonalize This Research
- Triangulate with your Own Data
- Get Data as per your Format and Definition
- Gain a Deeper Dive on a Specific Application, Geography, Customer or Competitor
- Any level of Personalization
Let Us Help You
- What are the Known and Unknown Adjacencies Impacting the Surface Treatment Chemical Market
- What will your New Revenue Sources be?
- Who will be your Top Customer; what will make them switch?
- Defend your Market Share or Win Competitors
- Get a Scorecard for Target Partners

Custom Market Research Services
We Will Customise The Research For You, In Case The Report Listed Above Does Not Meet With Your Requirements
Get 10% Free CustomisationTESTIMONIALS

We at Nissan Chemicals Corporation have been clients of MarketsandMarkets for more than a year now. We recently consulted MarketsandMarkets for a study, the team at MarketsandMarkets was extremely professional and organized. The business insights were very detailed and aligned well with our expectations that really helped us formulate the Business Plans and device new strategies for development themes. MarketsandMarkets offers a unique combination of expertise and dedicated engagement model. Their research findings have helped us in designing our Pricing Strategy which will make it easier for us to predict the future sales and profits for the next ten years. We look forward to working with MarketsandMarkets in the future.
VP of Strategy & New Business Development
Leading Specialty Chemical Company
The MarketsandMarkets Engagement Model, composed of both the Knowledge Store and advisory custom research, has greatly helped us in understanding our markets and making strategic decisions. The Knowledge Store is a fast way to allow everyone in our organization to understand more about most any market they are interested in. The ability to then get custom research done and get answers to specific strategic questions and market insight has been spectacular. The Markets and Markets team feel more like colleagues than vendors and their services have helped us change our culture where statements of things like growth opportunities and competitive position are always backed by industry research.

Rich Gibson,
Director, Corporate Strategy
Milliken & Company,
Leading Industrial Manufacturer of specialty chemical, floor covering, performance and protective textile materials, and healthcaremilliken.com
MarketsandMarkets is a trusted resource that helps us to better understand markets that are near-adjacencies-whether its technology, value chain or geography. Their Knowledge Store platform provides a dashboard of markets and their characteristics which is easy to use and saves us time.
Adam Shaw,
Market Development and Strategy Manager
AdvanSix Inc. USA,
An American Leader in Chemicalswww.advansix.com
The Knowledge Store from MarketsandMarkets is a valuable tool which has helped my team acquire greater insight in to the end markets that our business serves. This has enabled us to help our company build stronger strategies throughout our planning process.
TOSHIO KINOSHITA
Senior Chif Consultion Research & Consulting Division
Mitsubishi Chemical Research Corporation,
Leading Manufacturer of Chemical Productswww.mitsubishichem-res.co.jp/en/

We recently engaged with MarketsandMarkets for a study, the team not only clearly understood our business objectives but was also extremely professional in the way they handled the entire project. The study was efficiently conducted in a phase-wise manner, and the engagement model furnished us with high-quality business insights that far exceeded our expectations at each phase. We were especially happy that MarketsandMarkets could provide us with both, an English as well as a Japanese version of the study. A special thanks to the Analyst Team and Client Services Team, whose fluency in Japanese enhanced our comfort level, as we could converse with them in our preferred language.
Independent entrepreneurs
Arrow Precision
We approached MarketsandMarkets for study on Proppants Market, and their work exceeded our expectations. The study conducted was comprehensive and enabled us to view the market through the various dimensions. In addition, the team was extraordinarily responsive throughout the process and resolved our queries on time. I strongly recommend MarketsandMarkets and will certainly consider them for additional market assessments we will need in the future.
Global engineering company, Japan
Deputy Manager,
Strategic Planning OfficeThe high-quality insights shared by the MarketsandMarkets team helped us understand the pharmaceutical plant designers in a specific geography. It also captured the risks that we may likely face in communicating with our potential partners. The study would enable us identify partners, which would impact our future growth.


Growth opportunities and latent adjacency in Surface Treatment Chemical Market