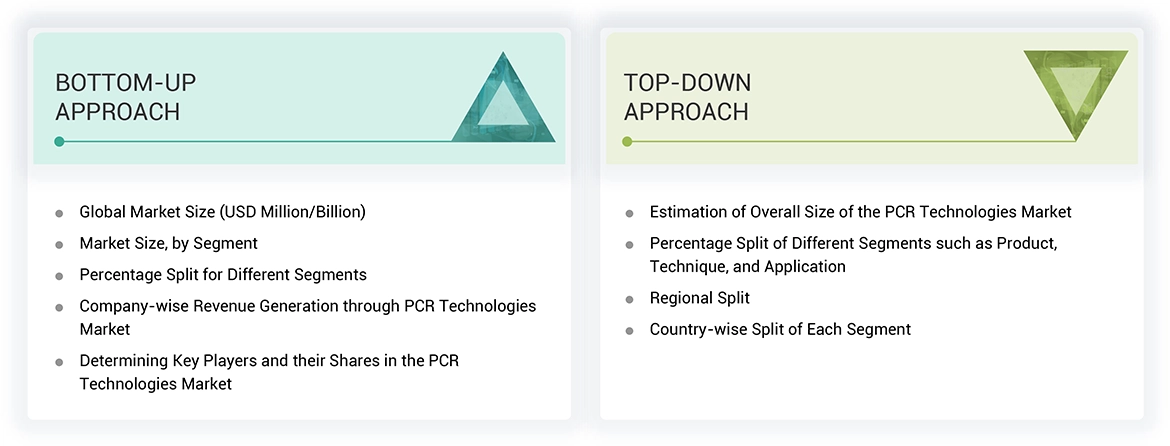
PCR Technologies Market

PCR Technologies Market by Technique (Conventional, qPCR, dPCR), Product (Instrument, Reagents, Software), Application (Genotyping, Sequencing, Gene Expression, Diagnostics), End User (Academia, Pharma-Biotech, Applied) - Global Forecast to 2027

Report Code: AST 7880 Nov, 2022, by marketsandmarkets.com

[245 Pages Report] The global market is projected to reach USD 18.3 billion by 2027 from USD 12.5 billion in 2021, at a CAGR of 8.0% during the forecast period.

The growth of the global PCR technologies market can be attributed to factors such as the rise in the target infectious disease and genetic disorder incidences, ongoing developments in PCR technologies and increasing funding and investments. In addition, growing market penetration in emerging countries are expected to offer growth opportunities for players in the PCR technologies market. However, issues related to high device costs associated with dPCR and the technical limitations of qPCR and dPCR are expected to affect the growth of the PCR technologies market during the forecast period.

Attractive Opportunities in the PCR technologies Market

PCR Technologies Market

To know about the assumptions considered for the study, Request for Free Sample Report

PCR technologies Market Dynamics

Driver: Increasing investments, funds, and grants

The increasing consumer demand for early disease diagnosis and treatment has driven the pace of R&D in innovative genetic technologies and product development. This rise in R&D activity is supported by an increase in investments and the availability of funds and grants. For instance, in April 2017, Mobidiag Ltd. (Finland) received ~USD 4.3 million (EUR 3.9 million) from 300 investors for R&D into innovative in vitro diagnostic solutions. In the same month, ThermaGenix Inc. (US) raised USD 1.5 million in series A-1 funding to support PCR product R&D. In addition, in March 2018, West German Genome Center (WGGC) and the Universities of Cologne, Bonn, and Düsseldorf (Germany), received ~USD 5.98 million (EUR 5.3 million) for a joint competence center from the German Research Foundation (DFG).

Government and federal agencies across the globe are increasingly recognizing the role played by qPCR and dPCR products (such as instruments, reagents, and software) in genomics-based research. In the last decade, the qPCR and dPCR market has witnessed several funding initiatives by government and private agencies to support genomic research. In February 2019, Genome Canada partnered with the Canadian federal government and various provincial governments, businesses, and research groups. Under this partnership, Genome Canada received ~USD 42.6 million (CAD 56 million) in funding for projects in the field of bioinformatics and genomics in human health, agriculture, and the environment (Source: Genome Canada and Canada's Ministry of Science). Mentioned below are some of the other important developments in this regard:

  • In October 2020, Visby Medical (US), an infectious disease diagnostic company, received Phase 2 funding from the National Institutes of Health (NIH) as part of its Rapid Acceleration of Diagnostics (RADx) initiative.
  • In February 2019, Centre d’innovation Génome Québec et Université McGill (Canada) received ~USD 10 million in funding from federal and provincial investments. The funding will be utilized for various projects in the field of bioinformatics, epigenomics, and precision medicine, among other fields (Source: McGill University, Canada).

These initiatives are aimed at conducting medical genomics-based studies in personalized medicine, including PCR-based disease diagnosis and treatment. Thus, with the growing availability of financial support for sustaining R&D in disease-targeted genomics research activities, the demand for PCR products is expected to increase in the coming years.

Restraint: High device costs associated with dPCR

A typical PCR analysis conducted through dPCR instruments integrates several scientific technologies (PCR, microfluidics, and nanofabrication) to attain the required process outcome. These instruments are small and reduce cycle times. However, the development of such devices requires nanoscale level scientific validation and large investments. Moreover, dPCR is a supposedly recent PCR technology; as a result, most manufacturers often price their state-of-the-art dPCR instruments at a premium (~USD 120,000) compared to qPCR instruments (~USD 90,000).

For instance, the average price of a dPCR instrument in the US is reported to be USD 55,000–120,000, as of July 2022, based on the instrument design and target application base. Such high prices have resulted in restricted demand for dPCR instruments and reagents among the end-users who in turn prefer cheaper genomic techniques (such as gel electrophoresis and traditional PCR), especially among institutional researchers and small CROs and pharma & biotech companies.

Opportunity: Growing market penetration in emerging countries

Significant growth opportunities are offered by the emerging markets, led by the rising incidence of infectious and chronic diseases, resulting in increased R&D projects to develop innovative genomic techniques such as PCR. Also emerging countries are witnessing rapid modernization in healthcare facilities and the expansion of healthcare infrastructure. This factor is contributing to the growing demand for clinical diagnostic procedures among diagnostic laboratories, which is resulting in increased sales of clinical PCR products. Further increase in healthcare expenditure, and reducing procedural costs for qPCR-based and dPCR-based disease diagnosis will fuel the growth in emerging countries.

To meet the growing demand for PCR products in emerging markets, prominent reagent manufacturers are focusing on inorganic strategies (such as partnerships and collaborations) to strengthen their distribution networks and enhance their manufacturing capabilities. For instance, as of March 2022, >2,700 biotechnology-based start-ups are active in India, and this number is estimated to reach 10,000 by 2024. In 2022, India's biotechnology industry crossed USD 80.12 billion, growing 14% from the previous year and becoming the third-largest biotech destination in the Asia Pacific Region (Source: Invest India).

The increasing competition in mature markets is affecting the revenue growth of global players. This will prompt them to focus on emerging markets for generating additional revenue.

Challenge:  Adoption and implementation of MIQE guidelines

Globally, the use of PCR techniques is to some degree unregulated, which has made end users reluctant to use PCR products for genomic and diagnostic applications. This is mainly due to a uneven consensus that exists for the method by which qPCR/dPCR experiments should be conducted to obtain quality results in a time-bound manner. However, guidelines are being developed that could define and streamline the requirements needed to carry out a PCR-based genomic procedure in a scientific manner with efficient data generation and interpretation.

In this regard, the Minimum Information for the Publication of Quantitative Real-time PCR Experiments (MIQE) guidelines were published in the Journal of Clinical Chemistry (April 2009). This included instructions for the development and evaluation of a qPCR-based experiment and its generated data. The main challenge however is for its global adoption, as it includes laborious preparation and considerations prior to performing the actual PCR procedure. These considerations applies to reactant quality, sample storage conditions and extraction method, among other factors. These factors have limited the implementation of MIQE guidelines among researchers.

However, the situation is changing. In 2020, the dMIQE guidelines were updated in order to simplify the reproducibility of dPCR experiments. As a result, in the last two years, there has been a boom in the use of qPCR and dPCR.

PCR technologies Market Ecosystem:

PCR Technologies Market Ecosystem

Source: Knowledge Store

The Reagents and Consumables segment accounted for the largest share of the global PCR technologies market, by product, in 2021

Reagents and Consumables segment includes PCR reagents (such as supermixes, enzymes, and specific detection agents) and consumables (such as reaction tubes, needles, and vials) required during a typical PCR analysis procedure. For example, a typical qPCR reagent includes master mixes comprising reaction components (such as dyes, buffers, and probes) that are mixed in a specific proportion or core kits comprising reaction components (buffers, DNA polymerases, dNTPs, DNA-binding dyes, and sequence-specific probes) that are required for a qPCR reaction.

The sale of PCR reagents through various approaches by prominent players (such as bundled sales of PCR reagents for 3–5 years along with the purchase of PCR instruments; long-term sales contracts for PCR reagents upon device upgradation; and bundled sales of related consumables on the long-term purchase of PCR reagents) is also a major factor driving the demand and adoption of PCR reagents and consumables in major markets such as Europe, the US, Japan, China, and India.

The reagents and consumables segment also includes assay reagents for endpoint detection. The growth of the PCR reagents and consumables market will be driven by the expanding applications of dPCR, increasing number of dPCR-based analytical procedures among institutional researchers (such as CROs and pharma-biotech companies), and the rising availability of novel dPCR reagents worldwide. Additionally, the expansion of the application base of the dPCR technology in genetic/molecular research, clinical diagnosis, and forensics is expected to result in the commercialization of novel dPCR reagents. For instance, Bio-Rad Laboratories launched the QXDx BCR-ABL %IS Kit in 2019, while Fluidigm Corporation launched the X9 Real-Time PCR System, an innovative and flexible high-capacity genomics platform, in 2022.

The limited volume consumption of dPCR reagents during genomic analysis procedures (as compared to qPCR and other PCR technologies) and the continuous decline in qPCR reagent costs across major markets (owing to the greater market competition and pricing pressure) are expected to restrain the growth of this market during the forecast period.

The qPCR segment, by technique, accounted for the largest share of the global PCR technologies market in 2021

Quantitative PCR also called real-time PCR, is a well-established PCR technique that monitors DNA identification, amplification, and quantification. It involves the real-time analysis of reaction mixtures with the aid of fluorescent markers. The qPCR technique has several technical benefits over traditional conventional PCR, such as an increased range of target detection, real-time monitoring, data collection during the exponential phase of the reaction cycle, no post-procedure processing, time efficiency, and kinetics measurement in the early phases of the reaction.

The qPCR segment is expected to dominate this market during the forecast period owing to factors such as the ongoing automation of laboratory techniques (including the integration of robotics with qPCR); growing adoption of qPCR among researchers and healthcare professionals; increased funding, grants, and public-private investments for qPCR-based research; and the large installation base of qPCR instruments (as compared to dPCR instruments). However, one problem with the use of qPCR is that it is very easy to produce numbers that can then readily be interpreted as quantitative results and can be equally misleading because quality control and further analysis may be required to differentiate between potential artifacts caused by inappropriate assay design, execution, or data analysis.

Over the last few years, device manufacturers have witnessed a significant surge in the adoption of technologically advanced qPCR instruments (such as automated qPCR instruments and robotic qPCR devices) owing to the various procedural benefits offered by them. For instance, robotic qPCR devices offer several benefits as compared to conventional qPCR instruments, including reduced procedural costs, lower reaction time, minimized manual errors, improved productivity, and no risk of external contamination. However, the growth of the qPCR market will be restrained to a certain extent during the forecast period owing to the growing acceptance of dPCR in genomics research and the availability of alternative technologies for clinical diagnosis (such as microbial testing/detection, point-of-care devices, and blood screening products). Furthermore, the entry of a large number of small-scale and local reagent manufacturers in emerging countries is expected to pose a major challenge to existing market players.

On the basis of End Users, hospitals and diagnostic centers segment accounted for the largest share of the global PCR technologies market, in 2021.

The major end users of PCR technologies include hospitals and diagnostic centers, healthcare industry, academia and government organizations, pharma-biotech companies, applied industries, and other end users. The hospitals and diagnostic centers segment accounted for the largest share of the PCR technologies market in 2021. The increasing market availability of qPCR reagents for clinical diagnosis, ongoing expansion of healthcare infrastructure in emerging APAC and Eastern European countries, and the continuous reduction in the cost of qPCR reagents are some of the factors driving the segment.

The hospitals and diagnostic centers segment comprises in-house diagnostic and clinical research centers within hospitals, intendant diagnostic and pathology centers, and reference laboratories (which work for small hospitals, independent physicians, and community clinics). These end users use techniques such as qPCR and dPCR for the diagnosis of target diseases and disorders (such as cancer, HIV-AIDS, genetic disorders, infectious diseases, and other chronic diseases).

In hospitals and diagnostic centers, PCR technologies are used for viral load testing, genetic testing, profiling of embryo DNA before in vitro fertilization, and organ/tissue transplant procedures. The increasing market availability of qPCR reagents, expansion of healthcare infrastructure across emerging countries, high prevalence and incidence of target diseases, and the growing awareness among end users related to the benefits offered by qPCR in rapid and effective disease diagnosis are some of the major factors driving market growth in this end-user segment.

However, the high costs associated with PCR products (including instruments, reagents, and software) and the limited availability of specific PCR reagents and assays for the clinical diagnosis of infectious diseases and blood screening are expected to restrain the growth of this market during the forecast period.

PCR Technologies Market by Region

To know about the assumptions considered for the study, download the pdf brochure

The Asia Pacific market is expected to grow at the highest CAGR during the forecast period

The global PCR technologies market is segmented into North America, Europe, the Asia Pacific, Latin America, and the Middle East & Africa. In 2021, North America accounted for the largest share of 36.6% of the global PCR technologies market, followed by Europe. On the other hand, the Asia Pacific is expected to grow at the fastest CAGR during the forecast period. The high growth of this segment is mainly attributed to the ongoing expansion & modernization of healthcare infrastructure in emerging Asian countries, increasing number of research projects in China, India, and Japan in the fields of genomics and cancer, rising outsourcing of clinical research to Asia-based CROs by leading drug manufacturing companies, and continuous government support for genomics-based research activities in emerging Asia Pacific countries.

The Asia Pacific market includes Japan, China, India, Australia, South Korea and rest of Asia Pacific countries. Factors such as the sustained economic growth in several Asia Pacific countries and the rising disposable income levels of the middle-class population have resulted in significant growth in healthcare spending in this region. Moreover, healthcare infrastructure modernization, increasing penetration of cutting-edge diagnostic technologies (including dPCR and qPCR) for research and clinical applications, growing awareness among physicians and healthcare professionals about the benefits of gene-based disease diagnosis and treatment, and the increasing public-private support to develop novel PCR technologies in Asia Pacific countries are expected to support market growth in the region during the forecast period.

However, the dearth of skilled technicians and the high cost of PCR instruments are the major factors that are expected to limit the adoption of these instruments in price-sensitive Asia Pacific markets in the coming years.

Key Market Players

Prominent players in the point-of-care diagnostics market include Thermo Fisher Scientific, Inc. (US), F. Hoffman-La Roche Ltd. (Switzerland), Bio-Rad Laboratories, Inc. (US), QIAGEN N.V. (Germany), Takara Bio, Inc. (Japan), Agilent Technologies, Inc. (US), bioMérieux S.A. (France), Fluidigm Corporation (US), Danaher Corporation (US), Abbott Laboratories (US), Merck KGaA (Germany), Becton Dickinson and Company (US), Promega Corporation (US), Eppendorf AG (Germany), and Analytik Jena AG (Germany).

Thermo Fisher Scientific:

Thermo Fisher Scientific is one of the leading players in the field of healthcare and life science research. The company possesses a robust product portfolio in the PCR segment and a strong market presence globally, with sales and distribution networks in more than 50 countries. It focuses on strengthening its position in this market by adopting various growth strategies (such as product launches & approvals, acquisitions, and partnerships). The company mainly focuses on launching new products and strategic acquisitions to strengthen its market position and expand its product portfolio with technologically advanced products. The company also focuses on research partnerships with leading organizations to strengthen its research and product development capabilities in the field of dPCR and qPCR technologies.

Get online access to the report on the World's First Market Intelligence Cloud

  • Easy to Download Historical Data & Forecast Numbers
  • Company Analysis Dashboard for high growth potential opportunities
  • Research Analyst Access for customization & queries
  • Competitor Analysis with Interactive dashboard
  • Latest News, Updates & Trend analysis
Request Sample

Scope of the Report

Report Metric

Details

Market size available for years

2020–2027

Base year considered

2021

Forecast period

2021–2027

Forecast units

Value (USD Billion)

Segments covered

Product, Technique, Application, End User, and Region

Geographies covered

North America, Europe, Asia Pacific, Latin America, and the Middle East & Africa

Companies covered

Prominent players in the PCR technologies market include F. Hoffman-La Roche Ltd. (Switzerland), Thermo Fisher Scientific, Inc. (US), Bio-Rad Laboratories, Inc. (US), QIAGEN N.V. (Netherlands), Takara Bio, Inc. (Japan), Agilent Technologies, Inc. (US), bioMérieux S.A. (France), Fluidigm Corporation (US), Danaher Corporation (US), Abbott Laboratories (US), Merck KGaA (Germany), Becton, Dickinson and Company (US), Promega Corporation (US), Eppendorf AG (Germany), and Analytik Jena AG (Germany).

Other players in the market include Meridian Bioscience Inc. (US), Stilla Technologies (France), JN Medsys (Singapore), Avance Biosciences Inc. (US), LGC Biosearch Technologies (UK), Azura Genomics Inc. (US), Bioneer Corp. (South Korea), Blue-Ray Biotech (Taiwan), Luminex Corporation (US), Bio Molecular Systems (Australia), Azure Biosystems (US), Chai Inc. (US), Enzo Life Sciences (US), Biomeme Inc. (US), and ELITech Group SAS (France).

In this report, the PCR technologies market is segmented based on product, technique, application, end user and region.

Global PCR technologies Market, by Product
  • Reagents and consumables
  • Instruments
  • Software and services
Global PCR technologies Market, by Technique
  • Conventional PCR
  • Real-time PCR
  • Digital PCR
  • Reverse transcription PCR
  • Hot-start PCR
  • Multiplex PCR
  • Other PCR techniques
Global PCR technologies market, by Application
  • Gene expression analysis
  • Genetic sequencing
  • Genotyping
  • Nucleic acid detection
  • Nucleic acid synthesis
  • Standard validation/verification
  • Diagnostic applications
  • Environmental applications
  • Other applications
Global PCR technologies market, by End User
  • Hospitals and diagnostic centers
  • Healthcare industry
  • Academia and government organizations
  • Pharma-biotech companies
  • Applied industries
  • Other end users
Geography Analysis - Value
  • North America
    • US
    • Canada
  • Europe
    • Germany
    • France
    • UK
    • Italy
    • Spain
    • Rest of Europe (RoE)
  • Asia Pacific
    • Japan
    • China
    • India
    • Australia
    • South Korea
    • RoAPAC
  • Latin America
    • Brazil
    • Mexico
    • RoLA
  • Middle East & Africa

Recent Developments

  • In May 2022, Bio-Rad Laboratories, Inc. launched its CFX Duet Real-time PCR System in select countries accepting the CE Mark. The system is to support researchers in developing singleplex and duplex quantitative PCR (qPCR) assays
  • In January 2022, QIAGEN N.V. and Atila BioSystems collaborated that extend the QIAcuity ecosystem to provide non-invasive prenatal testing (NIPT) solutions to QIAGEN’s dPCR franchise.
  • In January 2021, Danaher Corporation announced that Health Canada issued Cepheid a medical device license for Xpert Xpress SARS-CoV-2/Flu/RSV

Frequently Asked Questions (FAQ):

To speak to our analyst for a discussion on the above findings, click Speak to Analyst

TABLE OF CONTENTS

1 INTRODUCTION (Page No. - 26)
    1.1 STUDY OBJECTIVES
    1.2 MARKET DEFINITION
           1.2.1 INCLUSIONS AND EXCLUSIONS
    1.3 MARKET SCOPE
           1.3.1 YEARS CONSIDERED
    1.4 CURRENCY CONSIDERED
    1.5 KEY STAKEHOLDERS
    1.6 SUMMARY OF CHANGES

2 RESEARCH METHODOLOGY (Page No. - 31)
    2.1 RESEARCH DATA
          FIGURE 1 RESEARCH DESIGN
           2.1.1 SECONDARY DATA
                    2.1.1.1 Indicative list of secondary sources
           2.1.2 PRIMARY DATA
                    FIGURE 2 BREAKDOWN OF PRIMARY INTERVIEWS: BY COMPANY TYPE, DESIGNATION, AND REGION
    2.2 MARKET ESTIMATION METHODOLOGY
          FIGURE 3 RESEARCH METHODOLOGY: HYPOTHESIS BUILDING
           2.2.1 REVENUE MAPPING-BASED MARKET ESTIMATION
           2.2.2 USAGE-BASED MARKET ESTIMATION
                    FIGURE 4 MARKET SIZE ESTIMATION METHODOLOGY: GLOBAL PCR  TECHNOLOGIES MARKET
           2.2.3 PRIMARY RESEARCH VALIDATION
    2.3 DATA TRIANGULATION
          FIGURE 5 DATA TRIANGULATION METHODOLOGY
    2.4 RESEARCH ASSUMPTIONS
    2.5 RESEARCH LIMITATIONS

3 EXECUTIVE SUMMARY (Page No. - 41)
    FIGURE 6 PCR TECHNOLOGIES MARKET, BY PRODUCT, 2021 VS. 2027 (USD MILLION)
    FIGURE 7 PCR TECHNOLOGIES MARKET, BY TECHNIQUE, 2021 VS. 2027 (USD MILLION)
    FIGURE 8 PCR TECHNOLOGIES MARKET, BY END USER, 2021 VS. 2027 (USD MILLION)
    FIGURE 9 GEOGRAPHICAL SNAPSHOT OF PCR TECHNOLOGIES MARKET

4 PREMIUM INSIGHTS (Page No. - 45)
    4.1 PCR TECHNOLOGIES MARKET OVERVIEW
          FIGURE 10 RISING INCIDENCE OF TARGET INFECTIOUS DISEASES AND GENETIC DISORDERS TO DRIVE MARKET GROWTH
    4.2 PCR TECHNOLOGIES MARKET SHARE, BY TECHNIQUE,  2021 VS. 2027
          FIGURE 11 REAL-TIME PCR SEGMENT ACCOUNTED FOR LARGEST SHARE OF PCR TECHNOLOGIES MARKET IN 2021
    4.3 PCR TECHNOLOGIES MARKET, BY APPLICATION,  2021 VS. 2027 (USD MILLION)
          FIGURE 12 DIAGNOSTIC APPLICATIONS SEGMENT TO DOMINATE MARKET DURING FORECAST PERIOD
    4.4 ASIA PACIFIC: PCR TECHNOLOGIES MARKET, BY END USER AND COUNTRY (2021)
          FIGURE 13 HOSPITALS AND DIAGNOSTIC CENTERS ARE LARGEST END-USERS OF PCR TECHNOLOGIES IN ASIA PACIFIC
    4.5 PCR TECHNOLOGIES MARKET, BY REGION
          FIGURE 14 ASIA PACIFIC MARKET TO REGISTER HIGHEST GROWTH DURING FORECAST PERIOD (2022–2027)

5 MARKET OVERVIEW (Page No. - 50)
    5.1 INTRODUCTION
    5.2 MARKET DYNAMICS
          FIGURE 15 PCR TECHNOLOGIES MARKET: DRIVERS, RESTRAINTS, OPPORTUNITIES,  AND CHALLENGES
           5.2.1 DRIVERS
                    5.2.1.1 Rising incidence of target infectious diseases and genetic disorders
                                FIGURE 16 GLOBAL BURDEN OF HIV INFECTIONS, BY REGION, 2021
                                FIGURE 17 GROWING GERIATRIC POPULATION ACROSS KEY GEOGRAPHIES,  2019 VS. 2050 (MILLION)
                    5.2.1.2 Continuous advancements in PCR technologies
                                TABLE 1 TRADITIONAL PCR VS. QPCR AND DPCR
                    5.2.1.3 Increasing investments, funds, and grants
                    5.2.1.4 Increasing use of biomarker profiling for disease diagnostics
                    5.2.1.5 Successful completion of Human Genome Project
           5.2.2 RESTRAINTS
                    5.2.2.1 High device costs associated with dPCR
                    5.2.2.2 Technical limitations of qPCR and dPCR
           5.2.3 OPPORTUNITIES
                    5.2.3.1 Growing market penetration in emerging countries
                    5.2.3.2 Shift from plant-derived to genome-based drug discovery
           5.2.4 CHALLENGES
                    5.2.4.1 Adoption and implementation of MIQE guidelines
    5.3 TECHNOLOGY ANALYSIS
           5.3.1 DEVELOPMENT OF PORTABLE INSTRUMENTS USING PCR DIAGNOSTIC SERVICES
           5.3.2 DEVELOPMENT OF RAPID AND SENSITIVE DIAGNOSTIC KITS
    5.4 GLOBAL REGULATORY LANDSCAPE
           5.4.1 KEY REGULATORY AGENCIES
    5.5 VALUE CHAIN ANALYSIS
          FIGURE 18 VALUE CHAIN ANALYSIS—MAXIMUM VALUE ADDED DURING REGULATION AND DISTRIBUTION STAGES
    5.6 SUPPLY CHAIN ANALYSIS
           5.6.1 PROMINENT COMPANIES
           5.6.2 SMALL & MEDIUM-SIZED ENTERPRISES
           5.6.3 END USERS
                    FIGURE 19 SUPPLY CHAIN ANALYSIS
    5.7 PRICING TREND ANALYSIS
          TABLE 2 AVERAGE PRICE OF PCR PRODUCTS, BY KEY PLAYER, 2021 (USD)
          FIGURE 20 AVERAGE PRICE OF DIFFERENT PCR ANALYZERS, BY TECHNOLOGY, 2021 (USD)
    5.8 REIMBURSEMENT SCENARIO
          TABLE 3 REIMBURSEMENT CODES FOR COVID-19 PCR TESTING IN US (AS OF 2022)
    5.9 ECOSYSTEM COVERAGE: PARENT MARKET
    5.10 PORTER’S FIVE FORCES ANALYSIS
           5.10.1 OVERVIEW
                     TABLE 4 PCR TECHNOLOGIES MARKET: PORTER’S FIVE FORCES ANALYSIS
           5.10.2 DEGREE OF COMPETITION
           5.10.3 BARGAINING POWER OF SUPPLIERS
           5.10.4 BARGAINING POWER OF BUYERS
           5.10.5 THREAT OF NEW ENTRANTS
           5.10.6 THREAT OF SUBSTITUTES
    5.11 PATENT ANALYSIS
           FIGURE 21 NUMBER OF PATENTS FOR PCR TESTING
           FIGURE 22 NUMBER OF PATENTS FOR PCR DIAGNOSTICS
    5.12 TRADE ANALYSIS
           TABLE 5 IMPORT DATA FOR PCR ANALYZERS (HS CODE 3822), BY COUNTRY, 2017–2021 (USD)
           TABLE 6 EXPORT DATA FOR PCR ANALYZERS (HS CODE 3822), BY COUNTRY, 2017–2021 (USD)
    5.13 KEY CONFERENCES AND EVENTS (2022–2023)
           TABLE 7 PCR TECHNOLOGIES MARKET: LIST OF MAJOR CONFERENCES AND EVENTS
    5.14 TRENDS/DISRUPTIONS IMPACTING CUSTOMERS’ BUSINESSES
           5.14.1 DEVELOPMENT OF COMPACT, PORTABLE, AND LAB-ON-CHIP PCR DEVICES
           5.14.2 ONGOING TECHNOLOGICAL INTEGRATION WITH PCR PROCESS
    5.15 KEY STAKEHOLDERS AND BUYING CRITERIA
           5.15.1 KEY STAKEHOLDERS IN BUYING PROCESS, BY END USER
                     FIGURE 23 INFLUENCE OF STAKEHOLDERS IN BUYING PROCESS, BY END USER
                     TABLE 8 INFLUENCE OF STAKEHOLDERS IN BUYING PROCESS, BY END USER (%)
           5.15.2 BUYING CRITERIA
                     FIGURE 24 KEY BUYING CRITERIA, BY END USER
                     TABLE 9 KEY BUYING CRITERIA, BY END USER

6 PCR TECHNOLOGIES MARKET, BY PRODUCT (Page No. - 72)
    6.1 INTRODUCTION
          TABLE 10 PCR TECHNOLOGIES MARKET, BY PRODUCT, 2020–2027 (USD MILLION)
    6.2 REAGENTS AND CONSUMABLES
           6.2.1 INCREASING NUMBER OF ANALYTICAL PROCEDURES AMONG RESEARCHERS TO FUEL MARKET GROWTH
                    TABLE 11 PCR REAGENTS AND CONSUMABLES MARKET, BY REGION, 2020–2027 (USD MILLION)
    6.3 INSTRUMENTS
           6.3.1 INCREASING AVAILABILITY OF INNOVATIVE PCR INSTRUMENTS TO DRIVE MARKET GROWTH
                    TABLE 12 PCR INSTRUMENTS MARKET, BY REGION, 2020–2027 (USD MILLION)
    6.4 SOFTWARE AND SERVICES
           6.4.1 AUTOMATION AND DIGITALIZATION OF LABORATORY PROCESSES TO FUEL ADOPTION AMONG END USERS
                    TABLE 13 PCR SOFTWARE AND SERVICES MARKET, BY REGION, 2020–2027 (USD MILLION)

7 PCR TECHNOLOGIES MARKET, BY TECHNIQUE (Page No. - 77)
    7.1 INTRODUCTION
          TABLE 14 PCR TECHNOLOGIES MARKET, BY TECHNIQUE, 2020–2027 (USD MILLION)
    7.2 CONVENTIONAL PCR
           7.2.1 DIVERSE APPLICATIONS OF CONVENTIONAL PCR TO SUSTAIN MARKET GROWTH
                    TABLE 15 CONVENTIONAL PCR MARKET, BY REGION, 2020–2027 (USD MILLION)
                    TABLE 16 CONVENTIONAL PCR MARKET, BY PRODUCT, 2020–2027 (USD MILLION)
                    TABLE 17 CONVENTIONAL PCR MARKET, BY APPLICATION, 2020–2027 (USD MILLION)
                    TABLE 18 CONVENTIONAL PCR MARKET, BY END USER, 2020–2027 (USD MILLION)
    7.3 REAL-TIME PCR
           7.3.1 GROWING ADOPTION AMONG RESEARCHERS AND HEALTHCARE PROFESSIONALS TO FUEL MARKET GROWTH
                    TABLE 19 REAL-TIME PCR MARKET, BY REGION, 2020–2027 (USD MILLION)
                    TABLE 20 REAL-TIME PCR MARKET, BY PRODUCT, 2020–2027 (USD MILLION)
                    TABLE 21 REAL-TIME PCR MARKET, BY APPLICATION, 2020–2027 (USD MILLION)
                    TABLE 22 REAL-TIME PCR MARKET, BY END USER, 2020–2027 (USD MILLION)
    7.4 DIGITAL PCR
           7.4.1 ONGOING TECHNOLOGICAL DEVELOPMENTS WITH RESPECT TO DIGITAL PCR TO DRIVE MARKET GROWTH
                    TABLE 23 DIGITAL PCR MARKET, BY REGION, 2020–2027 (USD MILLION)
                    TABLE 24 DIGITAL PCR MARKET, BY PRODUCT, 2020–2027 (USD MILLION)
                    TABLE 25 DIGITAL PCR MARKET, BY APPLICATION, 2020–2027 (USD MILLION)
                    TABLE 26 DIGITAL PCR MARKET, BY END USER, 2020–2027 (USD MILLION)
    7.5 REVERSE TRANSCRIPTION PCR
           7.5.1 HIGHER SENSITIVITY FOR MRNA DETECTION TO DRIVE MARKET GROWTH
                    TABLE 27 ONE-STEP RT-PCR VS. TWO-STEP RT-PCR
                    TABLE 28 REVERSE TRANSCRIPTION PCR MARKET, BY REGION, 2020–2027 (USD MILLION)
                    TABLE 29 REVERSE TRANSCRIPTION PCR MARKET, BY PRODUCT, 2020–2027 (USD MILLION)
                    TABLE 30 REVERSE TRANSCRIPTION PCR MARKET, BY APPLICATION, 2020–2027 (USD MILLION)
                    TABLE 31 REVERSE TRANSCRIPTION PCR MARKET, BY END USER, 2020–2027 (USD MILLION)
    7.6 HOT-START PCR
           7.6.1 HASSLE-FREE SETUP OF SAMPLES KEY ADVANTAGE OFFERED  BY HOT-START PCR
                    TABLE 32 BENEFITS AND CONSIDERATIONS INVOLVED IN HOT-START TECHNOLOGY
                    TABLE 33 HOT-START PCR MARKET, BY REGION, 2020–2027 (USD MILLION)
                    TABLE 34 HOT-START PCR MARKET, BY PRODUCT, 2020–2027 (USD MILLION)
                    TABLE 35 HOT-START PCR MARKET, BY APPLICATION, 2020–2027 (USD MILLION)
                    TABLE 36 HOT-START PCR MARKET, BY END USER, 2020–2027 (USD MILLION)
    7.7 MULTIPLEX PCR
           7.7.1 COST-EFFECTIVENESS OF THIS TECHNIQUE TO DRIVE MARKET GROWTH
                    TABLE 37 MULTIPLEX PCR MARKET, BY REGION, 2020–2027 (USD MILLION)
                    TABLE 38 MULTIPLEX PCR MARKET, BY PRODUCT, 2020–2027 (USD MILLION)
                    TABLE 39 MULTIPLEX PCR MARKET, BY APPLICATION, 2020–2027 (USD MILLION)
                    TABLE 40 MULTIPLEX PCR MARKET, BY END USER, 2020–2027 (USD MILLION)
    7.8 OTHER PCR TECHNIQUES
          TABLE 41 OTHER PCR TECHNIQUES MARKET, BY REGION, 2020–2027 (USD MILLION)
          TABLE 42 OTHER PCR TECHNIQUES MARKET, BY PRODUCT, 2020–2027 (USD MILLION)
          TABLE 43 OTHER PCR TECHNIQUES MARKET, BY APPLICATION, 2020–2027 (USD MILLION)
          TABLE 44 OTHER PCR TECHNIQUES MARKET, BY END USER, 2020–2027 (USD MILLION)

8 PCR TECHNOLOGIES MARKET, BY APPLICATION (Page No. - 97)
    8.1 INTRODUCTION
          TABLE 45 PCR TECHNOLOGIES MARKET, BY APPLICATION, 2020–2027 (USD MILLION)
    8.2 GENE EXPRESSION ANALYSIS
           8.2.1 GENE EXPRESSION ANALYSIS WIDELY USED IN EPIGENETICS, SIRNA QUANTIFICATION, MRNA ANALYSIS, AND CELL LINE VALIDATION
                    TABLE 46 PCR TECHNOLOGIES MARKET FOR GENE EXPRESSION ANALYSIS, BY REGION,  2020–2027 (USD MILLION)
    8.3 GENETIC SEQUENCING
           8.3.1 REDUCED COST OF SEQUENCING TO DRIVE MARKET GROWTH
                    TABLE 47 PCR TECHNOLOGIES MARKET FOR GENETIC SEQUENCING, BY REGION,  2020–2027 (USD MILLION)
    8.4 GENOTYPING
           8.4.1 SNP GENOTYPING CAN ACCELERATE PERSONALIZED MEDICINE DEVELOPMENT
                    TABLE 48 PCR TECHNOLOGIES MARKET FOR GENOTYPING, BY REGION,  2020–2027 (USD MILLION)
    8.5 NUCLEIC ACID DETECTION
           8.5.1 PCR TECHNIQUES HAVE WIDE APPLICATIONS IN NUCLEIC  ACID DETECTION
                    TABLE 49 PCR TECHNOLOGIES MARKET FOR NUCLEIC ACID DETECTION, BY REGION,  2020–2027 (USD MILLION)
    8.6 NUCLEIC ACID SYNTHESIS
           8.6.1 DNA SYNTHESIS HAS OPENED AVENUES FOR PROGRESS IN BIOLOGY
                    TABLE 50 PCR TECHNOLOGIES MARKET FOR NUCLEIC ACID SYNTHESIS, BY REGION,  2020–2027 (USD MILLION)
    8.7 STANDARD VALIDATION/VERIFICATION
           8.7.1 PCR TECHNIQUES USED FOR REGIONAL/GLOBAL VALIDATION  TO FRAME COMMERCIAL/NON-COMMERCIAL GUIDELINES
                    TABLE 51 PCR TECHNOLOGIES MARKET FOR STANDARD VALIDATION/VERIFICATION, BY REGION,  2020–2027 (USD MILLION)
    8.8 DIAGNOSTIC APPLICATIONS
           8.8.1 DIAGNOSTIC APPLICATIONS SEGMENT TO ACCOUNT FOR LARGEST MARKET SHARE
                    TABLE 52 PCR TECHNOLOGIES MARKET FOR DIAGNOSTIC APPLICATIONS, BY REGION,  2020–2027 (USD MILLION)
    8.9 ENVIRONMENTAL APPLICATIONS
           8.9.1 PCR WIDELY USED TO DETECT PATHOGENS IN ENVIRONMENTAL SAMPLES
                    TABLE 53 PCR TECHNOLOGIES MARKET FOR ENVIRONMENTAL APPLICATIONS, BY REGION,  2020–2027 (USD MILLION)
    8.10 OTHER APPLICATIONS
          TABLE 54 PCR TECHNOLOGIES MARKET FOR OTHER APPLICATIONS, BY REGION,  2020–2027 (USD MILLION)

9 PCR TECHNOLOGIES MARKET, BY END USER (Page No. - 108)
    9.1 INTRODUCTION
          TABLE 55 PCR TECHNOLOGIES MARKET, BY END USER, 2020–2027 (USD MILLION)
    9.2 HOSPITALS AND DIAGNOSTIC CENTERS
           9.2.1 HIGH PREVALENCE OF TARGET DISEASES TO DRIVE MARKET GROWTH
                    TABLE 56 PCR TECHNOLOGIES MARKET FOR HOSPITALS AND DIAGNOSTIC CENTERS, BY REGION, 2020–2027 (USD MILLION)
    9.3 HEALTHCARE INDUSTRY
           9.3.1 PCR HAS WIDE APPLICATIONS IN HEALTHCARE INDUSTRY
                    TABLE 57 PCR TECHNOLOGIES MARKET FOR HEALTHCARE INDUSTRY, BY REGION,  2020–2027 (USD MILLION)
    9.4 ACADEMIA AND GOVERNMENT ORGANIZATIONS
           9.4.1 AVAILABILITY OF COST-EFFECTIVE AND INNOVATIVE PCR PRODUCTS TO DRIVE ADOPTION
                    TABLE 58 PCR TECHNOLOGIES MARKET FOR ACADEMIA AND GOVERNMENT ORGANIZATIONS,  BY REGION, 2020–2027 (USD MILLION)
    9.5 PHARMA-BIOTECH COMPANIES
           9.5.1 INCREASING R&D INITIATIVES BY PHARMA-BIOTECH COMPANIES TO FUEL ADOPTION OF PCR TECHNOLOGIES
                    TABLE 59 PCR TECHNOLOGIES MARKET FOR PHARMA-BIOTECH COMPANIES,  BY REGION, 2020–2027 (USD MILLION)
    9.6 APPLIED INDUSTRIES
           9.6.1 INCREASING ENVIRONMENTAL REGULATIONS TO DRIVE ADOPTION OF PCR TECHNIQUES
                    TABLE 60 PCR TECHNOLOGIES MARKET FOR APPLIED INDUSTRIES, BY REGION,  2020–2027 (USD MILLION)
    9.7 OTHER END USERS
          TABLE 61 PCR TECHNOLOGIES MARKET FOR OTHER END USERS, BY REGION,  2020–2027 (USD MILLION)

10 PCR TECHNOLOGIES MARKET, BY REGION (Page No. - 116)
     10.1 INTRODUCTION
             TABLE 62 PCR TECHNOLOGIES MARKET, BY REGION, 2020–2027 (USD MILLION)
     10.2 NORTH AMERICA
             FIGURE 25 NORTH AMERICA: PCR TECHNOLOGIES MARKET SNAPSHOT
             TABLE 63 NORTH AMERICA: PCR TECHNOLOGIES MARKET, BY COUNTRY,  2020–2027 (USD MILLION)
             TABLE 64 NORTH AMERICA: PCR TECHNOLOGIES MARKET, BY TECHNIQUE,  2020–2027 (USD MILLION)
             TABLE 65 NORTH AMERICA: PCR TECHNOLOGIES MARKET, BY PRODUCT,  2020–2027 (USD MILLION)
             TABLE 66 NORTH AMERICA: PCR TECHNOLOGIES MARKET, BY APPLICATION,  2020–2027 (USD MILLION)
             TABLE 67 NORTH AMERICA: PCR TECHNOLOGIES MARKET, BY END USER,  2020–2027 (USD MILLION)
             10.2.1 US
                        10.2.1.1 Growing adoption of PCR techniques in research and academia to drive market growth
                                      TABLE 68 US: PCR TECHNOLOGIES MARKET, BY TECHNIQUE, 2020–2027 (USD MILLION)
             10.2.2 CANADA
                        10.2.2.1 Government initiatives for supporting genomics research to propel growth
                                      TABLE 69 CANADA: PCR TECHNOLOGIES MARKET, BY TECHNIQUE, 2020–2027 (USD MILLION)
     10.3 EUROPE
             TABLE 70 EUROPE: PCR TECHNOLOGIES MARKET, BY COUNTRY, 2020–2027 (USD MILLION)
             TABLE 71 EUROPE: PCR TECHNOLOGIES MARKET, BY TECHNIQUE, 2020–2027 (USD MILLION)
             TABLE 72 EUROPE: PCR TECHNOLOGIES MARKET, BY PRODUCT, 2020–2027 (USD MILLION)
             TABLE 73 EUROPE: PCR TECHNOLOGIES MARKET, BY APPLICATION, 2020–2027 (USD MILLION)
             TABLE 74 EUROPE: PCR TECHNOLOGIES MARKET, BY END USER, 2020–2027 (USD MILLION)
             10.3.1 GERMANY
                        10.3.1.1 Large-scale outsourcing of clinical diagnostic testing by hospitals to drive market growth
                                      TABLE 75 GERMANY: PCR TECHNOLOGIES MARKET, BY TECHNIQUE, 2020–2027 (USD MILLION)
             10.3.2 UK
                        10.3.2.1 Growing focus on genomics research to support market  growth
                                      TABLE 76 UK: PCR TECHNOLOGIES MARKET, BY TECHNIQUE, 2020–2027 (USD MILLION)
             10.3.3 FRANCE
                        10.3.3.1 Initiatives for developing genomic medicine to support market growth
                                      TABLE 77 FRANCE: PCR TECHNOLOGIES MARKET, BY TECHNIQUE, 2020–2027 (USD MILLION)
             10.3.4 ITALY
                        10.3.4.1 Increasing R&D investments by pharmaceutical companies to propel market growth
                                      TABLE 78 ITALY: PCR TECHNOLOGIES MARKET, BY TECHNIQUE, 2020–2027 (USD MILLION)
             10.3.5 SPAIN
                        10.3.5.1 Increasing prevalence of chronic and infectious diseases to drive market growth
                                      TABLE 79 SPAIN: PCR TECHNOLOGIES MARKET, BY TECHNIQUE, 2020–2027 (USD MILLION)
             10.3.6 REST OF EUROPE
                        TABLE 80 REST OF EUROPE: HIV AND TB INCIDENCE, BY COUNTRY, 2020
                        TABLE 81 REST OF EUROPE: PCR TECHNOLOGIES MARKET, BY TECHNIQUE,  2020–2027 (USD MILLION)
     10.4 ASIA PACIFIC
             FIGURE 26 ASIA PACIFIC: PCR TECHNOLOGIES MARKET SNAPSHOT
             TABLE 82 ASIA PACIFIC: PCR TECHNOLOGIES MARKET, BY COUNTRY, 2020–2027 (USD MILLION)
             TABLE 83 ASIA PACIFIC: PCR TECHNOLOGIES MARKET, BY TECHNIQUE, 2020–2027 (USD MILLION)
             TABLE 84 ASIA PACIFIC: PCR TECHNOLOGIES MARKET, BY PRODUCT, 2020–2027 (USD MILLION)
             TABLE 85 ASIA PACIFIC: PCR TECHNOLOGIES MARKET, BY APPLICATION,  2020–2027 (USD MILLION)
             TABLE 86 ASIA PACIFIC: PCR TECHNOLOGIES MARKET, BY END USER, 2020–2027 (USD MILLION)
             10.4.1 JAPAN
                        10.4.1.1 Strong research and healthcare infrastructure to support market growth
                                      TABLE 87 JAPAN: PCR TECHNOLOGIES MARKET, BY TECHNIQUE, 2020–2027 (USD MILLION)
             10.4.2 CHINA
                        10.4.2.1 Healthcare infrastructure modernization to support market growth
                                      TABLE 88 CHINA: PCR TECHNOLOGIES MARKET, BY TECHNIQUE, 2020–2027 (USD MILLION)
             10.4.3 INDIA
                        10.4.3.1 Presence of large target patient population to support market growth
                                      TABLE 89 INDIA: PCR TECHNOLOGIES MARKET, BY TECHNIQUE, 2020–2027 (USD MILLION)
             10.4.4 AUSTRALIA
                        10.4.4.1 High healthcare expenditure to drive demand for advanced healthcare technologies such as PCR
                                      TABLE 90 AUSTRALIA: PCR TECHNOLOGIES MARKET, BY TECHNIQUE, 2020–2027 (USD MILLION)
             10.4.5 SOUTH KOREA
                        10.4.5.1 Growing number of private hospitals and independent testing laboratories to drive market growth
                                      TABLE 91 SOUTH KOREA: PCR TECHNOLOGIES MARKET, BY TECHNIQUE,  2020–2027 (USD MILLION)
             10.4.6 REST OF ASIA PACIFIC
                        TABLE 92 REST OF ASIA PACIFIC: PCR TECHNOLOGIES MARKET, BY TECHNIQUE,  2020–2027 (USD MILLION)
     10.5 LATIN AMERICA
             TABLE 93 LATIN AMERICA: PCR TECHNOLOGIES MARKET, BY COUNTRY, 2020–2027 (USD MILLION)
             TABLE 94 LATIN AMERICA: PCR TECHNOLOGIES MARKET, BY TECHNIQUE,  2020–2027 (USD MILLION)
             TABLE 95 LATIN AMERICA: PCR TECHNOLOGIES MARKET, BY PRODUCT, 2020–2027 (USD MILLION)
             TABLE 96 LATIN AMERICA: PCR TECHNOLOGIES MARKET, BY APPLICATION,  2020–2027 (USD MILLION)
             TABLE 97 LATIN AMERICA: PCR TECHNOLOGIES MARKET, BY END USER,  2020–2027 (USD MILLION)
             10.5.1 BRAZIL
                        10.5.1.1 Brazil to dominate LATAM market during forecast period
                                      TABLE 98 BRAZIL: PCR TECHNOLOGIES MARKET, BY TECHNIQUE, 2020–2027 (USD MILLION)
             10.5.2 MEXICO
                        10.5.2.1 Favorable trade agreements to support imports and improve accessibility to PCR instruments
                                      TABLE 99 MEXICO: PCR TECHNOLOGIES MARKET, BY TECHNIQUE, 2020–2027 (USD MILLION)
             10.5.3 REST OF LATIN AMERICA
                       TABLE 100 REST OF LATIN AMERICA: PCR TECHNOLOGIES MARKET, BY TECHNIQUE,  2020–2027 (USD MILLION)
     10.6 MIDDLE EAST & AFRICA
             10.6.1 LOW PURCHASING POWER OF END USERS AND INFRASTRUCTURAL LIMITATIONS TO RESTRAIN MARKET GROWTH
                        TABLE 101 MIDDLE EAST & AFRICA: PCR TECHNOLOGIES MARKET, BY TECHNIQUE,  2020–2027 (USD MILLION)
                        TABLE 102 MIDDLE EAST & AFRICA: PCR TECHNOLOGIES MARKET, BY PRODUCT,  2020–2027 (USD MILLION)
                        TABLE 103 MIDDLE EAST & AFRICA: PCR TECHNOLOGIES MARKET, BY APPLICATION,  2020–2027 (USD MILLION)
                        TABLE 104 MIDDLE EAST & AFRICA: PCR TECHNOLOGIES MARKET, BY END USER,  2020–2027 (USD MILLION)

11 COMPETITIVE LANDSCAPE (Page No. - 154)
     11.1 INTRODUCTION
            FIGURE 27 KEY DEVELOPMENTS BY LEADING PLAYERS IN PCR TECHNOLOGIES MARKET, 2018–2022
     11.2 REVENUE SHARE ANALYSIS
            FIGURE 28 REVENUE SHARE ANALYSIS OF TOP PLAYERS IN PCR TECHNOLOGIES MARKET
     11.3 MARKET SHARE ANALYSIS
            FIGURE 29 PCR TECHNOLOGIES MARKET SHARE, BY KEY PLAYER, 2021
     11.4 COMPETITIVE LEADERSHIP MAPPING: COMPANY EVALUATION QUADRANT (2021)
             11.4.1 STARS
             11.4.2 EMERGING LEADERS
             11.4.3 PERVASIVE PLAYERS
             11.4.4 PARTICIPANTS
                        FIGURE 30 PCR TECHNOLOGIES MARKET: COMPETITIVE LEADERSHIP MAPPING (2021)
     11.5 COMPETITIVE LEADERSHIP MAPPING: START-UP/SME EVALUATION QUADRANT (2021)
             11.5.1 PROGRESSIVE COMPANIES
             11.5.2 RESPONSIVE COMPANIES
             11.5.3 DYNAMIC COMPANIES
             11.5.4 STARTING BLOCKS
                        FIGURE 31 PCR TECHNOLOGIES MARKET: COMPETITIVE LEADERSHIP MAPPING FOR SMES/START-UPS (2021)
     11.6 COMPETITIVE SCENARIO
             11.6.1 PRODUCT LAUNCHES & APPROVALS
             11.6.2 DEALS
             11.6.3 OTHER DEVELOPMENTS

12 COMPANY PROFILES (Page No. - 164)
(Business Overview, Products Offered, Recent Developments, MnM View Right to win, Strategic choices made, Weaknesses and competitive threats) *
     12.1 KEY PLAYERS
             12.1.1 THERMO FISHER SCIENTIFIC, INC.
                        TABLE 105 THERMO FISHER SCIENTIFIC, INC.: BUSINESS OVERVIEW
                        FIGURE 32 THERMO FISHER SCIENTIFIC, INC.: COMPANY SNAPSHOT (2021)
             12.1.2 F. HOFFMANN-LA ROCHE LTD.
                        TABLE 106 ROCHE DIAGNOSTICS: BUSINESS OVERVIEW
                        FIGURE 33 ROCHE DIAGNOSTICS: COMPANY SNAPSHOT (2021)
             12.1.3 BIO-RAD LABORATORIES, INC.
                        TABLE 107 BIO-RAD LABORATORIES, INC.: BUSINESS OVERVIEW
                        FIGURE 34 BIO-RAD LABORATORIES, INC.: COMPANY SNAPSHOT (2021)
             12.1.4 QIAGEN N.V.
                        TABLE 108 QIAGEN N.V.: BUSINESS OVERVIEW
                        FIGURE 35 QIAGEN N.V.: COMPANY SNAPSHOT (2021)
             12.1.5 TAKARA BIO, INC.
                        TABLE 109 TAKARA BIO, INC.: BUSINESS OVERVIEW
                        FIGURE 36 TAKARA BIO, INC.: COMPANY SNAPSHOT (2021)
             12.1.6 AGILENT TECHNOLOGIES, INC.
                        TABLE 110 AGILENT TECHNOLOGIES, INC.: BUSINESS OVERVIEW
                        FIGURE 37 AGILENT TECHNOLOGIES, INC.: COMPANY SNAPSHOT (2021)
             12.1.7 BIOMÉRIEUX S.A.
                        TABLE 111 BIOMÉRIEUX S.A.: BUSINESS OVERVIEW
                        FIGURE 38 BIOMÉRIEUX S.A.: COMPANY SNAPSHOT (2021)
             12.1.8 FLUIDIGM CORPORATION
                        TABLE 112 FLUIDIGM CORPORATION: BUSINESS OVERVIEW
                        FIGURE 39 FLUIDIGM CORPORATION: COMPANY SNAPSHOT (2021)
             12.1.9 DANAHER CORPORATION
                        TABLE 113 DANAHER CORPORATION: BUSINESS OVERVIEW
                        FIGURE 40 DANAHER CORPORATION: COMPANY SNAPSHOT (2021)
             12.1.10 ABBOTT LABORATORIES
                        TABLE 114 ABBOTT LABORATORIES: BUSINESS OVERVIEW
                        FIGURE 41 ABBOTT LABORATORIES: COMPANY SNAPSHOT (2021)
             12.1.11 MERCK KGAA
                        TABLE 115 MERCK KGAA: BUSINESS OVERVIEW
                        FIGURE 42 MERCK KGAA: COMPANY SNAPSHOT (2021)
             12.1.12 BECTON, DICKINSON AND COMPANY
                        TABLE 116 BECTON, DICKINSON AND COMPANY: BUSINESS OVERVIEW
                        FIGURE 43 BECTON, DICKINSON AND COMPANY: COMPANY SNAPSHOT (2021)
             12.1.13 PROMEGA CORPORATION
                        TABLE 117 PROMEGA CORPORATION: BUSINESS OVERVIEW
             12.1.14 EPPENDORF AG
                        TABLE 118 EPPENDORF AG: BUSINESS OVERVIEW
                        FIGURE 44 EPPENDORF AG: COMPANY SNAPSHOT (2021)
             12.1.15 ANALYTIK JENA AG (A WHOLLY OWNED SUBSIDIARY OF ENDRESS+HAUSER AG)
                        TABLE 119 ENDRESS+HAUSER: BUSINESS OVERVIEW
                        FIGURE 45 ENDRESS+HAUSER: COMPANY SNAPSHOT (2021)
     12.2 OTHER PLAYERS
             12.2.1 MERIDIAN BIOSCIENCE, INC.
             12.2.2 STILLA TECHNOLOGIES
             12.2.3 JN MEDSYS
             12.2.4 AVANCE BIOSCIENCES INC.
             12.2.5 LGC BIOSEARCH TECHNOLOGIES
             12.2.6 AZURA GENOMICS INC.
             12.2.7 BIONEER CORPORATION
             12.2.8 BLUE-RAY BIOTECH
             12.2.9 LUMINEX CORPORATION (A DIASORIN COMPANY)
             12.2.10 BIO MOLECULAR SYSTEMS
             12.2.11 AZURE BIOSYSTEMS
             12.2.12 CHAI INC.
             12.2.13 ENZO LIFE SCIENCES
             12.2.14 BIOMEME, INC.
             12.2.15 ELITECH GROUP SAS

*Details on Business Overview, Products Offered, Recent Developments, MnM View, Right to win, Strategic choices made, Weaknesses and competitive threats might not be captured in case of unlisted companies.

13 APPENDIX (Page No. - 236)
     13.1 DISCUSSION GUIDE
     13.2 KNOWLEDGE STORE: MARKETSANDMARKETS’ SUBSCRIPTION PORTAL
     13.3 CUSTOMIZATION OPTIONS
     13.4 RELATED REPORTS
     13.5 AUTHOR DETAILS

This study involved the extensive use of both primary and secondary sources. The research process involved the study of various factors affecting the industry to identify the segmentation types, industry trends, key players, competitive landscape, fundamental market dynamics, and key player strategies.

Secondary Research

The research study involved the extensive use of secondary sources; directories; databases such as D&B Hoovers, Bloomberg Business, and Factiva; white papers; annual reports; company house documents; and SEC filings of companies. Societies and organizations such as the World Health Organization (WHO) and Centers for Disease Control and Prevention (CDC) were also considered while estimating the size of the global PCR technologies market.

Primary Research

In the primary research process, various respondents from the supply and demand side were interviewed to obtain qualitative and quantitative information for this report. Primary sources from the supply side include industry experts such as CEOs, vice presidents, marketing directors, technology and innovation directors, and related key executives from various key companies and organizations operating in the PCR technologies market. Primary sources from the demand side include research institutes, academic institutes, and pharmaceutical & biotechnology companies.

A breakdown of the primary respondents is provided below:
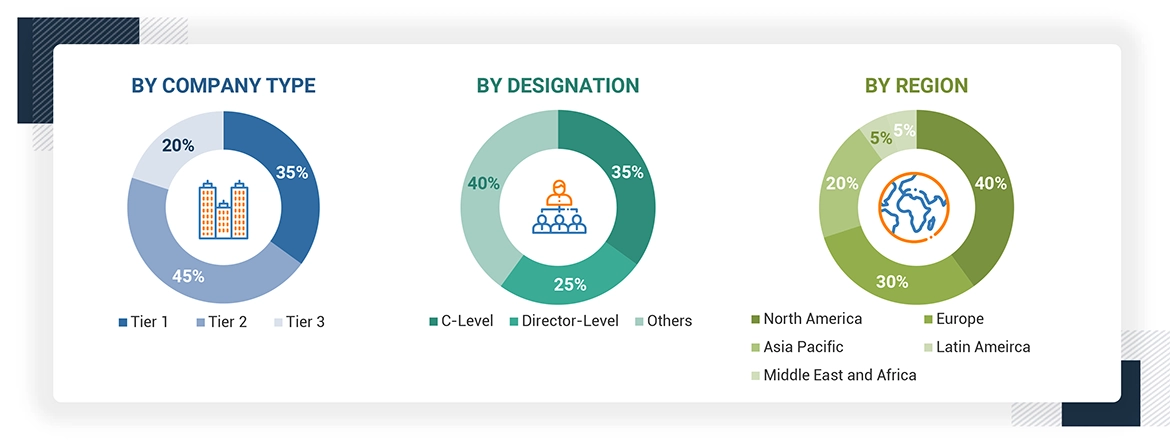
PCR Technologies Market Size, and Share

Note 1: Primary respondents from the others segment include sales managers, marketing managers, and production managers.

Note 2: Tiers of companies are defined on the basis of their total revenues as of 2020; Tier 1 = > USD 1000 million, Tier 2 = USD 100 million to USD 1,000 million, and Tier 3 = < USD 100 million.

To know about the assumptions considered for the study, download the pdf brochure

Market Estimation Methodology

Total Market Size: PCR technologies Market

The total size of the PCR technologies market was arrived at after data triangulation from four different approaches, as mentioned below. After each approach, the weighted average of the two approaches was taken based on the level of assumptions used in each approach.

APPROACH 1: SEGMENTAL REVENUE SHARE ANALYSIS

  • Revenues of individual companies were gathered from public sources and databases.
  • Shares of the leading players in the individual product segments of the PCR technologies market were gathered from secondary sources to the extent available. In some instances, shares of the individual product segments were ascertained after a detailed analysis of various parameters, including product portfolios, market positioning, average selling price, and geographic reach of the company.
  • Individual shares or revenue estimates were validated through expert interviews.

The following figure shows the overall market size estimation process employed for this study.

PCR Technologies Market Size, and Share

To know about the assumptions considered for the study, Request for Free Sample Report

Data Triangulation:

After arriving at the overall market size from the market size estimation process explained above, the total market was split into several segments. Data triangulation and market breakdown procedures were employed wherever applicable to complete the overall market engineering process and arrive at the exact statistics for all the segments. The data was triangulated by studying various factors and trends from the demand and supply sides. The market was also validated using the top-down and bottom-up approaches.

Report Objectives:

  • To define, describe, and forecast the global PCR technologies market on the basis of product, patients, end user, and region
  • To provide detailed information about the factors influencing market growth (drivers, restraints, opportunities, and industry-specific challenges)
  • To strategically analyze micromarkets with respect to individual growth trends, prospects, and contributions to the total market
  • To analyze market opportunities for stakeholders and provide details of the competitive landscape for key players
  • To forecast the revenue of market segments with respect to five key regions, namely, North America (US and Canada), Europe (Germany, France, the UK, Italy, Spain, and the Rest of Europe), the Asia Pacific (China, Japan, India, South Korea, Australia, and the Rest of Asia Pacific), Latin America (Brazil, Mexico, and the Rest of Latin America), and the Middle East & Africa
  • To profile the key market players and comprehensively analyze their market shares and core competencies.
  • To track and analyze competitive developments such as new product launches, agreements & partnerships, acquisitions, and research & development activities in the defibrillator market

Available Customizations

With the given market data, MarketsandMarkets offers customizations as per the company’s specific needs. The following customization options are available for the present global PCR technologies market report:

Product Analysis

  • Product matrix, which gives a detailed comparison of the product portfolios of the top five companies

Company Information

  • Detailed analysis and profiling of additional market players (up to 5)

Geographic Analysis

  • Further breakdown of the Rest of Europe PCR technologies market into Belgium, Austria, the Czech Republic, Denmark, Greece, Poland, and Russia, among other
  • Further breakdown of the Rest of Asia Pacific PCR technologies market into New Zealand, Vietnam, the Philippines, Singapore, Malaysia, Thailand, and Indonesia among other
  • Further breakdown of the Latin American PCR technologies market into Argentina, Chile, Peru, and Colombia, among other
Custom Market Research Services

We will customize the research for you, in case the report listed above does not meet with your exact requirements. Our custom research will comprehensively cover the business information you require to help you arrive at strategic and profitable business decisions.

Request Customization

Instant Answers with GPT - Ask Now!

Ask real questions. Get complete answers !
Report Code
AST 7880
Published ON
Nov, 2022
Choose License Type
BUY NOW
  • SHARE
X
Request Customization
Speak to Analyst
Speak to Analyst
OR FACE-TO-FACE MEETING
PERSONALIZE THIS RESEARCH
  • Triangulate with your Own Data
  • Get Data as per your Format and Definition
  • Gain a Deeper Dive on a Specific Application, Geography, Customer or Competitor
  • Any level of Personalization
REQUEST A FREE CUSTOMIZATION
LET US HELP YOU!
  • What are the Known and Unknown Adjacencies Impacting the PCR Technologies Market
  • What will your New Revenue Sources be?
  • Who will be your Top Customer; what will make them switch?
  • Defend your Market Share or Win Competitors
  • Get a Scorecard for Target Partners
CUSTOMIZED WORKSHOP REQUEST
+1-888-600-6441
  • Call Us
  • +1-888-600-6441 (Corporate office hours)
  • +1-888-600-6441 (US/Can toll free)
  • +44-800-368-9399 (UK office hours)
CONNECT WITH US
ABOUT TRUST ONLINE
©2024 MarketsandMarkets Research Private Ltd. All rights reserved
DMCA.com Protection Status Website Feedback