
Construction Plastics Market

Construction Plastics Market by Plastic Type (PVC, PE, PP, PS, PC, PU), Application (Pipes, Windows & Doors, Insulation Materials, Roofing, Flooring, Ducts, Walls), End-use Industry (Residential, Non-Residential), and Region - Global Forecast to 2030


OVERVIEW
Source: Secondary Research, Interviews with Experts, MarketsandMarkets Analysis
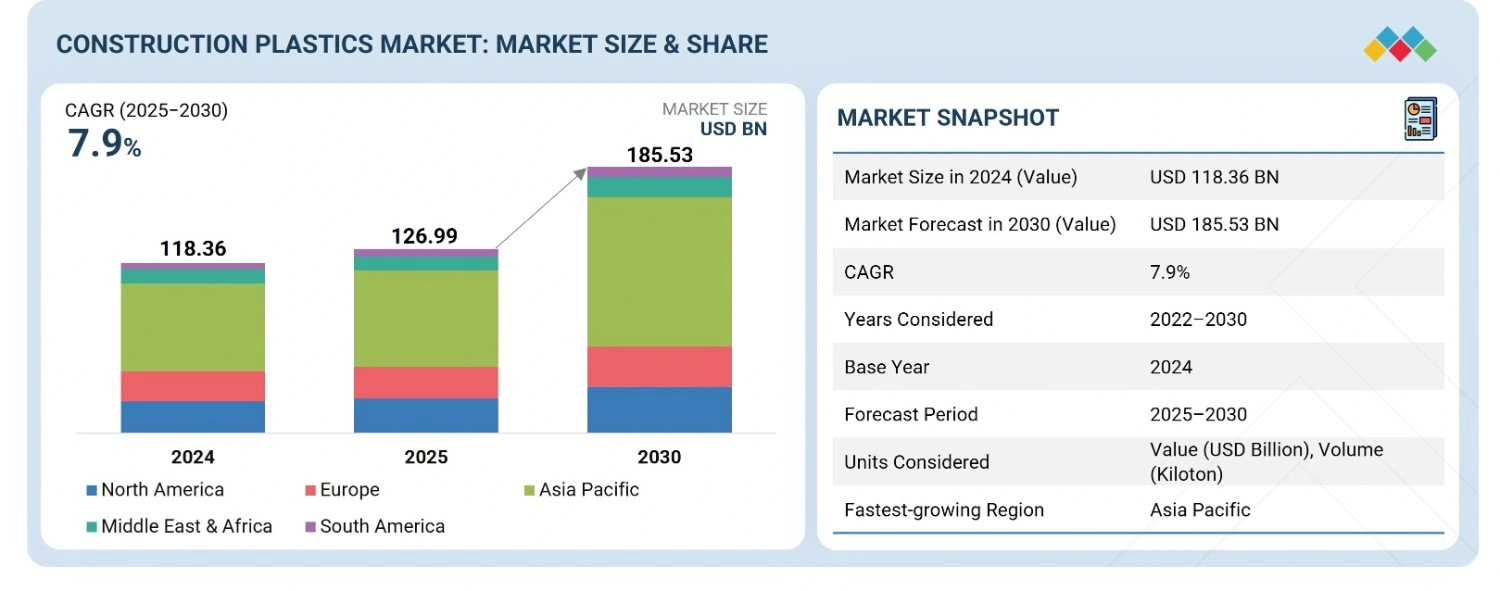
The construction plastics market is expected to grow from USD 126.99 billion in 2025 to USD 185.53 billion by 2030, at a CAGR of 7.9% during the forecast period. The growth of the market can be attributed to an increase in demand for resource-efficient, lightweight, durable, and inexpensive substitutes to traditional building materials like concrete, steel, and wood. The versatility of construction plastics is being applied in applications such as piping, insulation, roofing, flooring, windows and doors, cladding, and panels due to their corrosion resistance, ease of installation, and durability. The accelerating urbanization, expanding housing, and infrastructure projects, adoption of energy-efficient materials, and governmental policies promoting modern materials are all major contributors to the market growth.. Innovations in fire-retardant, UV-stabilized, and recycled plastics, increased investment for polymer production and sustainable building practices, and other advancements worldwide are also supporting global adoption.
KEY TAKEAWAYS
-
BY PLASTIC TYPEThe construction plastic sector consists of construction plastics such as PVC, PE, PP, PS,PU, and PC. PVC is recognized as one of the best and is typically utilized for piping, windows, and roofing because of its durability and chemical resistance; PE and PP are lightweight and resistant to corrosion and are often chosen for piping and insulation applications based on these traits; PS and PC are also lightweight and are utilized for panels, cladding, and glazing because of their clarity and impact-resistance; PU is also widely used for insulation foams based on its thermal efficiency. Established manufacturing capabilities, raw material availability,and competitiveness contribute to the market presence of each type of plastic in specific regions.
-
BY APPLICATIONConstruction plastics are used in pipes, windows and doors, insulation materials, flooring, roofing, ducts, and walls. PVC and PE are preferred for piping due to their long lifespan and low maintenance, whereas windows and doors are increasingly made from PVC and PC for weather resistivity and appearance. PU and PE foams are also used with insulation materials to provide energy efficiency for buildings. Roof and floor products may be made of either PP, PVC, or a combination of the plastics to give durability and moisture resistance. Plastic products are flexible and can create lightweight modular products resulting in savings in installation time and better performance of the overall building.
-
BY END USE INDUSTRYPlastics are used for construction in both the residential and non-residential markets. In the residential construction market, plastics are used in piping systems, windows, flooring, and roofing applications, primarily because of the low cost, low maintenance, and durability associated with using plastics. The demand for high-performance plastics for the stated applications are led through the non-residential sector, which encompasses applications aimed at commercial, industrial and infrastructure purposes, for the need to satisfy safety, fire and energy-efficiency standards. The increasing levels of urbanization, smart infrastructure initiatives, and state-supported regulations for advancing the use of modern building materials all help to escalate adoption across each respective end-user industry globally.
-
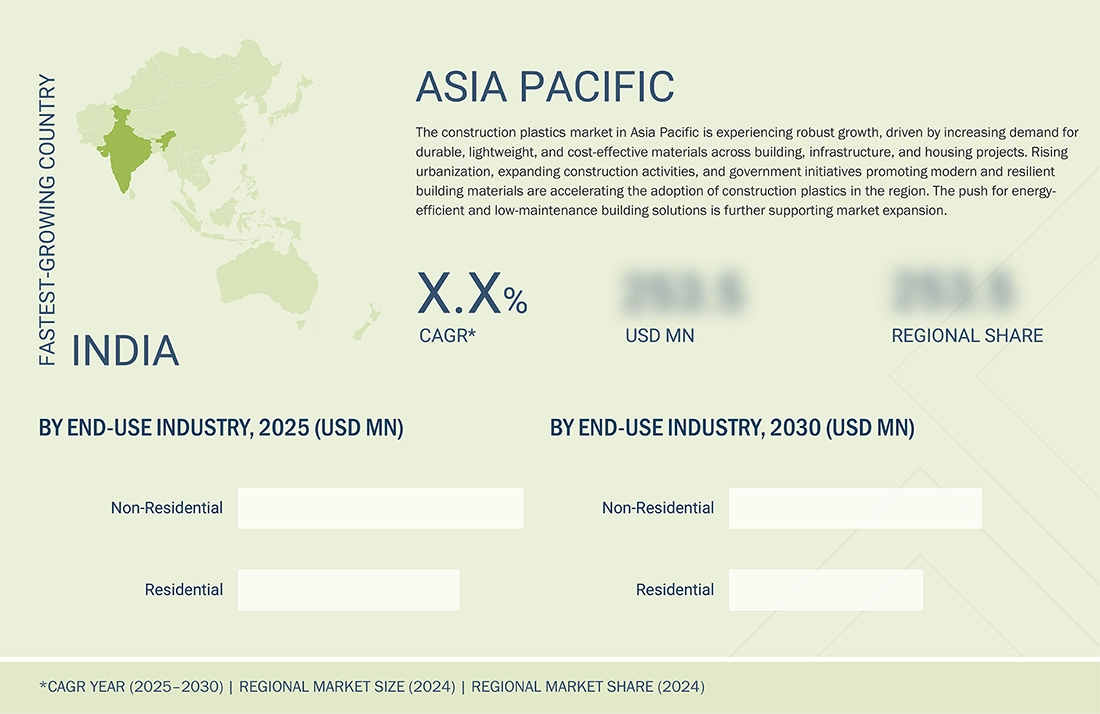
BY REGIONThe Asia Pacific region is anticipated to experience the highest growth in the construction plastics space, owing to fast-paced urbanization, increasing residential and non-residential construction activity, and government programs promoting new, energy-efficient, and lightweight materials. The demand for PVC- PE- and PP-based products in piping, insulation, roofing, and flooring applications is significantly high in countries such as China, India, and various countries in Southeast Asia. North America and Europe continue to hold considerable market share as a result of technological advancements, the adoption of high-performance plastics, sustainability goals, and favorable building codes that promote the use of durable and low maintenance materials in construction.
-
COMPETITIVE LANDSCAPEThe construction plastics market is highly competitive with companies taking organic and inorganic growth strategies, including capacity additions, joint ventures, and acquisitions. Key players in the construction plastics market include BASF (Germany), SABIC (Saudi Arabia), Dow (US), LyondellBasell Industries (US), Borealis GmbH (Austria), Formosa Plastics Corporation (Taiwan), INEOS (UK), Solvay (Belgium), Asahi Kasei Corporation (Japan), and TotalEnergies (France). All of these players continue to invest in new formulations, UV- and fire-resistant materials, and high-performance polymer applications for construction and also expand their local coverage while improving distribution channels in order to meet global demand.
In the forecast years, it is anticipated that the construction plastics industry will experience significant growth due to a rise in global demand for lightweight, durable, and cost-effective materials for building construction, along with continuous advancements in polymers. Construction plastics are beginning to replace traditional building materials such as wood, steel, and concrete, especially with regards to corrosion resistance, ease of installation, and service life. Construction plastics have a few primary features-lightweight, high strength, resistance to fire and UV, and ability to be processed in various ways, all of which are contributing to their growing application into piping, insulation, roofing and flooring materials, windows and doors, and wall panels. The growing demand for energy-efficient, low-maintenance, and sustainable materials in residential, commercial, and industrial building will continue to position construction plastics as an important part of contemporary building and an important emerging part of the global transition to circular economy in construction.
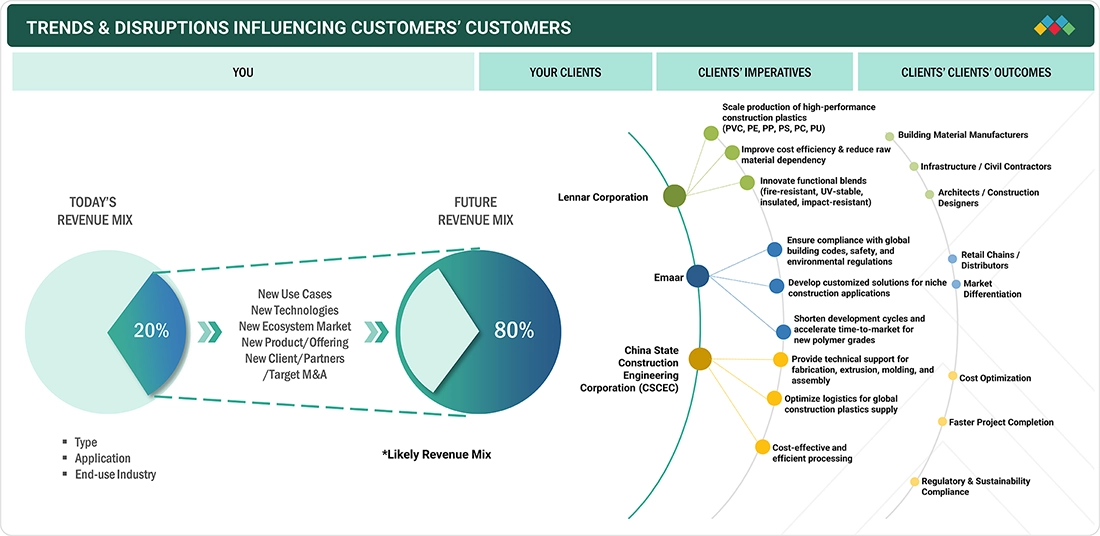
TRENDS & DISRUPTIONS IMPACTING CUSTOMERS' CUSTOMERS
The general direction of the construction plastics market is greatly driven by evolving end-user preferences and disruptions in industries that heavily use construction plastics. Key customers for supply companies of construction plastics include: pipe manufacturers, insulation/roofing product manufacturers, window and door manufacturers, flooring companies, and wall panel manufacturers. The end users are residential homeowners, commercial builders, and industrial construction suppliers/companies looking for solutions that are durable, cost effective, and low maintenance, or require little upkeep. Demand for these products in the sectors involves global trend to make energy-efficient and resilient buildings, increasing building codes and safety regulations, advances in technology with formulation of automotive polymer formulations, and the price advantage against conventional materials like wood, steel, and concrete. Supplier revenues and the ultimate dynamics of growth, competition, and innovation within the construction plastics market are also affected by changes in raw materials availability, production capacity, and the market demand for high-performance plastics or sustainable plastics.The general direction of the construction plastics market is greatly driven by evolving end-user preferences and disruptions in industries that heavily use construction plastics. Key customers for supply companies of construction plastics include: pipe manufacturers, insulation/roofing product manufacturers, window and door manufacturers, flooring companies, and wall panel manufacturers. The end users are residential homeowners, commercial builders, and industrial construction suppliers/companies looking for solutions that are durable, cost effective, and low maintenance, or require little upkeep. Demand for these products in the sectors involves global trend to make energy-efficient and resilient buildings, increasing building codes and safety regulations, advances in technology with formulation of automotive polymer formulations, and the price advantage against conventional materials like wood, steel, and concrete. Supplier revenues and the ultimate dynamics of growth, competition, and innovation within the construction plastics market are also affected by changes in raw materials availability, production capacity, and the market demand for high-performance plastics or sustainable plastics.
Source: Secondary Research, Interviews with Experts, MarketsandMarkets Analysis
MARKET DYNAMICS
Level
-
Urbanization and infrastructure growth Sustainability-driven material innovation

Level
-
Regulatory restrictions Alternatives gaining traction

Level
-
Circular economy integration Emerging market infrastructure push

Level
-
Volatility in crude oil prices Recycling infrastructure gaps

Source: Secondary Research, Interviews with Experts, MarketsandMarkets Analysis
Driver: Rising demand for lightweight, durable, and cost-effective materials in modern construction industry
Rising demand for lightweight, durable, and affordable materials is the driving force of construction plastics. Modern construction requires efficiency, sustainability and long-term performance. Because of all these factors plastics are taking the spotlight as an alternative to traditional materials like wood, metal, and concrete. Which means more construction projects can leverage the lightweight benefits of plastics, while minimal maintenance takes care of the durability against corrosion, weathering, chemical exposure, etc. These advantages keep upfront costs down while enabling comparative lower costs in operations related to energy efficiency, insulation, piping, and window profiles. As a result, plastics can cut costs in construction, resulting in faster completion of projects with more sustainability during lifecycle. The increased speed of urbanization and infrastructure development globally is heightening the need for scalable, sustainable, cost-effective building solutions, and construction plastics are key components. The fact that these materials can be easily recycled and contribute to green building principles, like a focus on sustainability and affordability, fuels their usage. The growing urgency for reduced climate change impact is accelerating industries and governments toward sustainable practices and products. Collectively, these benefits make a strong case for construction plastics at a time when meeting the evolving needs of modern construction markets is critical.
Restraint: Environmental concerns regarding plastic waste and recyclability challenges
The environmental issues surrounding plastic waste and recyclability are large barriers for the growth in the construction plastics market. For all its durability and cost-effectiveness, plastic raises some serious sustainability questions during its long decomposition cycle and by contributing to landfill buildup. A big part of the problem stems from the construction industry, which has traditionally driven plastic-based product consumption (e.g., PVC pipes, insulation, and panels) but is currently facing increasing regulatory and NGO scrutiny. There are challenges related to limited recycling systems that up until now have not enabled or incentivized operators to be able to reuse materials in the construction side of products used in the construction industry. Problems associated with compositing or contaminated plastics also impede adoption of circular economy practices and large-scale practices. Furthermore, improper plastic waste disposal practices by the construction industry contribute to further pollution and greenhouse gases, creating additional demand from public and government authorities to reduce plastic materials. The proliferation of green building certification programs and growing global regulatory demands for overseeing construction-related environment standards will continue to push competitors to look for alternative ecologically friendly materials (bioplastics, recycled composites) or traditional alternatives (e.g., wood, metal) to plastics. The moves towards preferring substitutes over plastics cut into market growth, increased dry waste compliance costs and operational plans for plastic focused manufacturers and contractors.
Opportunity: Growing smart city projects and infrastructure investments worldwide
With an increasing number of smart city projects and large-scale infrastructure investments throughout the world, there is a substantial opportunity for the construction plastics industry. Smart city projects emphasize sustainability, efficiency, and modern-day urban infrastructure, and utilize advanced materials, like plastics, for piping systems, rigid and flexible insulation, windows profiles, electrical cabling, and lightweight structural elements to enable modern infrastructure to be energy-efficient, sustainable, and responsive, and build these infrastructures faster and incorporate modular construction approaches. There are several flagship smart city projects around the world driving the demand for plastic. For example, India's Smart Cities Mission seeks to utilize smart technology to create modern infrastructure and technology in 100 cities; Saudi Arabia's NEOM City (USD 500 Billion) is a project based on a futuristic, sustainable way of living; and China's Xiong'an New Area is intended to be a green, high-tech urban centre. In addition, the EU Smart Cities Marketplace and the US Infrastructure Investment and Jobs Act (2021) are over the next several years investing billions of euros and dollars into upgrading utilities, transportation, and sustainable housing. These types of initiatives are creating new demands for all types of durable, lightweight, and recyclable plastic solutions that will enable a new form of design flexibility, performance, and cost. It is already evident and clear that urbanization is accelerating, and construction plastics will play an important role in smart infrastructure and sustainable city development in numerous locations throughout the world.
Challenge: Supply chain disruptions and high dependency on petrochemical feedstocks
Disruptive supply chains combined with the heavy dependency on petrochemical feedstocks are major challenges within the construction plastics market. Most construction plastic products, including the leading resins of PVC, polyethylene, and polypropylene, are produced from crude oil and natural gas hydrocarbon derivatives, causing a high level of dependency on a petrochemical source. The industry depends on always being able to source petrochemical feedstocks for a satisfactory price. Geopolitical tensions, international and domestic trade restrictions, and diminishing crude oil supplies all have direct effects on raw material availability and raw material prices, making finding an acceptable price for an adequate supply of raw materials unstable for manufacturers and contractors. Recent international events characterized by wars have demonstrated the fragility of supply chains, the emergence of delayed production schedules, extended lead times, and rising prices in construction plastics. Furthermore, the regional concentration of petrochemical manufacturing creates extended dependencies and areas of vulnerability; for example, a drought in Texas will affect availability and prices in Ontario, Canada. Problems with logistics, bottlenecks like container availability and port congestion, also exacerbate material shortages and prices. To firms working on a fixed budget with a tight time frame, such volatility makes it extremely difficult to effectively plan the project and earn a return on investment. The dependency on fossil fuel-based feedstocks also clashes with the global sustainability agenda; as a result, both manufacturers and the construction industry are spending time and energy exploring alternative sources of raw materials and recycling options in order to lessen dependency on petroleum-based feedstocks for their construction projects.
Construction Plastics Market: COMMERCIAL USE CASES ACROSS INDUSTRIES
| COMPANY | USE CASE DESCRIPTION | BENEFITS |
|---|---|---|
 |
Developed Ultramid polyamide compounds for durable building panels, pipes, and insulation components | High strength, impact-resistant, long service life, suitable for demanding construction applications |
 |
Developed STYROFOAM extruded polystyrene (XPS) insulation boards for walls, roofing, and foundations | High thermal insulation, moisture resistance, long-term energy savings, and easy installation |
 |
Provided Total Cray Valley resins and PE/PP compounds for construction panels and insulation films | Lightweight, chemically resistant, and customizable for specific construction applications |
 |
Developed Solvay Amodel PPA (polyphthalamide) compounds for high-temperature construction components | High mechanical strength, heat resistance, and flame retardancy for demanding applications |
Logos and trademarks shown above are the property of their respective owners. Their use here is for informational and illustrative purposes only.
MARKET ECOSYSTEM
The construction plastics ecosystem contains a long and convoluted value chain that starts with petrochemical producers who provide upstream raw materials, such as ethylene, propylene, styrene, and vinyl chloride, which are polymerized into important plastics (e.g., PVC, PE, PP, PS, PU, and engineering polymers). These polymers are then converted into semi-finished composites by compounders, extruders, and molders, to make the construction-plastics products, i.e., shapes, insulation boards, sheets, roofing membranes, sealants, and composite reinforcements. The end users of semi-finished construction plastics composites are construction contractors, infrastructure developers, and real estate developers that use these products in residential, commercial, and industrial projects, whereas distributors and retailers have the role of ensuring the products are accessible to the market. End-users derive from all industries, including residential, non-residential and other end-use industries, which are all potential players, as are regulators, government policies, and sustainability standards that influence development and market viability.
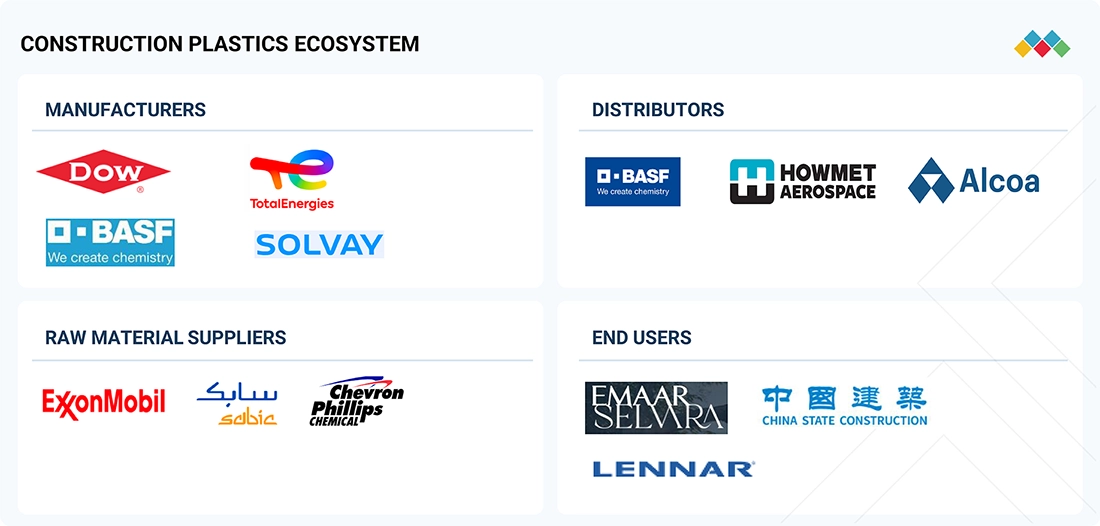
Logos and trademarks shown above are the property of their respective owners. Their use here is for informational and illustrative purposes only.
MARKET SEGMENTS
Source: Secondary Research, Interviews with Experts, MarketsandMarkets Analysis
Construction Plastics Market, by Plastic Type
PVC is expected to remain dominant in the construction plastics sector given its unique combination of durability, versatility, and low cost. PVC is found in a wide range of products such as pipes, window profiles, flooring, roofing membranes, and insulation. PVC displays excellent resistance to moisture/chemicals/corrosion and is widely used in both residential and commercial construction. PVC is lightweight yet strong, which helps to minimize and reduce the cost for shipping and installing a product. Additionally, when compared to building materials like steel and wood, the long service life of PVC means that maintenance and replacement costs are greatly reduced, which is highly desirable in an industry more concerned than ever about lifecycle cost. PVC has a great deal of design flexibility; structures and forms can quickly be extruded or molded into custom designs used in many applications. The outcome is a better fit and aesthetic in modular construction and prefabricated options. PVC also plays a major role in providing water supply and sanitation infrastructure needs. Water infrastructure is critically important in urbanization and smart cities projects.
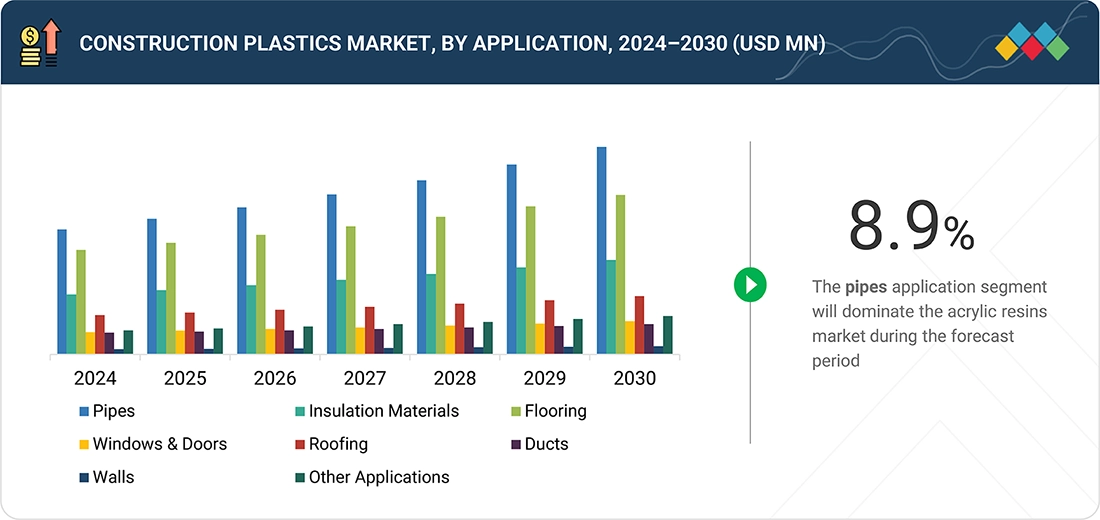
Construction Plastics Market, by Application
Pipes will represent the largest application segment of the construction plastics market by function. Pipes are integral to three of the largest systems - water supply, sewage & drainage, and gas supply - in every residential and commercial building and in all municipal infrastructure projects. As population continues to increase, so does urbanization and the need for urban infrastructure investment. This also leads to governments investing more in water supply, management and sanitation. In addition to this government spend, companies are seeing value in more cost effective and reliable methods of repairing or replacing municipal infrastructure to develop durable solutions to provide enough water supply. The rationale for plastic pipes versus traditional materials such as metal and concrete for example is magnified by the need for rapid infrastructure development. Plastic pipes also weigh substantially less, make handling installations much easier, will not corrode, and generally last longer than traditional materials. Plastic pipes provide options considering varying pressures, be it in sewage or potable water systems, and can operate in varying environmental conditions as well. With these performance factors, plastic pipes represent a good option for both residential or commercial projects as well as a key municipal infrastructure component.
Construction Plastics Market, by End-use Industry
The household sector is predominantly driven by population growth, increased housing challenges, and rising investment in affordable and environmentally-friendly housing solutions. For instance, PVC, polyethylene, and polypropylene plastics are often used in a home for pipes, window frames, doors, insulation, flooring, and roofs. They are highly suitable for large-scale household developments since they are relatively inexpensive, durable, and lightweight. In addition, plastics support more energy-efficient homes with high-performance insulation materials and weather-resistant framed windows as the world continues to drive energy efficient and environmentally sustainable building. Rising middle classes in economies, combined with government programs such as India's Pradhan Mantri Awas Yojana and urban housing development programs in China, are collecting into large-scale residential development. Retrofit and demolition markets in developed markets like North America and Europe are also strong growth areas for consumption of plastic-based products for modern housing setups. For all of these reasons, large-scale residential construction remains a core and expansive application of plastics in construction methods. Plastics have evolved to be the internal choice for household development because of their flexibility, cost savings, and value to maintain changing design and sustainability requirements; therefore, the growing residential sector drives the highest demand for construction plastics of all segments.
REGION
Asia Pacific to be the fastest-growing region in the global construction plastics market during the forecast period.
Asia Pacific is expected to lead the construction plastics market in terms of region, based on urbanization, population growth, and huge infrastructure growth. The area is experiencing a boom in commercial and residential building, especially in China, India, Indonesia, and Vietnam, where growing middle-class populations and rising disposable incomes are driving housing demand. Government programs such as China's New Urbanization Plan, India's Smart Cities Mission, and ASEAN's infrastructure development initiatives are driving the application of construction plastics in pipes, insulation, window frames, and roofing. The economics, durability, and energy efficiency of plastics make them unavoidable in meeting the region's large-scale housing and infrastructure requirements. Furthermore, Asia Pacific hosts the world's largest petrochemical manufacturing companies, thereby having easy access to raw material to produce plastics, thereby making regional supply chains resilient. Increased investment in smart cities, transportation infrastructure, and water & sewage systems further increase demand for plastic-based building solutions. Additionally, with an increase in focus on green construction, energy-efficient and recyclable plastic products are on the rise. The synergy between large-scale urban growth, state-sponsored housing schemes, and high industrial capability makes Asia Pacific the fore runner in leading the way in growth and innovation in the global construction plastics market. Asia Pacific is home to some of the biggest manufacturers of construction plastics such as Formosa Plastics Corporation, Asahi Kasei Corporation, Excelite Plastics, China Petrochemical Corporation (SINOPEC) and others.
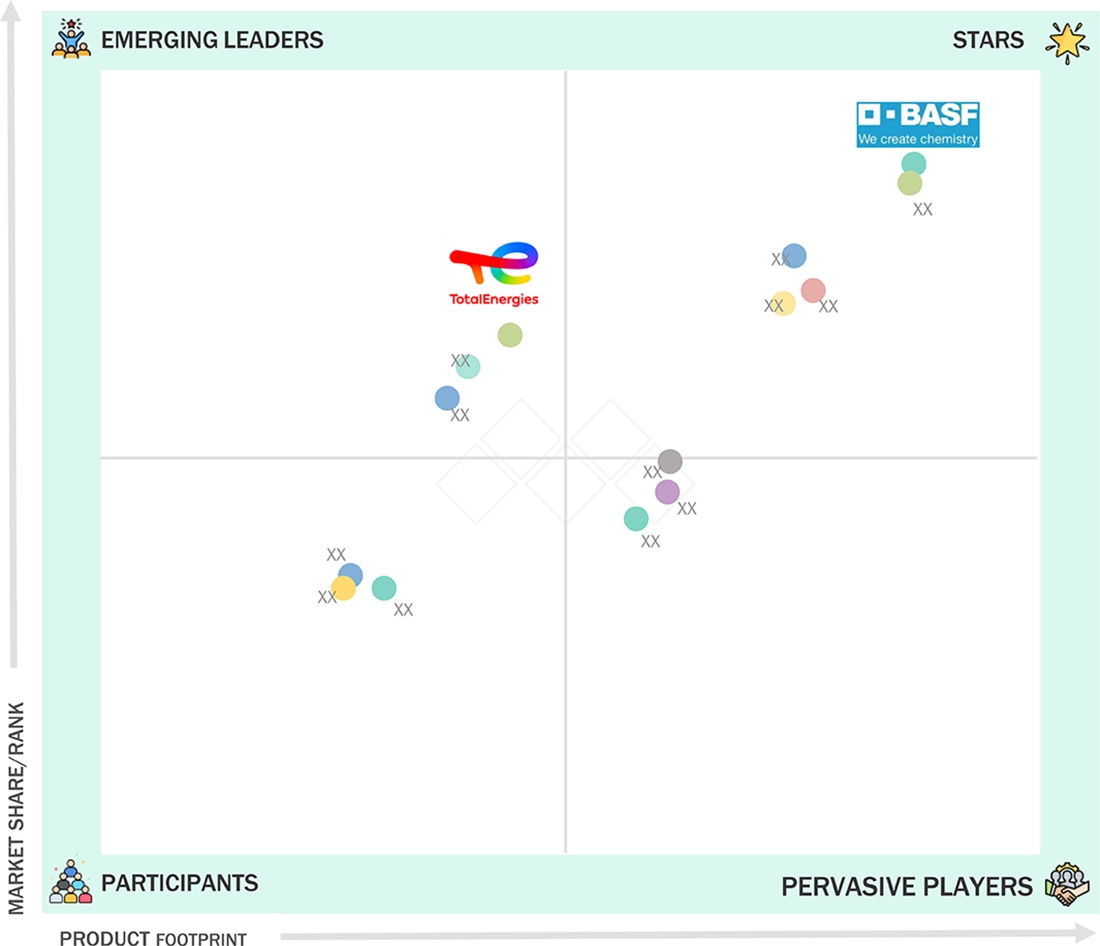
Construction Plastics Market: COMPANY EVALUATION MATRIX
BASF (Star) has a significant amount of production capacity, a broad international presence, and is committed to increasingly investing in new polymer technologies and sustainable products. These advantages have placed BASF as a frontrunner is the construction plastics sector. The product categories of PVC, PP, and PE are positioned across applications that span piping, insulation, roofing, flooring and windows leading to further market share gains. TotalEnergies (Emerging Leader) is expanding its portfolio of high-performance plastics and recycled plastics for construction applications in Europe, Asia, and the Middle East with an emphasis on providing more energy-efficient and more durable solutions. BASF is strengthening its position atop the market via capacity increases, new product development, and joint ventures with associated manufacturers and distributors, while TotalEnergies is accelerating its sustainability initiatives and converting to next-generation construction plastics.
Source: Secondary Research, Interviews with Experts, MarketsandMarkets Analysis
KEY MARKET PLAYERS
MARKET SCOPE
| REPORT METRIC | DETAILS |
|---|---|
| Market Size Value in 2024 | USD 118.36 Billion |
| Revenue Forecast in 2030 | USD 185.53 Billion |
| Growth Rate | CAGR of 7.9% from 2025–2030 |
| Actual Data | 2022–2030 |
| Base Year | 2024 |
| Forecast Period | 2030 |
| Units Considered | Value (USD Million), Volume (Kiloton) |
| Report Coverage | Revenue forecast, company ranking, competitive landscape, growth factors, and trends |
| Segments Covered | Plastic Type: PVC, PE, PP, PS, PU, and PC |
| Regional Scope | North America, Europe, Asia Pacific, Middle East & Africa, and South America |
WHAT IS IN IT FOR YOU: Construction Plastics Market REPORT CONTENT GUIDE
DELIVERED CUSTOMIZATIONS
We have successfully delivered the following deep-dive customizations:
| CLIENT REQUEST | CUSTOMIZATION DELIVERED | VALUE ADDS |
|---|---|---|
| Global Construction Plastic Producer | • Profiling on a highly detailed level of the top manufacturers of construction plastics (BASF, SABIC, Dow, LyondellBasell, Borealis, Formosa Plastics, INEOS, Solvay, Asahi Kasei, TotalEnergies) | • Enhanced competitiveness by benchmarking top players and their technological innovations |
| Flooring Manufacturer | • Detailed profiling of top flooring-grade construction plastics producers (BASF, SABIC, Dow, LyondellBasell, Borealis, Formosa Plastics, INEOS, Solvay, Asahi Kasei, TotalEnergies) | • Strategic insights for transitioning from traditional flooring materials to polymer-based solutions |
| Roofing Manufacturer | • Detailed profiling of leading construction plastics suppliers for roofing applications (BASF, SABIC, Dow, LyondellBasell, Borealis, Formosa Plastics, INEOS, Solvay, Asahi Kasei, TotalEnergies) | • Support for transitioning clients from conventional roofing materials to high-performance polymer solutions |
RECENT DEVELOPMENTS
- June 2025 : BASF unveiled Basotect EcoBalanced, a melamine foam for acoustic insulation that is lower PCF, this product enhances the acoustic characteristics of the interior while providing a reduced environmental footprint and expands the options for sustainable plastics for walls/ceilings in non-residential and residential construction.
- January 2025 : SABIC announced pressure and temperature resistance with long-term durability for hot- and cold-water piping systems, as well as HVAC products, thanks to their innovation in improves materials.
- December 2024 : BASF announced the completion of equipment installation milestones for HDPE (Easiplas) at the Zhanjiang Verbund site (China). This opens a pathway for scaled production of polyolefins for pipes and ducts, providing enhanced access to construction plastics in the region as well as bolstering the resilience of construction plastics supply chains.
- June 2024 : BASF and Wiskind collaborated to create biomass-balanced PU sandwich panels for commercial applications for building envelopes. This advances the engineering and commercialization of lower-carbon panel systems, provides more access to sustainable and lower-carbon solutions for walls and facades and enhances the existing contribution of PU towards energy-efficient building.
- May 2024 : Dow entered into an agreement for an annual supply of circular feedstock of 65,000 tonnes per year enabling the company to produce circular polyethylene and polypropylene for construction markets.
Table of Contents
 Exclusive indicates content/data unique to MarketsandMarkets and not available with any competitors.
Methodology
The study involves two major activities in estimating the current market size for the construction plastics market. Exhaustive secondary research was done to collect information on the market, peer market, and parent market. The next step was to validate these findings, assumptions, and sizing with industry experts across the value chain through primary research. Both top-down and bottom-up approaches were employed to estimate the complete market size. After that, market breakdown and data triangulation were used to estimate the market size of segments and subsegments.
Secondary Research
Secondary sources referred to for this research study include financial statements of companies offering construction plastics and information from various trade, business, and professional associations. Secondary research has been used to obtain critical information about the industry’s value chain, the total pool of key players, and market classification and segmentation according to industry trends, to the bottom-most level, and regional markets. The secondary data was collected and analyzed to arrive at the overall size of the construction plastics market, which was validated by primary respondents.
Primary Research
Extensive primary research was conducted after obtaining information regarding the construction plastics market scenario through secondary research. Several primary interviews were conducted with market experts from both the demand and supply sides across major countries of North America, Europe, Asia Pacific, the Middle East & Africa, and South America. Primary data was collected through questionnaires, emails, and telephonic interviews. The primary sources from the supply side included various industry experts, such as chief experience officers (CXOs), vice presidents (VPs), directors from business development & marketing, product development/innovation teams, and related key executives from the construction plastics industry, such as vendors, material providers, distributors, and key opinion leaders. Primary interviews were conducted to gather insights such as market statistics, data on revenue collected from the products and services, market breakdowns, market size estimations, market forecasting, and data triangulation. Primary research also helped in understanding the various trends related to plastic type, application, end-use industry, and region. Stakeholders from the demand side, such as CIOs, CTOs, CSOs, and installation teams of the customer/end users who are seeking construction plastic services, were interviewed to understand the buyer’s perspective on the suppliers, products, component providers, and their current usage of construction plastics and future outlook of their business, which will affect the overall market.
The Breakup of Primary Research

To know about the assumptions considered for the study, download the pdf brochure
Market Size Estimation
The research methodology employed to estimate the size of the construction plastics market includes the following details. The market sizing approach was based on demand analysis. The demand for construction plastics was assessed across various end-use industries at the regional level. This approach provided insights into the demand aspects of the construction plastics industry for each application. For every end-use category, all potential segments of the construction plastics market were integrated and mapped.

Data Triangulation
After arriving at the overall size from the market size estimation process explained above, the total market was split into several segments and subsegments. The data triangulation and market breakdown procedures explained below were implemented, wherever applicable, to complete the overall market engineering process and arrive at the exact statistics for various market segments and subsegments. The data was triangulated by studying various factors and trends from the demand and supply sides. Along with this, the market size was validated using both the top-down and bottom-up approaches.
Market Definition
Construction plastics refer to a diverse range of synthetic polymer-based materials specifically engineered for use in building and infrastructure applications due to their unique combination of durability, flexibility, and cost-effectiveness. These materials, which include polyvinyl chloride (PVC), polyethylene (PE), polypropylene (PP), and polystyrene (PS), are widely utilized in pipes, insulation, window profiles, roofing, flooring, and wall coverings. Their inherent advantages, such as resistance to corrosion, moisture, and chemicals, lightweight structure, and ease of installation, make them a preferred alternative to traditional construction materials like wood, steel, or concrete in many applications. Beyond functionality, construction plastics also contribute to improved energy efficiency through insulation and weatherproofing, supporting modern green building standards. Their adaptability in design and compatibility with modular and prefabricated construction enhance project efficiency and cost savings. While environmental concerns regarding waste management and recyclability pose challenges, advancements in sustainable formulations and recycling technologies are expanding their role in eco-friendly construction. Overall, construction plastics serve as essential materials in modern infrastructure and housing development, aligning with the global demand for durable, efficient, and innovative building solutions.
Stakeholders
- Construction Plastic Manufacturers
- Construction Plastic Distributors and Suppliers
- End-use Industries
- Universities, Governments, and Research Organizations
- Associations and Industrial Bodies
- R&D Institutes
- Environmental Support Agencies
- Investment Banks and Private Equity Firms
- Research and Consulting Firms
Report Objectives
- To define, describe, and forecast the construction plastics market size in terms of volume and value
- To provide detailed information regarding the key factors, such as drivers, restraints, opportunities, and challenges, influencing market growth
- To analyze and project the global construction plastics market by plastic type, application, end-use industry, and region
- To forecast the market size concerning five main regions (along with country-level data), namely, North America, Europe, Asia Pacific, Middle East & Africa, and South America, and analyze the significant region-specific trends
- To strategically analyze micromarkets with respect to individual growth trends, prospects, and contributions of the submarkets to the overall market
- To analyze the market opportunities and the competitive landscape for stakeholders and market leaders
- To assess recent market developments and competitive strategies, such as agreements, contracts, acquisitions, partnerships, collaborations, and product developments/product launches, to draw the competitive landscape
- To strategically profile the key market players and comprehensively analyze their core competencies
Key Questions Addressed by the Report
Who are the major companies in the construction plastics market? What key strategies have market players adopted to strengthen their market presence?
The key players include BASF (Germany), SABIC (Saudi Arabia), Dow (US), LyondellBasell Industries Holdings B.V. (US), Borealis GmbH (Austria), Formosa Plastics Corporation (Taiwan), INEOS (UK), Solvay (Belgium), Asahi Kasei Corporation (Japan), and TotalEnergies (France). Key strategies include new product launches, mergers & acquisitions, agreements, collaborations, partnerships, and expansions.
What are the drivers and opportunities for the construction plastics market?
Rising demand for lightweight, durable, and cost-effective materials; rapid urbanization and infrastructure development; integration of recycled and bio-based plastics; and growing use of transparent plastics (polycarbonate and acrylics) in modern architectural designs.
Which region is expected to hold the largest market share?
Asia Pacific is expected to be the largest market due to a strong industrial base, regulatory stringency, and technological leadership in major sectors.
What is the projected growth rate of the construction plastics market over the next five years?
The market is projected to register a CAGR of 7.9% during the forecast period.
How is the construction plastics market aligned for future growth?
The market is growing at a considerable pace and is consolidated, with many regional players expanding their production capacities through strategic initiatives.
Need a Tailored Report?
Customize this report to your needs
Get 10% FREE Customization
Customize This ReportPersonalize This Research
- Triangulate with your Own Data
- Get Data as per your Format and Definition
- Gain a Deeper Dive on a Specific Application, Geography, Customer or Competitor
- Any level of Personalization
Let Us Help You
- What are the Known and Unknown Adjacencies Impacting the Construction Plastics Market
- What will your New Revenue Sources be?
- Who will be your Top Customer; what will make them switch?
- Defend your Market Share or Win Competitors
- Get a Scorecard for Target Partners

Custom Market Research Services
We Will Customise The Research For You, In Case The Report Listed Above Does Not Meet With Your Requirements
Get 10% Free CustomisationTESTIMONIALS

We at Nissan Chemicals Corporation have been clients of MarketsandMarkets for more than a year now. We recently consulted MarketsandMarkets for a study, the team at MarketsandMarkets was extremely professional and organized. The business insights were very detailed and aligned well with our expectations that really helped us formulate the Business Plans and device new strategies for development themes. MarketsandMarkets offers a unique combination of expertise and dedicated engagement model. Their research findings have helped us in designing our Pricing Strategy which will make it easier for us to predict the future sales and profits for the next ten years. We look forward to working with MarketsandMarkets in the future.
VP of Strategy & New Business Development
Leading Specialty Chemical Company
The MarketsandMarkets Engagement Model, composed of both the Knowledge Store and advisory custom research, has greatly helped us in understanding our markets and making strategic decisions. The Knowledge Store is a fast way to allow everyone in our organization to understand more about most any market they are interested in. The ability to then get custom research done and get answers to specific strategic questions and market insight has been spectacular. The Markets and Markets team feel more like colleagues than vendors and their services have helped us change our culture where statements of things like growth opportunities and competitive position are always backed by industry research.

Rich Gibson,
Director, Corporate Strategy
Milliken & Company,
Leading Industrial Manufacturer of specialty chemical, floor covering, performance and protective textile materials, and healthcaremilliken.com
MarketsandMarkets is a trusted resource that helps us to better understand markets that are near-adjacencies-whether its technology, value chain or geography. Their Knowledge Store platform provides a dashboard of markets and their characteristics which is easy to use and saves us time.
Adam Shaw,
Market Development and Strategy Manager
AdvanSix Inc. USA,
An American Leader in Chemicalswww.advansix.com
The Knowledge Store from MarketsandMarkets is a valuable tool which has helped my team acquire greater insight in to the end markets that our business serves. This has enabled us to help our company build stronger strategies throughout our planning process.
TOSHIO KINOSHITA
Senior Chif Consultion Research & Consulting Division
Mitsubishi Chemical Research Corporation,
Leading Manufacturer of Chemical Productswww.mitsubishichem-res.co.jp/en/

We recently engaged with MarketsandMarkets for a study, the team not only clearly understood our business objectives but was also extremely professional in the way they handled the entire project. The study was efficiently conducted in a phase-wise manner, and the engagement model furnished us with high-quality business insights that far exceeded our expectations at each phase. We were especially happy that MarketsandMarkets could provide us with both, an English as well as a Japanese version of the study. A special thanks to the Analyst Team and Client Services Team, whose fluency in Japanese enhanced our comfort level, as we could converse with them in our preferred language.
Independent entrepreneurs
Arrow Precision
We approached MarketsandMarkets for study on Proppants Market, and their work exceeded our expectations. The study conducted was comprehensive and enabled us to view the market through the various dimensions. In addition, the team was extraordinarily responsive throughout the process and resolved our queries on time. I strongly recommend MarketsandMarkets and will certainly consider them for additional market assessments we will need in the future.
Global engineering company, Japan
Deputy Manager,
Strategic Planning OfficeThe high-quality insights shared by the MarketsandMarkets team helped us understand the pharmaceutical plant designers in a specific geography. It also captured the risks that we may likely face in communicating with our potential partners. The study would enable us identify partners, which would impact our future growth.


Growth opportunities and latent adjacency in Construction Plastics Market