Drone Package Delivery Market

Drone Package Delivery Market by Solution (Platform, Infrastructure, Software, Service), Type, Range (Short (<25 km), Medium (25–50 km), Long (>50 km)), Package Size, Duration, End Use, Operation Mode - Global Forecast to 2030

Report Code: AS 7465 Jul, 2024, by marketsandmarkets.com

[291 Pages Report] The volume of package delivery drones is projected to grow from 32,456 (In units) in 2024 to 275,703 (In units) by 2030. The Drone Package Delivery Market is projected to grow from USD 693 Million in 2024 to USD 4,666 Million by 2030, at a CAGR of 37.4%. There is rise in deployment of drones for quick and same day package delivery. Government approvals, cost-effectiveness delivery, reducing carbon emissions and instant package delivery are main reasons for the Drone Package Delivery Industry growth.

Drone Package Delivery Market

Drone Package Delivery Market

Drone Package Delivery Market Forecast to 2030

To know about the assumptions considered for the study, Request for Free Sample Report

Drone Package Delivery Market Dynamics

Driver: Increasing Demand for Fast Delivery Services

With customers willing to pay a premium for same-day delivery, the demand for fast delivery services is increasing rapidly. Innovations in cargo transportation and a rise in investments from logistics & transportation companies have spurred the use of delivery drones in e-commerce, quick-service restaurants, convenience stores, and healthcare. According to Invesp (US), approximately 51% of retail shoppers offer same-day delivery over long-duration deliveries as of January 2024. These factors have boosted the adoption of aerial delivery drones in the global e-commerce industry. Retailers are also trying to lower their delivery lead times and enhance the flexibility and speed of deliveries by maintaining stock-keeping units (SKUs) assisted by drones. In January 2024, Zipline (US) announced the integration of a new home delivery solution into Walmart stores in the Dallas-Fort Worth metro area. This expansion will increase the number of Walmart customers that Zipline serves by more than 1,000 times compared to the current operations with the retailer. Similarly, in February 2024, Wellspan Health (US) partnered with Zipline for medical delivery. WellSpan will use Zipline’s electric, autonomous drones to transport prescriptions directly to patients’ homes and move lab samples and medical products between its facilities, making deliveries up to 7 times faster than current automotive delivery.

Restraints: Extreme Weather Fluctuations

Weather significantly influences drone delivery services. In hot temperatures, air density decreases, affecting the lifting capacity of the drone. Similarly, cold weather impacts the energy capacity of the drone. Nature Scientific Reports conducted a study on the impact of weather on drone delivery services. The study suggests that most drones used for commercial applications should not fly in rain or snow, but they can tolerate temperatures between 0°C (32º F) and 40°C (104º F) and winds up to 36 km/h. It also examined the weather in 100 of the world’s most populous cities. It found that, on average, there are only 10 hours a day when the weather lets drones fly safely. Therefore, drone delivery systems must handle all weather conditions, including snow, fog, rain, and wind. However, companies find it challenging to build a reliable delivery system, thereby hindering market growth.

Opportunities: Use of Drones for Delivery in Military Operations

The use of drones for the delivery of military goods offers significant potential for the drone package delivery market. These drones can be used to resupply soldiers on the battlefield. Currently, a substantial portion of military supplies are transported through road convoys, which makes them vulnerable to enemy attacks. Meanwhile, drones take aerial routes, which can be changed to reduce the risks of enemy attacks on convoys. The use of drones to deliver military cargo further eliminates high-risk situations for soldiers in convoys. Deliveries using drones are also expected to be faster and safer than traditional road convoys. In response, drones are increasingly adopted in military settings for intelligence, surveillance, reconnaissance, and battle damage assessment. Additionally, autonomous drones are being employed to reduce the risks associated with defense logistics. These drones aid in supplying soldiers with crucial resources such as food, ammunition, fuel, and spare parts.

Challenges: Data Security Breaches

Operational security is a primary concern with the use of aerial delivery drones in civil and commercial applications. The growing use of drones in commercial applications has also increased drone hacking incidents. Drone manufacturers and associated service providers offer drone analytics software-as-a-service to their clients. This software uses cloud-based servers for data processing. Since data is transmitted and stored in external cloud networks, it is prone to hacking.

Additionally, countries such as the US, Colombia, France, and Mexico have witnessed the use of drones for drug smuggling. For instance, in April 2024, drone was caught delivering drugs in Prison of southern France. In 2023 more than 1,000 drones were detected in flight over prisons, 400 of which were “blocked” due to breaching the government regulations. Technically, unauthorized access to flight and control systems can lead to rerouted deliveries. Additionally, compromising customer data can undermine trust and compliance with privacy regulations. Such breaches necessitate strong encryption and severe cybersecurity measures to protect sensitive information and ensure operational integrity

Drones can also conduct surveillance operations, perform intelligence gathering, and move money or valuable messages over short distances without being detected. Thus, issues with the safety, security, and illegal use of these delivery drones may lead to a ban on their use in civil and commercial applications by government agencies, thereby reducing drone package deliveries globally.

Drone Package Delivery Market Ecosystem

Companies that design and manufacture Drone Package Delivery solutions, include government firms and industries as key stakeholders in Drone Package Delivery Market. Investors, funders, academic researchers, integrators, service providers, and licensing authorities are the major influencers in this market. Prominent companies in this market include Alphabet Inc. (US), Zipline International, Inc. (US), United Parcel Service of America, Inc. (US), Wingcopter (Wingcopter) and Matternet, Inc. (US).

Drone Package Delivery Market by Ecosystem

Based on the Range, the Short Range (<25 Km) Segment is Estimated to Account for the Largest Market Share During the Forecast Period

Based on the range, the short range (<25 km) segment is estimated to account for the largest market share during the forecast period. The market growth is attributed to the increasing use of drones for delivering food, medicine and e-commerce items within urban and suburban areas as it reduces the delivery time significantly by enabling instant and same-day delivery. The development in battery technology have improved the power efficiency and payload capacity of drones for enhanced short-range deliveries. The support from regulatory framework for apporval of delivery drone is driving the market growth of the segment.  

Based on the End Use, the Medical Aid Segment is Anticipated to Dominate the Market

Based End Use , the Medical Aid segment holds the largest market share. The growth of segment is primarily driven by need to deliver important medical supplies within the shortest time possible, especially to hard to reach or inaccessible areas. The increasing use of drones for supplies in the emergences situations and disaster management where quickest delivery can be a matter of life and death are driving the market growth of the segment.

The North America Market is Projected to Account Largest Share for the Drone Package Delivery Market

North America is projected to account largest share for the Drone Package Delivery market during the forecast period. Canada is projected to show the highest growth rate for the Drone Package Delivery market in North America. The domination of the Drone Package Delivery market in the North America can be attributed due to the presence of various key drone package delivery service providers  and increasing FAA approvals for development and deployment of drones for delivering packages.

Drone Package Delivery Market by Region

Drone Package Delivery Market by Region

To know about the assumptions considered for the study, download the pdf brochure

Key Market Players

The Drone Package Delivery Companies is dominated by a few globally established players such as Alphabet Inc. (US), Zipline International, Inc. (US), United Parcel Service of America, Inc. (US), Wingcopter (Germany) and Matternet, Inc. (US) are some of the leading players operating in the Drone Package Delivery market; they are the key service and solution providers that secured Drone Package Delivery partnerships in the last few years. Major focus was given to the partnerships and new product development due to the increasing demand of drone deliveries.

Get online access to the report on the World's First Market Intelligence Cloud

  • Easy to Download Historical Data & Forecast Numbers
  • Company Analysis Dashboard for high growth potential opportunities
  • Research Analyst Access for customization & queries
  • Competitor Analysis with Interactive dashboard
  • Latest News, Updates & Trend analysis
Request Sample

Scope of the Report

Report Metric

Details

Estimated Market Size

USD 693 Million in 2024

Projected Market Size

USD 4,666 Million by 2030

Growth Rate

37.4%

Market Size Available for Years

2020–2030

Base Year Considered

2023

Forecast Period

2024-2030

Forecast Units

Value (USD Million)

Segments Covered

By Solution, by Type, by Range, by Package Size, by Duration, by Operation Mode, by End Use, by Region

Geographies Covered

North America, Europe, Asia Pacific, Middle East, Latin America, Africa.

Companies Covered

Alphabet Inc. (US), Zipline International Inc. (US), United Parcel Service of America, Inc. (US), Wingcopter (Germany) and Matternet, Inc. (US) are some of the major players in the Drone Package Delivery Market.

Drone Package Delivery Market Highlights

The study categorizes the drone package delivery market based on Solution, Type, Range, Package Size, Operation Mode, Duration, End Use and Region.

Segment

Subsegment

By Solution

  • Platform
  • Service
  • Infrastructure
  • Software

By Range

  • Short (<25 km)
  • Medium (25-50 km)
  • Long (>50 km)

By Package Size

  • <2 kg
  • 2-5 kg
  • >5 kg

By Type

  • Fixed Wing
  • Multirotor
  • Hybrid

By Operation Mode

  • Partially Autonomous
  • Fully Autonomous

By Duration

  • Short Duration (<30 min)
  • Long Duration (>30 min)

By End Use

  • Food Delivery
  • Retail Goods Delivery
  • Postal Delivery
  • Medical Aid
  • Precision Agriculture
  • Industrial Delivery
  • Weapons & Ammunition
  • Maritime Delivery

By Region

  • North America
  • Europe
  • Asia Pacific
  • Middle East
  • Africa
  • Latin America

Recent Developments

  • In March 2024,  Alphabet, Inc. :- Wing Aviation LLC, a subsidiary of Alphabet, Inc., partnered with DoorDash (US) to expand drone delivery services in the US. Under this partnership, Wing Aviation will deliver Wendy’s meals in Christiansburg, Virginia, with the help of DoorDash.
  • In February 2024,  Zipline International, Inc. :- Zipline International Inc. partnered with the Government of Rwanda to create a new delivery service to promote economic development and wildlife conservation. Under this partnership with the Rwanda Development Board (RDB), Zipline will deliver products made by local artisans directly to guests at resorts and lodges.
  • In August 2023, United Parcel Service of America, Inc. :- UPS Flight Forward Inc., a subsidiary of United Parcel Service of America, Inc., collaborated with CVS Health to deliver prescription medications to the front lawns of patients’ homes and retirement facilities. As part of this collaboration, both companies will develop drone-based medical delivery services that take advantage of the convenience, speed, and accuracy of UAVs.

Frequently Asked Questions (FAQs) Addressed by the Report:

To speak to our analyst for a discussion on the above findings, click Speak to Analyst

TABLE OF CONTENTS
 
1 INTRODUCTION (Page No. - 27)
    1.1 STUDY OBJECTIVES 
    1.2 MARKET DEFINITION 
           1.2.1 INCLUSIONS AND EXCLUSIONS
           TABLE 1 INCLUSIONS AND EXCLUSIONS
    1.3 STUDY SCOPE 
           1.3.1 MARKETS COVERED
                    FIGURE 1 DRONE PACKAGE DELIVERY MARKET SEGMENTATION
           1.3.2 REGIONS COVERED
           1.3.3 YEARS CONSIDERED
    1.4 CURRENCY CONSIDERED 
           TABLE 2 USD EXCHANGE RATES
    1.5 STAKEHOLDERS 
    1.6 SUMMARY OF CHANGES 
 
2 RESEARCH METHODOLOGY (Page No. - 32)
    2.1 RESEARCH DATA 
           FIGURE 2 RESEARCH DESIGN MODEL
           FIGURE 3 RESEARCH DESIGN
           2.1.1 SECONDARY DATA
                    2.1.1.1 Key data from secondary sources
           2.1.2 PRIMARY DATA
                    2.1.2.1 Primary sources
                    2.1.2.2 Key data from primary sources
                    2.1.2.3 Breakdown of primary interviews
                    2.1.2.4 Key insights from industry experts
    2.2 FACTOR ANALYSIS 
           2.2.1 INTRODUCTION
           2.2.2 DEMAND-SIDE INDICATORS
           2.2.3 SUPPLY-SIDE INDICATORS
    2.3 MARKET SIZE ESTIMATION 
           2.3.1 BOTTOM-UP APPROACH
                    2.3.1.1 Market size estimation methodology (platform market)
                    2.3.1.2 Market size estimation methodology (infrastructure market)
                    2.3.1.3 Market size estimation methodology (software market)
                    2.3.1.4 Market size estimation methodology (service market)
                    2.3.1.5 Regional split of drone package delivery market
                               FIGURE 4 BOTTOM-UP APPROACH
           2.3.2 TOP-DOWN APPROACH
                    FIGURE 5 TOP-DOWN APPROACH
    2.4 DATA TRIANGULATION 
           FIGURE 6 DATA TRIANGULATION
    2.5 RESEARCH ASSUMPTIONS 
    2.6 RESEARCH LIMITATIONS 
    2.7 RISK ASSESSMENT 
 
3 EXECUTIVE SUMMARY (Page No. - 45)
    FIGURE 7 DRONE PACKAGE DELIVERY MARKET, BY SOLUTION, 2024−2030
    FIGURE 8 DRONE PACKAGE DELIVERY MARKET, BY TYPE, 2024−2030
    FIGURE 9 DRONE PACKAGE DELIVERY MARKET, BY RANGE, 2024−2030
    FIGURE 10 DRONE PACKAGE DELIVERY MARKET, BY PACKAGE SIZE, 2024−2030
    FIGURE 11 DRONE PACKAGE DELIVERY MARKET, BY DURATION, 2024−2030
    FIGURE 12 DRONE PACKAGE DELIVERY MARKET, BY END USE, 2024−2030
    FIGURE 13 DRONE PACKAGE DELIVERY MARKET, BY OPERATION MODE, 2024−2030
    FIGURE 14 DRONE PACKAGE DELIVERY MARKET, BY REGION, 2024−2030
 
4 PREMIUM INSIGHTS (Page No. - 50)
    4.1 ATTRACTIVE OPPORTUNITIES FOR PLAYERS IN DRONE PACKAGE DELIVERY MARKET 
           FIGURE 15 SURGING DEMAND FOR QUICK, SAME-DAY DELIVERY OF EMERGENCY SUPPLIES TO DRIVE MARKET
    4.2 DRONE PACKAGE DELIVERY MARKET, BY SOLUTION 
           FIGURE 16 PLATFORM TO BE LARGEST SEGMENT DURING FORECAST PERIOD
    4.3 DRONE PACKAGE DELIVERY MARKET, BY RANGE 
           FIGURE 17 SHORT RANGE SEGMENT TO BE DOMINANT DURING FORECAST PERIOD
    4.4 DRONE PACKAGE DELIVERY MARKET, BY PACKAGE SIZE 
           FIGURE 18 <2 KILOGRAMS SEGMENT TO SECURE LEADING MARKET POSITION DURING FORECAST PERIOD
    4.5 DRONE PACKAGE DELIVERY MARKET, BY DURATION 
           FIGURE 19 SHORT DURATION SEGMENT TO HOLD HIGHER SHARE DURING FORECAST PERIOD
    4.6 DRONE PACKAGE DELIVERY MARKET, BY END USE 
           FIGURE 20 MEDICAL AID DELIVERY TO SURPASS OTHER SEGMENTS DURING FORECAST PERIOD
    4.7 DRONE PACKAGE DELIVERY MARKET, BY COUNTRY 
           FIGURE 21 MALAYSIA TO BE FASTEST-GROWING MARKET DURING FORECAST PERIOD
 
5 MARKET OVERVIEW (Page No. - 54)
    5.1 INTRODUCTION 
    5.2 MARKET DYNAMICS 
           FIGURE 22 DRONE PACKAGE DELIVERY MARKET DYNAMICS
           5.2.1 DRIVERS
                    5.2.1.1 Increasing demand for fast delivery services
                               TABLE 3 TIME SAVINGS BY USE OF DRONES
                    5.2.1.2 Need for time-sensitive deliveries in healthcare sector
                    5.2.1.3 Cost-efficiency of drones compared with ground delivery vehicles
                               FIGURE 23 COST OF DRONE DELIVERIES VS. OTHER MODES
                    5.2.1.4 Ongoing infrastructural development for drone package delivery services
           5.2.2 RESTRAINTS
                    5.2.2.1 Extreme weather fluctuations
                    5.2.2.2 Lack of adequate infrastructure due to high installation costs
                    5.2.2.3 Limited bandwidth and battery life of delivery drones
           5.2.3 OPPORTUNITIES
                    5.2.3.1 Rising private investments in drones
                               FIGURE 24 INVESTMENTS IN COMMERCIAL DRONE INDUSTRY, 2014–2023 (USD MILLION)
                    5.2.3.2 Development of delivery drones for use in geographically challenging locations
                    5.2.3.3 Use of drones for delivery in military operations
           5.2.4 CHALLENGES
                    5.2.4.1 Data security breaches
                    5.2.4.2 Stringent government regulations and inadequate air traffic management
    5.3 VALUE CHAIN ANALYSIS 
           FIGURE 25 VALUE CHAIN ANALYSIS
    5.4 TRENDS AND DISRUPTIONS IMPACTING CUSTOMERS’ BUSINESSES 
           FIGURE 26 TRENDS AND DISRUPTIONS IMPACTING CUSTOMERS’ BUSINESSES
    5.5 CASE STUDY ANALYSIS 
           5.5.1 WING AVIATION LLC’S DRONE PACKAGE DELIVERY SERVICES
           5.5.2 AIRBUS’ SKYWAYS PARCEL DELIVERY DRONES
           5.5.3 MANNA DRONE DELIVERY’S CONTACTLESS DRONE DELIVERY SERVICES
           5.5.4 ELSIGHTS’ HALO PLATFORM
           5.5.5 ZIPLINE’S AUTOMATED DRONE DELIVERY SERVICES
    5.6 PRICING ANALYSIS 
           5.6.1 INDICATIVE PRICING ANALYSIS, BY REGION
                    TABLE 4 INDICATIVE PRICING ANALYSIS, BY REGION (USD)
           5.6.2 INDICATIVE PRICING ANALYSIS, BY RANGE
    5.7 ECOSYSTEM ANALYSIS 
           5.7.1 PROMINENT COMPANIES
           5.7.2 PRIVATE AND SMALL ENTERPRISES
           5.7.3 DISTRIBUTORS AND SUPPLIERS
           5.7.4 END USERS
                    FIGURE 27 ECOSYSTEM ANALYSIS
                    TABLE 5 ROLE OF COMPANIES IN ECOSYSTEM
    5.8 TRADE ANALYSIS 
           5.8.1 IMPORT VALUE OF (PRODUCT HARMONIZED SYSTEM CODE: 8806) UNMANNED AIRCRAFT
                    FIGURE 28 IMPORT DATA, BY COUNTRY, 2022−2023 (USD THOUSAND)
                    TABLE 6 IMPORT DATA, BY COUNTRY, 2022–2023 (USD THOUSAND)
           5.8.2 EXPORT VALUE OF (PRODUCT HARMONIZED SYSTEM CODE: 8806) UNMANNED AIRCRAFT
                    FIGURE 29 EXPORT DATA, BY COUNTRY, 2022−2023 (USD THOUSAND)
                    TABLE 7 EXPORT DATA, BY COUNTRY, 2022–2023 (USD THOUSAND)
    5.9 KEY CONFERENCES AND EVENTS, 2024–2025 
           TABLE 8 KEY CONFERENCES AND EVENTS, 2024–2025
    5.10 REGULATORY LANDSCAPE 
           5.10.1 REGULATORY BODIES, GOVERNMENT AGENCIES, AND OTHER ORGANIZATIONS
                    TABLE 9 NORTH AMERICA: REGULATORY BODIES, GOVERNMENT AGENCIES, AND OTHER ORGANIZATIONS
                    TABLE 10 EUROPE: REGULATORY BODIES, GOVERNMENT AGENCIES, AND OTHER ORGANIZATIONS
                    TABLE 11 ASIA PACIFIC: REGULATORY BODIES, GOVERNMENT AGENCIES, AND OTHER ORGANIZATIONS
                    TABLE 12 MIDDLE EAST & AFRICA: REGULATORY BODIES, GOVERNMENT AGENCIES, AND OTHER ORGANIZATIONS
                    TABLE 13 LATIN AMERICA: REGULATORY BODIES, GOVERNMENT AGENCIES, AND OTHER ORGANIZATIONS
           5.10.2 REGULATIONS RELATED TO DRONES
                    TABLE 14 REGULATIONS AND APPROVALS FOR COMMERCIAL DRONES, BY COUNTRY
                    5.10.2.1 North America
                               5.10.2.1.1 US
                                             TABLE 15 US: REGULATIONS BY FAA FOR OPERATION OF DRONES
                               5.10.2.1.2 Canada
                                             TABLE 16 CANADA: REGULATIONS BY FAA FOR OPERATION OF DRONES
                    5.10.2.2 Europe
                               5.10.2.2.1 UK
                                             TABLE 17 UK: REGULATIONS BY CAA FOR OPERATION OF DRONES
                               5.10.2.2.2 Germany
                                             TABLE 18 GERMANY: REGULATIONS BY CAA FOR OPERATION OF DRONES
                               5.10.2.2.3 France
                                             TABLE 19 FRANCE: REGULATIONS BY CAA FOR OPERATION OF DRONES
    5.11 KEY STAKEHOLDERS AND BUYING CRITERIA 
           5.11.1 KEY STAKEHOLDERS IN BUYING PROCESS
                    FIGURE 30 INFLUENCE OF STAKEHOLDERS ON BUYING PROCESS FOR TOP THREE SOLUTIONS
                    TABLE 20 INFLUENCE OF STAKEHOLDERS ON BUYING PROCESS FOR TOP THREE SOLUTIONS (%)
           5.11.2 BUYING CRITERIA
                    FIGURE 31 KEY BUYING CRITERIA FOR TOP THREE SOLUTIONS
                    TABLE 21 KEY BUYING CRITERIA FOR TOP THREE SOLUTIONS
    5.12 TECHNOLOGY ANALYSIS 
           5.12.1 KEY TECHNOLOGY
                    5.12.1.1 AI-powered drones
                    5.12.1.2 LiDAR
           5.12.2 COMPLEMENTARY TECHNOLOGY
                    5.12.2.1 Cloud computing
                    5.12.2.2 Automated air traffic management systems
    5.13 TECHNOLOGY ROADMAP 
           FIGURE 32 INTRODUCTION TO TECHNOLOGY ROADMAP
           FIGURE 33 EMERGING TRENDS RELATED TO DRONE PACKAGE DELIVERY
    5.14 OPERATIONAL DATA 
           TABLE 22 OPERATIONAL DRONES, BY REGION, 2020–2023 (UNITS)
    5.15 BILL OF MATERIALS 
           FIGURE 34 COMMERCIAL DRONE COMPONENT DISTRIBUTION
    5.16 TOTAL COST OF OWNERSHIP 
           FIGURE 35 DRONE LIFECYCLE PHASES
           FIGURE 36 TOTAL COST OF OWNERSHIP OF DRONES
           FIGURE 37 BREAKDOWN OF MAJOR COST CATEGORIES AS PERCENTAGE OF TOTAL LIFECYCLE COST
           TABLE 23 ESTIMATED COST OF DRONES
           TABLE 24 TECHNICAL COST OF DRONES
    5.17 BUSINESS MODELS 
           FIGURE 38 BUSINESS MODELS IN DRONE PACKAGE DELIVERY MARKET
           FIGURE 39 DRONE PACKAGE DELIVERY MARKET: BUSINESS MODELS COMPARISON
           5.17.1 DIRECT-TO-CONSUMER MODEL
           5.17.2 BUSINESS-TO-BUSINESS MODEL
           5.17.3 HYBRID DELIVERY MODEL
           5.17.4 DRONE-AS-A-SERVICE MODEL
    5.18 INVESTMENT AND FUNDING SCENARIO 
           FIGURE 40 INVESTMENT AND FUNDING SCENARIO, 2019−2023
    5.19 IMPACT OF GENERATIVE AI ON DRONE PACKAGE DELIVERY MARKET 
           5.19.1 INTRODUCTION
                    FIGURE 41 GENERATIVE AI IN DRONES
           5.19.2 ADOPTION OF GENERATIVE AI IN DRONES BY TOP COUNTRIES
                    FIGURE 42 ADOPTION OF GENERATIVE AI IN DRONES BY TOP COUNTRIES
           5.19.3 IMPACT OF GENERATIVE AI ON DRONE APPLICATIONS
                    FIGURE 43 IMPACT OF GENERATIVE AI ON DRONE APPLICATIONS
           5.19.4 IMPACT OF GENERATIVE AI ON DRONE PACKAGE DELIVERY MARKET
                    FIGURE 44 IMPACT OF GENERATIVE AI ON DRONE PACKAGE DELIVERY MARKET
                    FIGURE 45 IMPACT OF GENERATIVE AI ON DELIVERY DRONES
 
6 INDUSTRY TRENDS (Page No. - 95)
    6.1 INTRODUCTION 
    6.2 TECHNOLOGY TRENDS 
           FIGURE 46 TECHNOLOGY TRENDS RELATED TO DRONE PACKAGE DELIVERY
           6.2.1 DRONE SWARM TECHNOLOGY
           6.2.2 FOG COMPUTING
           6.2.3 BEYOND VISUAL LINE OF SIGHT
           6.2.4 AUTONOMY IN UNMANNED AERIAL SYSTEMS
                    6.2.4.1 Level 1
                    6.2.4.2 Level 2
                    6.2.4.3 Level 3
                    6.2.4.4 Level 4
                    6.2.4.5 Level 5
           TABLE 25 AUTONOMY IN UNMANNED AERIAL SYSTEMS
           6.2.5 COMPUTER VISION
           6.2.6 MULTI-SENSOR DATA FUSION
           6.2.7 ADVANCED ALGORITHMS AND ANALYTICS FOR DRONE DELIVERY
           FIGURE 47 ALGORITHMS AND ANALYTICS FOR DRONE PACKAGE DELIVERY
    6.3 IMPACT OF MEGATRENDS 
           6.3.1 RAPID URBANIZATION
           6.3.2 BLOCKCHAIN AND IOT
    6.4 PATENT ANALYSIS 
           FIGURE 48 PATENT ANALYSIS
           TABLE 26 PATENT ANALYSIS
 
7 DRONE PACKAGE DELIVERY MARKET, BY SOLUTION (Page No. - 105)
    7.1 INTRODUCTION 
           FIGURE 49 PLATFORM SEGMENT TO LEAD MARKET DURING FORECAST PERIOD
           TABLE 27 DRONE PACKAGE DELIVERY MARKET, BY SOLUTION, 2020–2023 (USD MILLION)
           TABLE 28 DRONE PACKAGE DELIVERY MARKET, BY SOLUTION, 2024–2030 (USD MILLION)
    7.2 PLATFORM 
           7.2.1 PROPULSION SEGMENT TO DRIVE MARKET
                    TABLE 29 DRONE PACKAGE DELIVERY MARKET, BY PLATFORM, 2020–2023 (USD MILLION)
                    TABLE 30 DRONE PACKAGE DELIVERY MARKET, BY PLATFORM, 2024–2030 (USD MILLION)
                    FIGURE 50 DRONE PACKAGE DELIVERY PLATFORM VOLUME, BY REGION, 2020–2030 (UNITS)
                    TABLE 31 DRONE PACKAGE DELIVERY PLATFORM VOLUME, BY REGION, 2020–2030 (UNITS)
           7.2.2 AIRFRAME
           7.2.3 AVIONICS & SENSORY PAYLOAD
           7.2.4 PROPULSION
           7.2.5 SOFTWARE
    7.3 SOFTWARE 
           7.3.1 ROUTE PLANNING & OPTIMIZING SEGMENT TO DRIVE MARKET
                    TABLE 32 DRONE PACKAGE DELIVERY MARKET, BY SOFTWARE, 2020–2023 (USD MILLION)
                    TABLE 33 DRONE PACKAGE DELIVERY MARKET, BY SOFTWARE, 2024–2030 (USD MILLION)
           7.3.2 ROUTE PLANNING & OPTIMIZING
           7.3.3 INVENTORY MANAGEMENT
           7.3.4 LIVE TRACKING
           7.3.5 FLEET MANAGEMENT
           7.3.6 COMPUTER VISION
    7.4 INFRASTRUCTURE 
           7.4.1 GROUND CONTROL STATIONS SEGMENT TO DRIVE MARKET
                    TABLE 34 DRONE PACKAGE DELIVERY MARKET, BY INFRASTRUCTURE, 2020–2023 (USD MILLION)
                    TABLE 35 DRONE PACKAGE DELIVERY MARKET, BY INFRASTRUCTURE, 2024–2030 (USD MILLION)
           7.4.2 GROUND CONTROL STATIONS
           7.4.3 CHARGING STATIONS
           7.4.4 LANDING PADS
           7.4.5 MICRO-FULFILLMENT CENTERS
    7.5 SERVICE 
           7.5.1 HEALTHCARE, LOGISTICS, & FOOD INDUSTRIES TO DRIVE MARKET
           7.5.2 SECOND-PARTY LOGISTICS
           7.5.3 THIRD-PARTY LOGISTICS
           7.5.4 FOURTH-PARTY LOGISTICS
 
8 DRONE PACKAGE DELIVERY MARKET, BY RANGE (Page No. - 116)
    8.1 INTRODUCTION 
           FIGURE 51 SHORT RANGE (<25 KILOMETERS) SEGMENT TO LEAD MARKET DURING FORECAST PERIOD
           TABLE 36 DRONE PACKAGE DELIVERY MARKET, BY RANGE, 2020–2023 (USD MILLION)
           TABLE 37 DRONE PACKAGE DELIVERY MARKET, BY RANGE, 2024–2030 (USD MILLION)
    8.2 SHORT RANGE (<25 KILOMETERS) 
           8.2.1 RISE IN ON-DEMAND FOOD DELIVERIES TO DRIVE MARKET
    8.3 MEDIUM RANGE (25–50 KILOMETERS) 
           8.3.1 NEED FOR FASTER AND MORE COST-EFFECTIVE DELIVERY OPTIONS TO DRIVE MARKET
    8.4 LONG RANGE (>50 KILOMETERS) 
           8.4.1 FOCUS ON REDUCING CARBON EMISSIONS TO DRIVE MARKET
 
9 DRONE PACKAGE DELIVERY MARKET, BY TYPE (Page No. - 120)
    9.1 INTRODUCTION 
           FIGURE 52 HYBRID SEGMENT TO LEAD MARKET DURING FORECAST PERIOD
           TABLE 38 DRONE PACKAGE DELIVERY MARKET, BY TYPE, 2020–2023 (USD MILLION)
           TABLE 39 DRONE PACKAGE DELIVERY MARKET, BY TYPE, 2024–2030 (USD MILLION)
    9.2 FIXED WING 
           9.2.1 EXCELLENT STABILITY AND ENDURANCE TO DRIVE MARKET
    9.3 MULTIROTOR 
           9.3.1 EASE OF CONTROL AND MANEUVERABILITY TO DRIVE MARKET
    9.4 HYBRID 
           9.4.1 RAPID DEPLOYMENT AND LARGE PAYLOAD CAPACITY TO DRIVE MARKET
 
10 DRONE PACKAGE DELIVERY MARKET, BY PACKAGE SIZE (Page No. - 124)
     10.1 INTRODUCTION 
             FIGURE 53 <2 KILOGRAMS SEGMENT TO LEAD MARKET DURING FORECAST PERIOD
             TABLE 40 DRONE PACKAGE DELIVERY MARKET, BY PACKAGE SIZE, 2020–2023 (USD MILLION)
             TABLE 41 DRONE PACKAGE DELIVERY MARKET, BY PACKAGE SIZE, 2024–2030 (USD MILLION)
     10.2 <2 KILOGRAMS 
             10.2.1 CONVENIENCE OF INSTANT DELIVERIES DURING MEDICAL EMERGENCIES TO DRIVE MARKET
     10.3 2–5 KILOGRAMS 
             10.3.1 SURGE IN E-COMMERCE ORDERS TO DRIVE MARKET
     10.4 >5 KILOGRAMS 
             10.4.1 RAPID DEVELOPMENT OF HIGH LOAD-CARRYING DRONES TO DRIVE MARKET
 
11 DRONE PACKAGE DELIVERY MARKET, BY DURATION (Page No. - 128)
     11.1 INTRODUCTION 
             FIGURE 54 SHORT DURATION (<30 MINUTES) SEGMENT TO LEAD MARKET DURING FORECAST PERIOD
             TABLE 42 DRONE PACKAGE DELIVERY MARKET, BY DURATION, 2020–2023 (USD MILLION)
             TABLE 43 DRONE PACKAGE DELIVERY MARKET, BY DURATION, 2024–2030 (USD MILLION)
     11.2 SHORT DURATION (<30 MINUTES) 
             11.2.1 QUICK DELIVERIES DUE TO IMPROVEMENTS IN DRONE PROPULSION SYSTEMS TO DRIVE MARKET
     11.3 LONG DURATION (>30 MINUTES) 
             11.3.1 PREDOMINANT USE IN BULK SHIPMENTS OR POSTAL PACKAGES TO DRIVE MARKET
 
12 DRONE PACKAGE DELIVERY MARKET, BY OPERATION MODE (Page No. - 131)
     12.1 INTRODUCTION 
             FIGURE 55 PARTIALLY AUTONOMOUS SEGMENT TO LEAD MARKET DURING FORECAST PERIOD
             TABLE 44 DRONE PACKAGE DELIVERY MARKET, BY OPERATION MODE, 2020–2023 (USD MILLION)
             TABLE 45 DRONE PACKAGE DELIVERY MARKET, BY OPERATION MODE, 2024–2030 (USD MILLION)
     12.2 PARTIALLY AUTONOMOUS 
             12.2.1 TIMELY DELIVERIES OF EMERGENCY MEDICAL SUPPLIES TO DRIVE MARKET
     12.3 FULLY AUTONOMOUS 
             12.3.1 IMPROVED EFFICIENCY DUE TO LIMITED HUMAN INTERVENTION TO DRIVE MARKET
 
13 DRONE PACKAGE DELIVERY MARKET, BY END USE (Page No. - 135)
     13.1 INTRODUCTION 
             FIGURE 56 MEDICAL AID DELIVERY SEGMENT TO LEAD MARKET DURING FORECAST PERIOD
             TABLE 46 DRONE PACKAGE DELIVERY MARKET, BY END USE, 2020–2023 (USD MILLION)
             TABLE 47 DRONE PACKAGE DELIVERY MARKET, BY END USE, 2024–2030 (USD MILLION)
     13.2 FOOD DELIVERY 
             13.2.1 FOCUS ON MAINTAINING FOOD FRESHNESS AND QUALITY TO DRIVE MARKET
             13.2.2 GROCERIES
             13.2.3 FOOD & BEVERAGES
     13.3 RETAIL GOODS DELIVERY 
             13.3.1 GROWING PREFERENCE FOR ONLINE SHOPPING TO DRIVE MARKET
             13.3.2 BOOKS
             13.3.3 CONSUMER ELECTRONICS
             13.3.4 CLOTHES & APPAREL
             13.3.5 OTHERS
     13.4 POSTAL DELIVERY 
             13.4.1 BOOMING E-COMMERCE INDUSTRY TO DRIVE MARKET
     13.5 MEDICAL AID DELIVERY 
             13.5.1 NEED FOR TIMELY DELIVERY OF SHORT-LIFESPAN PRODUCTS TO DRIVE MARKET
                        TABLE 48 MEDICAL AID DELIVERY: DRONE PACKAGE DELIVERY MARKET, BY END USE, 2020–2023 (USD MILLION)
                        TABLE 49 MEDICAL AID DELIVERY: DRONE PACKAGE DELIVERY MARKET, BY END USE, 2024–2030 (USD MILLION)
             13.5.2 MEDICINE SUPPLY
             13.5.3 BLOOD SUPPLY
             13.5.4 ORGAN TRANSPORT
             13.5.5 EQUIPMENT TRANSPORT
             13.5.6 OTHERS
     13.6 PRECISION AGRICULTURE DELIVERY 
             13.6.1 WIDE RANGE OF APPLICATIONS IN AGRICULTURE INDUSTRY TO DRIVE MARKET
             13.6.2 PESTICIDE, FERTILIZER, & DISINFECTANT SPRAYING
             13.6.3 PLANTING & SEEDING
             13.6.4 DRONE IRRIGATION
     13.7 INDUSTRIAL DELIVERY 
             13.7.1 RISING DEMAND FOR SPARE PARTS DELIVERY IN HARD-TO-REACH LOCATIONS TO DRIVE MARKET
     13.8 WEAPONS & AMMUNITION DELIVERY 
             13.8.1 ONGOING DEVELOPMENT OF INTELLIGENT UNMANNED SUPPORT SYSTEMS TO DRIVE MARKET
     13.9 MARITIME DELIVERY 
             13.9.1 GROWING USE OF DRONES IN SHORE-TO-SHIP AND SHIP-TO-SHIP DELIVERIES TO DRIVE MARKET
             13.9.2 SHIP-TO-SHIP DELIVERY
             13.9.3 SHORE-TO-SHIP DELIVERY
 
14 DRONE PACKAGE DELIVERY MARKET, BY REGION (Page No. - 147)
     14.1 INTRODUCTION 
     14.2 REGIONAL RECESSION IMPACT ANALYSIS 
             FIGURE 57 NORTH AMERICA TO BE LARGEST MARKET FOR DRONE PACKAGE DELIVERY
             TABLE 50 DRONE PACKAGE DELIVERY MARKET, BY REGION, 2020–2023 (USD MILLION)
             TABLE 51 DRONE PACKAGE DELIVERY MARKET, BY REGION, 2024–2030 (USD MILLION)
     14.3 NORTH AMERICA 
             14.3.1 RECESSION IMPACT ANALYSIS
             14.3.2 PESTLE ANALYSIS
                        FIGURE 58 NORTH AMERICA: DRONE PACKAGE DELIVERY MARKET SNAPSHOT
                        TABLE 52 NORTH AMERICA: DRONE PACKAGE DELIVERY MARKET, BY COUNTRY, 2020–2023 (USD MILLION)
                        TABLE 53 NORTH AMERICA: DRONE PACKAGE DELIVERY MARKET, BY COUNTRY, 2024–2030 (USD MILLION)
                        TABLE 54 NORTH AMERICA: DRONE PACKAGE DELIVERY MARKET, BY SOLUTION, 2020–2023 (USD MILLION)
                        TABLE 55 NORTH AMERICA: DRONE PACKAGE DELIVERY MARKET, BY SOLUTION, 2024–2030 (USD MILLION)
                        TABLE 56 NORTH AMERICA: DRONE PACKAGE DELIVERY MARKET, BY PACKAGE SIZE, 2020–2023 (USD MILLION)
                        TABLE 57 NORTH AMERICA: DRONE PACKAGE DELIVERY MARKET, BY PACKAGE SIZE, 2024–2030 (USD MILLION)
             14.3.3 US
                        14.3.3.1 Presence of major delivery drone manufacturers to drive market
                                     TABLE 58 US: DRONE PACKAGE DELIVERY MARKET, BY SOLUTION, 2020–2023 (USD MILLION)
                                     TABLE 59 US: DRONE PACKAGE DELIVERY MARKET, BY SOLUTION, 2024–2030 (USD MILLION)
                                     TABLE 60 US: DRONE PACKAGE DELIVERY MARKET, BY PACKAGE SIZE, 2020–2023 (USD MILLION)
                                     TABLE 61 US: DRONE PACKAGE DELIVERY MARKET, BY PACKAGE SIZE, 2024–2030 (USD MILLION)
             14.3.4 CANADA
                        14.3.4.1 Increasing investments in deployment of drones to drive market
                                     TABLE 62 CANADA: DRONE PACKAGE DELIVERY MARKET, BY SOLUTION, 2020–2023 (USD MILLION)
                                     TABLE 63 CANADA: DRONE PACKAGE DELIVERY MARKET, BY SOLUTION, 2024–2030 (USD MILLION)
                                     TABLE 64 CANADA: DRONE PACKAGE DELIVERY MARKET, BY PACKAGE SIZE, 2020–2023 (USD MILLION)
                                     TABLE 65 CANADA: DRONE PACKAGE DELIVERY MARKET, BY PACKAGE SIZE, 2024–2030 (USD MILLION)
     14.4 EUROPE 
             14.4.1 PESTLE ANALYSIS
                        FIGURE 59 EUROPE: DRONE PACKAGE DELIVERY MARKET SNAPSHOT
                        TABLE 66 EUROPE: DRONE PACKAGE DELIVERY MARKET, BY COUNTRY, 2020–2023 (USD MILLION)
                        TABLE 67 EUROPE: DRONE PACKAGE DELIVERY MARKET, BY COUNTRY, 2024–2030 (USD MILLION)
                        TABLE 68 EUROPE: DRONE PACKAGE DELIVERY MARKET, BY SOLUTION, 2020–2023 (USD MILLION)
                        TABLE 69 EUROPE: DRONE PACKAGE DELIVERY MARKET, BY SOLUTION, 2024–2030 (USD MILLION)
                        TABLE 70 EUROPE: DRONE PACKAGE DELIVERY MARKET, BY PACKAGE SIZE, 2020–2023 (USD MILLION)
                        TABLE 71 EUROPE: DRONE PACKAGE DELIVERY MARKET, BY PACKAGE SIZE, 2024–2030 (USD MILLION)
             14.4.2 UK
                        14.4.2.1 Development of innovative technologies by drone manufacturers to drive market
                                     TABLE 72 UK: DRONE PACKAGE DELIVERY MARKET, BY SOLUTION, 2020–2023 (USD MILLION)
                                     TABLE 73 UK: DRONE PACKAGE DELIVERY MARKET, BY SOLUTION, 2024–2030 (USD MILLION)
                                     TABLE 74 UK: DRONE PACKAGE DELIVERY MARKET, BY PACKAGE SIZE, 2020–2023 (USD MILLION)
                                     TABLE 75 UK: DRONE PACKAGE DELIVERY MARKET, BY PACKAGE SIZE, 2024–2030 (USD MILLION)
             14.4.3 GERMANY
                        14.4.3.1 Regulatory approvals for drone operations to drive market
                                     TABLE 76 GERMANY: DRONE PACKAGE DELIVERY MARKET, BY SOLUTION, 2020–2023 (USD MILLION)
                                     TABLE 77 GERMANY: DRONE PACKAGE DELIVERY MARKET, BY SOLUTION, 2024–2030 (USD MILLION)
                                     TABLE 78 GERMANY: DRONE PACKAGE DELIVERY MARKET, BY PACKAGE SIZE, 2020–2023 (USD MILLION)
                                     TABLE 79 GERMANY: DRONE PACKAGE DELIVERY MARKET, BY PACKAGE SIZE, 2024–2030 (USD MILLION)
             14.4.4 FRANCE
                        14.4.4.1 Surge in drone delivery testing to drive market
                                     TABLE 80 FRANCE: DRONE PACKAGE DELIVERY MARKET, BY SOLUTION, 2020–2023 (USD MILLION)
                                     TABLE 81 FRANCE: DRONE PACKAGE DELIVERY MARKET, BY SOLUTION, 2024–2030 (USD MILLION)
                                     TABLE 82 FRANCE: DRONE PACKAGE DELIVERY MARKET, BY PACKAGE SIZE, 2020–2023 (USD MILLION)
                                     TABLE 83 FRANCE: DRONE PACKAGE DELIVERY MARKET, BY PACKAGE SIZE, 2024–2030 (USD MILLION)
             14.4.5 SWITZERLAND
                        14.4.5.1 Large-scale drone delivery operations to drive market
                                     TABLE 84 SWITZERLAND: DRONE PACKAGE DELIVERY MARKET, BY SOLUTION, 2020–2023 (USD MILLION)
                                     TABLE 85 SWITZERLAND: DRONE PACKAGE DELIVERY MARKET, BY SOLUTION, 2024–2030 (USD MILLION)
                                     TABLE 86 SWITZERLAND: DRONE PACKAGE DELIVERY MARKET, BY PACKAGE SIZE, 2020–2023 (USD MILLION)
                                     TABLE 87 SWITZERLAND: DRONE PACKAGE DELIVERY MARKET, BY PACKAGE SIZE, 2024–2030 (USD MILLION)
             14.4.6 REST OF EUROPE
                        TABLE 88 REST OF EUROPE: DRONE PACKAGE DELIVERY MARKET, BY SOLUTION, 2020–2023 (USD MILLION)
                        TABLE 89 REST OF EUROPE: DRONE PACKAGE DELIVERY MARKET, BY SOLUTION, 2024–2030 (USD MILLION)
                        TABLE 90 REST OF EUROPE: DRONE PACKAGE DELIVERY MARKET, BY PACKAGE SIZE, 2020–2023 (USD MILLION)
                        TABLE 91 REST OF EUROPE: DRONE PACKAGE DELIVERY MARKET, BY PACKAGE SIZE, 2024–2030 (USD MILLION)
     14.5 ASIA PACIFIC 
             14.5.1 PESTLE ANALYSIS
             14.5.2 RECESSION IMPACT ANALYSIS
                        FIGURE 60 ASIA PACIFIC: DRONE PACKAGE DELIVERY MARKET SNAPSHOT
                        TABLE 92 ASIA PACIFIC: DRONE PACKAGE DELIVERY MARKET, BY COUNTRY, 2020–2023 (USD MILLION)
                        TABLE 93 ASIA PACIFIC: DRONE PACKAGE DELIVERY MARKET, BY COUNTRY, 2024–2030 (USD MILLION)
                        TABLE 94 ASIA PACIFIC: DRONE PACKAGE DELIVERY MARKET, BY SOLUTION, 2020–2023 (USD MILLION)
                        TABLE 95 ASIA PACIFIC: DRONE PACKAGE DELIVERY MARKET, BY SOLUTION, 2024–2030 (USD MILLION)
                        TABLE 96 ASIA PACIFIC: DRONE PACKAGE DELIVERY MARKET, BY PACKAGE SIZE, 2020–2023 (USD MILLION)
                        TABLE 97 ASIA PACIFIC: DRONE PACKAGE DELIVERY MARKET, BY PACKAGE SIZE, 2024–2030 (USD MILLION)
             14.5.3 CHINA
                        14.5.3.1 Increasing demand for same-day deliveries to drive market
                                     TABLE 98 CHINA: DRONE PACKAGE DELIVERY MARKET, BY SOLUTION, 2020–2023 (USD MILLION)
                                     TABLE 99 CHINA: DRONE PACKAGE DELIVERY MARKET, BY SOLUTION, 2024–2030 (USD MILLION)
                                     TABLE 100 CHINA: DRONE PACKAGE DELIVERY MARKET, BY PACKAGE SIZE, 2020–2023 (USD MILLION)
                                     TABLE 101 CHINA: DRONE PACKAGE DELIVERY MARKET, BY PACKAGE SIZE, 2024–2030 (USD MILLION)
             14.5.4 INDIA
                        14.5.4.1 Emergence of drone start-ups to drive market
                                     TABLE 102 INDIA: DRONE PACKAGE DELIVERY MARKET, BY SOLUTION, 2020–2023 (USD MILLION)
                                     TABLE 103 INDIA: DRONE PACKAGE DELIVERY MARKET, BY SOLUTION, 2024–2030 (USD MILLION)
                                     TABLE 104 INDIA: DRONE PACKAGE DELIVERY MARKET, BY PACKAGE SIZE, 2020–2023 (USD MILLION)
                                     TABLE 105 INDIA: DRONE PACKAGE DELIVERY MARKET, BY PACKAGE SIZE, 2024–2030 (USD MILLION)
             14.5.5 JAPAN
                        14.5.5.1 Domestic manufacturers’ effort toward promoting drone operations to drive market
                                     TABLE 106 JAPAN: DRONE PACKAGE DELIVERY MARKET, BY SOLUTION, 2020–2023 (USD MILLION)
                                     TABLE 107 JAPAN: DRONE PACKAGE DELIVERY MARKET, BY SOLUTION, 2024–2030 (USD MILLION)
                                     TABLE 108 JAPAN: DRONE PACKAGE DELIVERY MARKET, BY PACKAGE SIZE, 2020–2023 (USD MILLION)
                                     TABLE 109 JAPAN: DRONE PACKAGE DELIVERY MARKET, BY PACKAGE SIZE, 2024–2030 (USD MILLION)
             14.5.6 AUSTRALIA
                        14.5.6.1 Favorable regulatory environment for drone deliveries to drive market
                                     TABLE 110 AUSTRALIA: DRONE PACKAGE DELIVERY MARKET, BY SOLUTION, 2020–2023 (USD MILLION)
                                     TABLE 111 AUSTRALIA: DRONE PACKAGE DELIVERY MARKET, BY SOLUTION, 2024–2030 (USD MILLION)
                                     TABLE 112 AUSTRALIA: DRONE PACKAGE DELIVERY MARKET, BY PACKAGE SIZE, 2020–2023 (USD MILLION)
                                     TABLE 113 AUSTRALIA: DRONE PACKAGE DELIVERY MARKET, BY PACKAGE SIZE, 2024–2030 (USD MILLION)
             14.5.7 MALAYSIA
                        14.5.7.1 Focus on cross-border drone delivery services to drive market
                                     TABLE 114 MALAYSIA: DRONE PACKAGE DELIVERY MARKET, BY SOLUTION, 2020–2023 (USD MILLION)
                                     TABLE 115 MALAYSIA: DRONE PACKAGE DELIVERY MARKET, BY SOLUTION, 2024–2030 (USD MILLION)
                                     TABLE 116 MALAYSIA: DRONE PACKAGE DELIVERY MARKET, BY PACKAGE SIZE, 2020–2023 (USD MILLION)
                                     TABLE 117 MALAYSIA: DRONE PACKAGE DELIVERY MARKET, BY PACKAGE SIZE, 2024–2030 (USD MILLION)
             14.5.8 REST OF ASIA PACIFIC
                        TABLE 118 REST OF ASIA PACIFIC: DRONE PACKAGE DELIVERY MARKET, BY SOLUTION, 2020–2023 (USD MILLION)
                        TABLE 119 REST OF ASIA PACIFIC: DRONE PACKAGE DELIVERY MARKET, BY SOLUTION, 2024–2030 (USD MILLION)
                        TABLE 120 REST OF ASIA PACIFIC: DRONE PACKAGE DELIVERY MARKET, BY PACKAGE SIZE, 2020–2023 (USD MILLION)
                        TABLE 121 REST OF ASIA PACIFIC: DRONE PACKAGE DELIVERY MARKET, BY PACKAGE SIZE, 2024–2030 (USD MILLION)
     14.6 MIDDLE EAST 
             14.6.1 PESTLE ANALYSIS
             14.6.2 RECESSION IMPACT ANALYSIS
                        FIGURE 61 MIDDLE EAST: DRONE PACKAGE DELIVERY MARKET SNAPSHOT
                        TABLE 122 MIDDLE EAST: DRONE PACKAGE DELIVERY MARKET, BY COUNTRY, 2020–2023 (USD MILLION)
                        TABLE 123 MIDDLE EAST: DRONE PACKAGE DELIVERY MARKET, BY COUNTRY, 2024–2030 (USD MILLION)
                        TABLE 124 MIDDLE EAST: DRONE PACKAGE DELIVERY MARKET, BY SOLUTION, 2020–2023 (USD MILLION)
                        TABLE 125 MIDDLE EAST: DRONE PACKAGE DELIVERY MARKET, BY SOLUTION, 2024–2030 (USD MILLION)
                        TABLE 126 MIDDLE EAST: DRONE PACKAGE DELIVERY MARKET, BY PACKAGE SIZE, 2020–2023 (USD MILLION)
                        TABLE 127 MIDDLE EAST: DRONE PACKAGE DELIVERY MARKET, BY PACKAGE SIZE, 2024–2030 (USD MILLION)
             14.6.3 GCC
                        14.6.3.1 UAE
                                     14.6.3.1.1 Flexible drone regulations to drive market
                                                    TABLE 128 UAE: DRONE PACKAGE DELIVERY MARKET, BY SOLUTION, 2020–2023 (USD MILLION)
                                                    TABLE 129 UAE: DRONE PACKAGE DELIVERY MARKET, BY SOLUTION, 2024–2030 (USD MILLION)
                                                    TABLE 130 UAE: DRONE PACKAGE DELIVERY MARKET, BY PACKAGE SIZE, 2020–2023 (USD MILLION)
                                                    TABLE 131 UAE: DRONE PACKAGE DELIVERY MARKET, BY PACKAGE SIZE, 2024–2030 (USD MILLION)
                        14.6.3.2 SAUDI ARABIA
                                     14.6.3.2.1 Emphasis on developing commercial and military drones to drive market
                                                    TABLE 132 SAUDI ARABIA: DRONE PACKAGE DELIVERY MARKET, BY SOLUTION, 2020–2023 (USD MILLION)
                                                    TABLE 133 SAUDI ARABIA: DRONE PACKAGE DELIVERY MARKET, BY SOLUTION, 2024–2030 (USD MILLION)
                                                    TABLE 134 SAUDI ARABIA: DRONE PACKAGE DELIVERY MARKET, BY PACKAGE SIZE, 2020–2023 (USD MILLION)
                                                    TABLE 135 SAUDI ARABIA: DRONE PACKAGE DELIVERY MARKET, BY PACKAGE SIZE, 2024–2030 (USD MILLION)
             14.6.4 REST OF MIDDLE EAST
                        TABLE 136 REST OF MIDDLE EAST: DRONE PACKAGE DELIVERY MARKET, BY SOLUTION, 2020–2023 (USD MILLION)
                        TABLE 137 REST OF MIDDLE EAST: DRONE PACKAGE DELIVERY MARKET, BY SOLUTION, 2024–2030 (USD MILLION)
                        TABLE 138 REST OF MIDDLE EAST: DRONE PACKAGE DELIVERY MARKET, BY PACKAGE SIZE, 2020–2023 (USD MILLION)
                        TABLE 139 REST OF MIDDLE EAST: DRONE PACKAGE DELIVERY MARKET, BY PACKAGE SIZE, 2024–2030 (USD MILLION)
     14.7 LATIN AMERICA 
             14.7.1 PESTLE ANALYSIS
             14.7.2 RECESSION IMPACT ANALYSIS
                        FIGURE 62 LATIN AMERICA: DRONE PACKAGE DELIVERY MARKET SNAPSHOT
                        TABLE 140 LATIN AMERICA: DRONE PACKAGE DELIVERY MARKET, BY COUNTRY, 2020–2023 (USD MILLION)
                        TABLE 141 LATIN AMERICA: DRONE PACKAGE DELIVERY MARKET, BY COUNTRY, 2024–2030 (USD MILLION)
                        TABLE 142 LATIN AMERICA: DRONE PACKAGE DELIVERY MARKET, BY SOLUTION, 2020–2023 (USD MILLION)
                        TABLE 143 LATIN AMERICA: DRONE PACKAGE DELIVERY MARKET, BY SOLUTION, 2024–2030 (USD MILLION)
                        TABLE 144 LATIN AMERICA: DRONE PACKAGE DELIVERY MARKET, BY PACKAGE SIZE, 2020–2023 (USD MILLION)
                        TABLE 145 LATIN AMERICA: DRONE PACKAGE DELIVERY MARKET, BY PACKAGE SIZE, 2024–2030 (USD MILLION)
             14.7.3 BRAZIL
                        14.7.3.1 Rising consumer acceptance for drone deliveries to drive market
                                     TABLE 146 BRAZIL: DRONE PACKAGE DELIVERY MARKET, BY SOLUTION, 2020–2023 (USD MILLION)
                                     TABLE 147 BRAZIL: DRONE PACKAGE DELIVERY MARKET, BY SOLUTION, 2024–2030 (USD MILLION)
                                     TABLE 148 BRAZIL: DRONE PACKAGE DELIVERY MARKET, BY PACKAGE SIZE, 2020–2023 (USD MILLION)
                                     TABLE 149 BRAZIL: DRONE PACKAGE DELIVERY MARKET, BY PACKAGE SIZE, 2024–2030 (USD MILLION)
             14.7.4 MEXICO
                        14.7.4.1 Growing demand for fast delivery services in congested urban areas to drive market
                                     TABLE 150 MEXICO: DRONE PACKAGE DELIVERY MARKET, BY SOLUTION, 2020–2023 (USD MILLION)
                                     TABLE 151 MEXICO: DRONE PACKAGE DELIVERY MARKET, BY SOLUTION, 2024–2030 (USD MILLION)
                                     TABLE 152 MEXICO: DRONE PACKAGE DELIVERY MARKET, BY PACKAGE SIZE, 2020–2023 (USD MILLION)
                                     TABLE 153 MEXICO: DRONE PACKAGE DELIVERY MARKET, BY PACKAGE SIZE, 2024–2030 (USD MILLION)
             14.7.5 PERU
                        14.7.5.1 Increasing use of drones to deliver essential commodities in remote areas to drive market
                                     TABLE 154 PERU: DRONE PACKAGE DELIVERY MARKET, BY SOLUTION, 2020–2023 (USD MILLION)
                                     TABLE 155 PERU: DRONE PACKAGE DELIVERY MARKET, BY SOLUTION, 2024–2030 (USD MILLION)
                                     TABLE 156 PERU: DRONE PACKAGE DELIVERY MARKET, BY PACKAGE SIZE, 2020–2023 (USD MILLION)
                                     TABLE 157 PERU: DRONE PACKAGE DELIVERY MARKET, BY PACKAGE SIZE, 2024–2030 (USD MILLION)
             14.7.6 REST OF LATIN AMERICA
                        TABLE 158 REST OF LATIN AMERICA: DRONE PACKAGE DELIVERY MARKET, BY SOLUTION, 2020–2023 (USD MILLION)
                        TABLE 159 REST OF LATIN AMERICA: DRONE PACKAGE DELIVERY MARKET, BY SOLUTION, 2024–2030 (USD MILLION)
                        TABLE 160 REST OF LATIN AMERICA: DRONE PACKAGE DELIVERY MARKET, BY PACKAGE SIZE, 2020–2023 (USD MILLION)
                        TABLE 161 REST OF LATIN AMERICA: DRONE PACKAGE DELIVERY MARKET, BY PACKAGE SIZE, 2024–2030 (USD MILLION)
     14.8 AFRICA 
             14.8.1 PESTLE ANALYSIS
             14.8.2 RECESSION IMPACT ANALYSIS
                        FIGURE 63 AFRICA: DRONE PACKAGE DELIVERY MARKET SNAPSHOT
                        TABLE 162 AFRICA: DRONE PACKAGE DELIVERY MARKET, 2020–2023 (USD MILLION)
                        TABLE 163 AFRICA: DRONE PACKAGE DELIVERY MARKET, 2024–2030 (USD MILLION)
                        TABLE 164 AFRICA: DRONE PACKAGE DELIVERY MARKET, BY SOLUTION, 2020–2023 (USD MILLION)
                        TABLE 165 AFRICA: DRONE PACKAGE DELIVERY MARKET, BY SOLUTION, 2024–2030 (USD MILLION)
                        TABLE 166 AFRICA: DRONE PACKAGE DELIVERY MARKET, BY PACKAGE SIZE, 2020–2023 (USD MILLION)
                        TABLE 167 AFRICA: DRONE PACKAGE DELIVERY MARKET, BY PACKAGE SIZE, 2024–2030 (USD MILLION)
 
15 COMPETITIVE LANDSCAPE (Page No. - 206)
     15.1 INTRODUCTION 
     15.2 KEY PLAYER STRATEGIES/RIGHT TO WIN, 2020–2024 
             TABLE 168 KEY PLAYER STRATEGIES/RIGHT TO WIN, 2020–2024
     15.3 MARKET RANKING ANALYSIS, 2023 
             FIGURE 64 MARKET RANKING OF TOP FIVE PLAYERS, 2023
     15.4 REVENUE ANALYSIS, 2020–2023 
             FIGURE 65 REVENUE ANALYSIS OF TOP FIVE PLAYERS, 2020–2023
     15.5 MARKET SHARE ANALYSIS, 2023 
             FIGURE 66 MARKET SHARE ANALYSIS OF KEY PLAYERS, 2023
             TABLE 169 DRONE PACKAGE DELIVERY MARKET: DEGREE OF COMPETITION
     15.6 COMPANY EVALUATION MATRIX: KEY PLAYERS, 2023 
             15.6.1 STARS
             15.6.2 EMERGING LEADERS
             15.6.3 PERVASIVE PLAYERS
             15.6.4 PARTICIPANTS
                        FIGURE 67 COMPANY EVALUATION MATRIX (KEY PLAYERS), 2023
             15.6.5 COMPANY FOOTPRINT
                        FIGURE 68 COMPANY FOOTPRINT
                        TABLE 170 SOLUTION FOOTPRINT
                        TABLE 171 RANGE FOOTPRINT
                        TABLE 172 PACKAGE SIZE FOOTPRINT
                        TABLE 173 REGION FOOTPRINT
     15.7 COMPANY EVALUATION MATRIX: START-UPS/SMES, 2023 
             15.7.1 PROGRESSIVE COMPANIES
             15.7.2 RESPONSIVE COMPANIES
             15.7.3 DYNAMIC COMPANIES
             15.7.4 STARTING BLOCKS
                        FIGURE 69 COMPANY EVALUATION MATRIX (START-UPS/SMES), 2023
             15.7.5 COMPETITIVE BENCHMARKING
                        TABLE 174 LIST OF START-UPS/SMES
                        TABLE 175 COMPETITIVE BENCHMARKING OF START-UPS/SMES
     15.8 COMPANY VALUATION AND FINANCIAL METRICS, 2023 
             TABLE 176 COMPANY VALUATION AND FINANCIAL METRICS, 2023
             FIGURE 70 VALUATION OF KEY PLAYERS, 2023
             FIGURE 71 FINANCIAL METRICS OF KEY PLAYERS, 2023
     15.9 BRAND/PRODUCT COMPARISON 
             FIGURE 72 BRAND/PRODUCT COMPARISON
     15.10 COMPETITIVE SCENARIO 
             15.10.1 PRODUCT LAUNCHES
                        TABLE 177 DRONE PACKAGE DELIVERY MARKET: PRODUCT LAUNCHES, 2020–2024
             15.10.2 DEALS
                        TABLE 178 DRONE PACKAGE DELIVERY MARKET: DEALS, 2020–2024
             15.10.3 OTHERS
                        TABLE 179 DRONE PACKAGE DELIVERY MARKET: OTHERS, 2020–2024
 
16 COMPANY PROFILES (Page No. - 233)
     16.1 KEY PLAYERS 
     (Business Overview, Products/Solutions/Services offered, Recent Developments, MnM View)*  
             16.1.1 ALPHABET INC.
                        TABLE 180 ALPHABET INC.: COMPANY OVERVIEW
                        FIGURE 73 ALPHABET INC.: COMPANY SNAPSHOT
                        TABLE 181 ALPHABET INC.: PRODUCTS/SOLUTIONS/SERVICES OFFERED
                        TABLE 182 ALPHABET INC.: PRODUCT LAUNCHES
                        TABLE 183 ALPHABET INC.: DEALS
             16.1.2 ZIPLINE INTERNATIONAL INC.
                        TABLE 184 ZIPLINE INTERNATIONAL INC.: COMPANY OVERVIEW
                        TABLE 185 ZIPLINE INTERNATIONAL INC.: PRODUCTS/SOLUTIONS/SERVICES OFFERED
                        TABLE 186 ZIPLINE INTERNATIONAL INC.: PRODUCT LAUNCHES
                        TABLE 187 ZIPLINE INTERNATIONAL INC.: DEALS
             16.1.3 UNITED PARCEL SERVICE OF AMERICA, INC.
                        TABLE 188 UNITED PARCEL SERVICE OF AMERICA, INC.: COMPANY OVERVIEW
                        FIGURE 74 UNITED PARCEL SERVICE OF AMERICA, INC.: COMPANY SNAPSHOT
                        TABLE 189 UNITED PARCEL SERVICE OF AMERICA, INC.: PRODUCTS/SOLUTIONS/SERVICES OFFERED
                        TABLE 190 UNITED PARCEL SERVICE OF AMERICA, INC.: DEALS
             16.1.4 WINGCOPTER
                        TABLE 191 WINGCOPTER: COMPANY OVERVIEW
                        TABLE 192 WINGCOPTER: PRODUCTS/SOLUTIONS/SERVICES OFFERED
                        TABLE 193 WINGCOPTER: PRODUCT LAUNCHES
                        TABLE 194 WINGCOPTER: DEALS
             16.1.5 MATTERNET, INC.
                        TABLE 195 MATTERNET, INC.: COMPANY OVERVIEW
                        TABLE 196 MATTERNET, INC.: PRODUCTS/SOLUTIONS/SERVICES OFFERED
                        TABLE 197 MATTERNET, INC.: PRODUCT LAUNCHES
                        TABLE 198 MATTERNET, INC.: DEALS
             16.1.6 FEDEX
                        TABLE 199 FEDEX: COMPANY OVERVIEW
                        FIGURE 75 FEDEX: COMPANY SNAPSHOT
                        TABLE 200 FEDEX: PRODUCTS/SOLUTIONS/SERVICES OFFERED
                        TABLE 201 FEDEX: OTHERS
             16.1.7 AIRBUS
                        TABLE 202 AIRBUS: COMPANY OVERVIEW
                        FIGURE 76 AIRBUS: COMPANY SNAPSHOT
                        TABLE 203 AIRBUS: PRODUCTS/SOLUTIONS/SERVICES OFFERED
             16.1.8 EHANG
                        TABLE 204 EHANG: COMPANY OVERVIEW
                        FIGURE 77 EHANG: COMPANY SNAPSHOT
                        TABLE 205 EHANG: PRODUCTS/SOLUTIONS/SERVICES OFFERED
                        TABLE 206 EHANG: PRODUCT LAUNCHES
                        TABLE 207 EHANG: DEALS
                        TABLE 208 EHANG: OTHERS
             16.1.9 AMAZON.COM, INC.
                        TABLE 209 AMAZON.COM, INC.: COMPANY OVERVIEW
                        FIGURE 78 AMAZON.COM, INC.: COMPANY SNAPSHOT
                        TABLE 210 AMAZON.COM, INC.: PRODUCTS/SOLUTIONS/SERVICES OFFERED
                        TABLE 211 AMAZON.COM, INC.: PRODUCT LAUNCHES
                        TABLE 212 AMAZON.COM, INC.: OTHERS
             16.1.10 DRONE DELIVERY CANADA CORP.
                        TABLE 213 DRONE DELIVERY CANADA CORP.: COMPANY OVERVIEW
                        FIGURE 79 DRONE DELIVERY CANADA CORP.: COMPANY SNAPSHOT
                        TABLE 214 DRONE DELIVERY CANADA CORP.: PRODUCTS/SOLUTIONS/SERVICES OFFERED
                        TABLE 215 DRONE DELIVERY CANADA CORP.: DEALS
                        TABLE 216 DRONE DELIVERY CANADA CORP.: OTHERS
             16.1.11 JD.COM
                        TABLE 217 JD.COM: COMPANY OVERVIEW
                        FIGURE 80 JD.COM: COMPANY SNAPSHOT
                        TABLE 218 JD.COM: PRODUCTS/SOLUTIONS/SERVICES OFFERED
             16.1.12 WALMART
                        TABLE 219 WALMART: COMPANY OVERVIEW
                        FIGURE 81 WALMART: COMPANY SNAPSHOT
                        TABLE 220 WALMART: PRODUCTS/SOLUTIONS/SERVICES OFFERED
             16.1.13 MANNA DRONE DELIVERY
                        TABLE 221 MANNA DRONE DELIVERY: COMPANY OVERVIEW
                        TABLE 222 MANNA DRONE DELIVERY: PRODUCTS/SOLUTIONS/SERVICES OFFERED
                        TABLE 223 MANNA DRONE DELIVERY: DEALS
                        TABLE 224 MANNA DRONE DELIVERY: OTHERS
             16.1.14 DJI
                        TABLE 225 DJI: COMPANY OVERVIEW
                        TABLE 226 DJI: PRODUCTS/SOLUTIONS/SERVICES OFFERED
                        TABLE 227 DJI: PRODUCT LAUNCHES
             16.1.15 FLYTREX
                        TABLE 228 FLYTREX: COMPANY OVERVIEW
                        TABLE 229 FLYTREX: PRODUCTS/SOLUTIONS/SERVICES OFFERED
     16.2 OTHER PLAYERS 
             16.2.1 SKYCART INC.
                        TABLE 230 SKYCART INC.: COMPANY OVERVIEW
             16.2.2 ALTITUDE ANGEL
                        TABLE 231 ALTITUDE ANGEL: COMPANY OVERVIEW
             16.2.3 SPEEDBIRD AERO
                        TABLE 232 SPEEDBIRD AERO: COMPANY OVERVIEW
             16.2.4 SKYPORTS DRONE SERVICES
                        TABLE 233 SKYPORTS DRONE SERVICES: COMPANY OVERVIEW
             16.2.5 PABLO AIR CO, LTD.
                        TABLE 234 PABLO AIR CO, LTD.: COMPANY OVERVIEW
             16.2.6 DRONEUP LLC.
                        TABLE 235 DRONEUP LLC.: COMPANY OVERVIEW
             16.2.7 WORKHORSE GROUP INC.
                        TABLE 236 WORKHORSE GROUP INC.: COMPANY OVERVIEW
             16.2.8 ELROY AIR
                        TABLE 237 ELROY AIR: COMPANY OVERVIEW
             16.2.9 RIGI TECHNOLOGIES S.A.
                        TABLE 238 RIGI TECHNOLOGIES S.A.: COMPANY OVERVIEW
             16.2.10 SWOOP AERO
                        TABLE 239 SWOOP AERO: COMPANY OVERVIEW
*Details on Business Overview, Products/Solutions/Services offered, Recent Developments, MnM View might not be captured in case of unlisted companies.  
     16.3 ANNEXURE 
             TABLE 240 OTHER MAPPED COMPANIES
 
17 APPENDIX (Page No. - 286)
     17.1 DISCUSSION GUIDE 
     17.2 KNOWLEDGESTORE: MARKETSANDMARKETS’ SUBSCRIPTION PORTAL 
     17.3 CUSTOMIZATION OPTIONS 
     17.4 RELATED REPORTS 
     17.5 AUTHOR DETAILS 


This research study on the drone package delivery market involved extensive use of secondary sources, directories, and databases such as Hoovers, Bloomberg BusinessWeek, and Factiva to identify and collect information relevant to the market. The primary sources considered included industry experts as well as service providers, manufacturers, solution providers, technology developers, alliances, and organizations related to all segments of the value chain of this market. In-depth interviews with various primary respondents, including key industry participants, subject matter experts (SMEs), industry consultants, and C-level executives, were conducted to obtain and verify critical qualitative and quantitative information pertaining to the drone package delivery market as well as assess its growth prospects.

Secondary Research

The secondary sources referred for this research study on the drone package delivery market included financial statements of companies offering delivery drones and drone package delivery services, infrastructure, and software providers, along with various trade, business, and professional associations, among others. The secondary data was collected and analyzed to arrive at the overall size of the drone package delivery market, which was validated by primary respondents.

Primary Research

Extensive primary research was conducted after acquiring information regarding the Drone Package Delivery market scenario through secondary research. Several primary interviews were conducted with market experts from both the demand and supply sides across major countries of North America, Europe, Asia Pacific, the Middle East, Africa and Latin America. Primary data was collected through questionnaires, emails, and telephonic interviews.

Drone Package Delivery Market
 Size, and Share

To know about the assumptions considered for the study, download the pdf brochure

Market Size Estimation

The top-down and bottom-up approaches were used to estimate and validate the size of the drone package delivery market. The research methodology used to estimate the market size includes the following details.

The key players were identified through secondary research, and their market ranking was determined through primary and secondary research. This included a study of the annual and financial reports of the top market players and extensive interviews of leaders, including chief executive officers (CEO), directors, and marketing executives.
All percentage shares, splits, and breakdowns were determined using secondary sources and verified through primary sources. All possible parameters that affect the markets covered in this research study were accounted for, viewed in extensive detail, verified through primary research, and analyzed to obtain the final quantitative and qualitative data. This data was consolidated, enhanced with detailed inputs, analyzed by MarketsandMarkets, and presented in this report.

Drone Package Delivery Market Size: Bottom-up Approach

Drone Package Delivery Market
 Size, and Bottom-up Approach

Drone Package Delivery Market Size: Top-Down Approach

Drone Package Delivery Market
 Size, and Top-Down Approach

Data Triangulation

After arriving at the overall size of the drone package delivery market from the market size estimation process explained above, the total market was split into several segments and subsegments. To complete the overall market engineering process and arrive at the exact statistics for various market segments and subsegments, data triangulation and market breakdown procedures explained below were implemented, wherever applicable. The data was triangulated by studying various factors and trends from both the demand and supply sides. The market size was also validated using both top-down and bottom-up approaches.

Market Definition

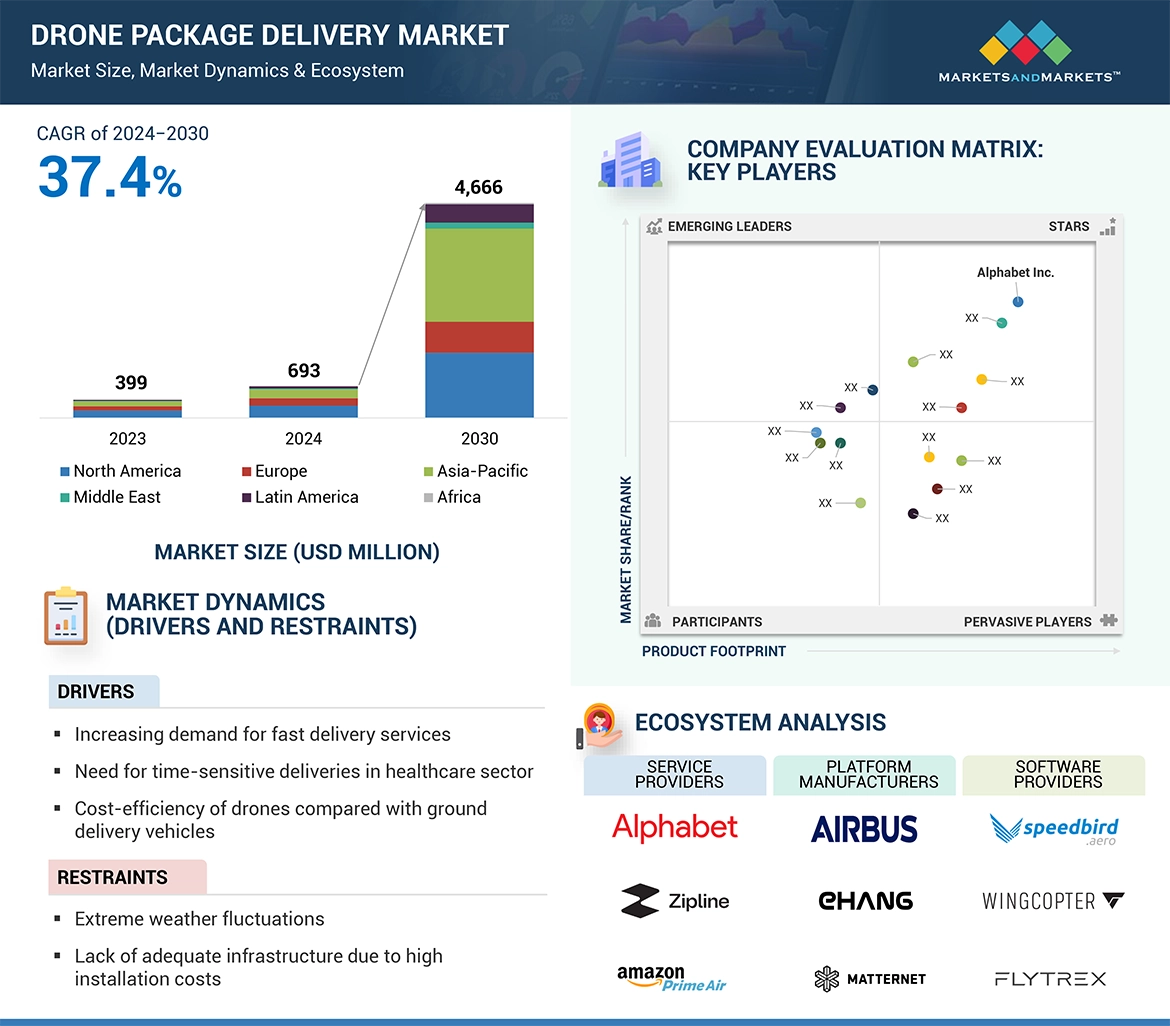
Drone package delivery refers to the delivery of packages and related services using drones. Delivery drones are fixed, multirotor, or hybrid unmanned aerial vehicles (UAVs) that operate autonomously. The drone delivery increases the efficiency, reduces delivery time and minimizes the costs associated with traditional ground-based delivery methods. The delivery of packaged with the help of drones offers advantage to reach remote or hard to access locations and for instant delivery of time-sensitive items. The drone package delivery is applicable across various sectors such as medical, agricultural, retail, and others.
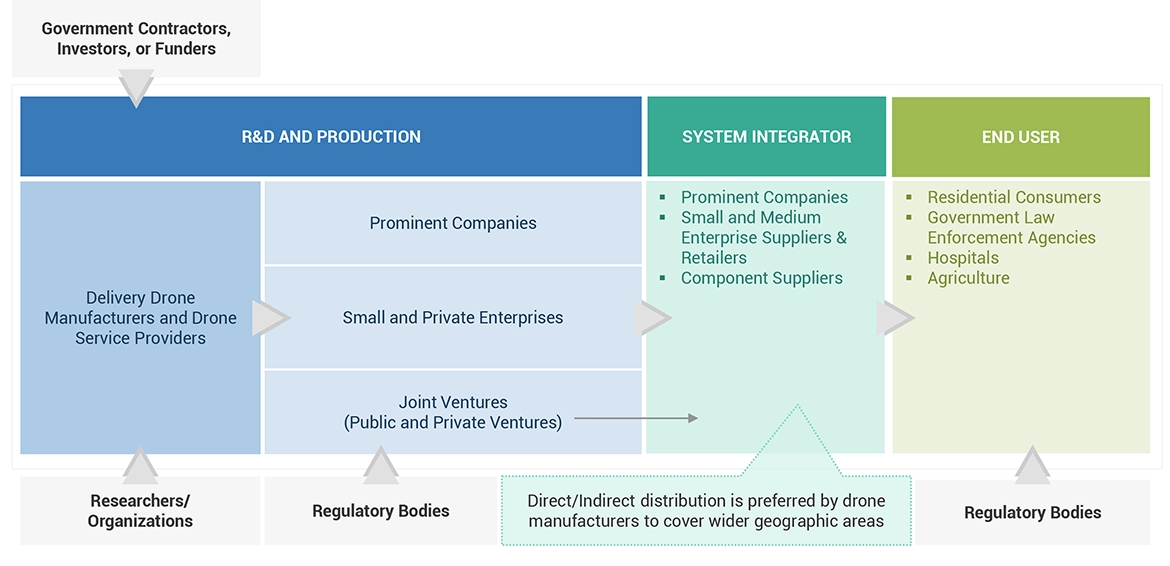
Market Stakeholders

  • Drone Manufacturers
  • Drone Package Delivery Service Providers
  • Drone Package Delivery Infrastructure Manufacturers
  • Drone Package Delivery Software Providers
  • Technology Support Providers
  • Related Research Bodies
  • Drone Operators

Report Objectives

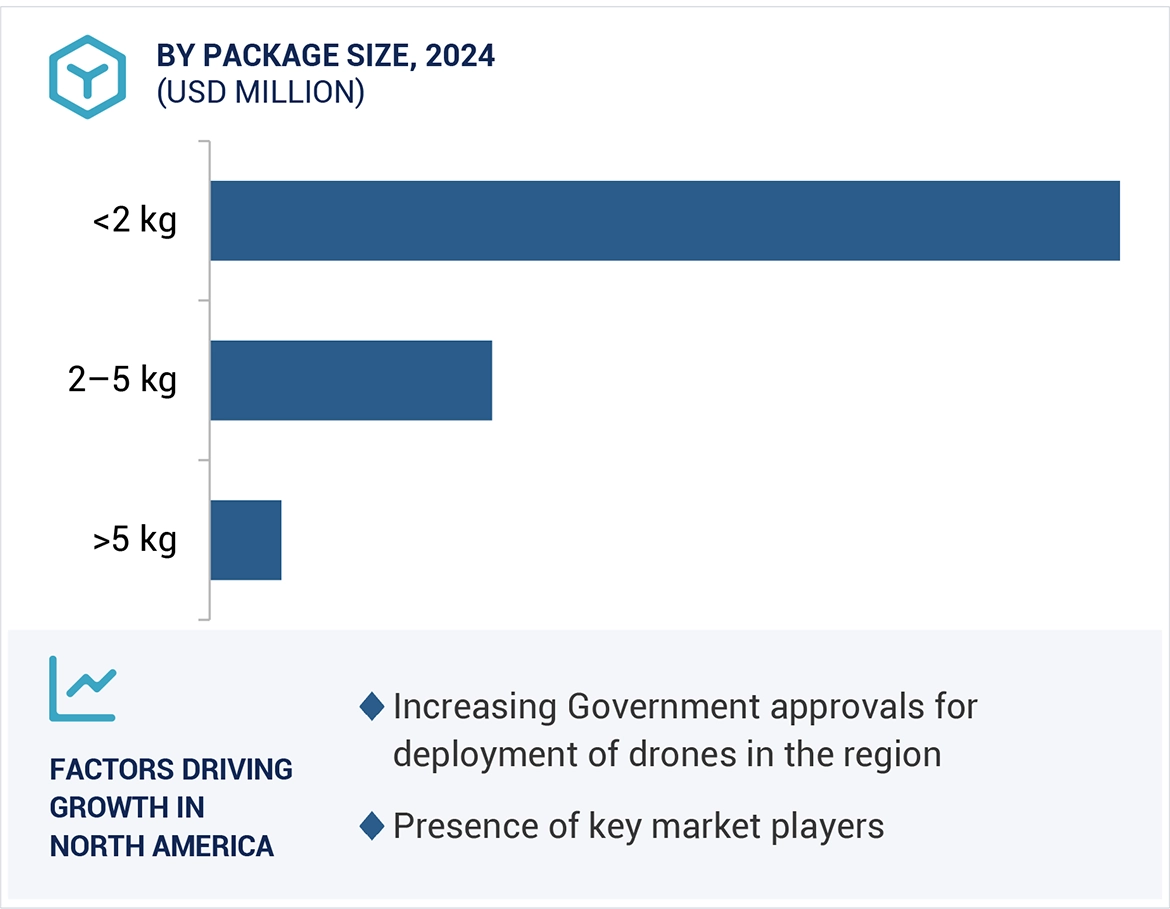
  • To define, describe, segment, and forecast the size of the drone package delivery market based on solution, duration, range, package size, type, end use, operation mode, and region
  • To forecast the size of market segments with respect to the following regions, namely North America, Europe, Asia Pacific, Middle East, and the Rest of the World, along with key countries in each region
  • To identify and analyze key drivers, restraints, opportunities, and challenges influencing the growth of the market
  • To identify technology trends currently prevailing in the drone package delivery market
  • To provide an overview of the regulatory landscape with respect to drone regulations worldwide
  • To analyze micromarkets1 with respect to individual growth trends, prospects, and their contribution to the overall market
  • To analyze opportunities in the market for stakeholders by identifying key market trends
  • To profile key market players and comprehensively analyze their market share and core competencies2
  • To analyze the degree of competition in the market by identifying key growth strategies, such as product/service launches,  partnerships, and expansions, adopted by leading market players
  • To identify detailed financial positions, key products, and unique selling points of leading companies in the market
  • To provide a detailed competitive landscape of the drone package delivery market, along with a ranking analysis, market share analysis, and revenue analysis of key players

Available Customizations:

MarketsandMarkets offers the following customizations for this market report:

  • Additional country-level analysis of the Drone Package Delivery Market
  • Profiling of other market players (up to 5)

Product Analysis

  • Product matrix, which provides a detailed comparison of the product portfolio of each company in the Drone Package Delivery Market.
Custom Market Research Services

We will customize the research for you, in case the report listed above does not meet with your exact requirements. Our custom research will comprehensively cover the business information you require to help you arrive at strategic and profitable business decisions.

Request Customization

Instant Answers with GPT - Ask Now!

Ask real questions. Get complete answers !
Report Code
AS 7465
Published ON
Jul, 2024
Choose License Type
BUY NOW
  • SHARE
X
Request Customization
Speak to Analyst
Speak to Analyst
OR FACE-TO-FACE MEETING
PERSONALIZE THIS RESEARCH
  • Triangulate with your Own Data
  • Get Data as per your Format and Definition
  • Gain a Deeper Dive on a Specific Application, Geography, Customer or Competitor
  • Any level of Personalization
REQUEST A FREE CUSTOMIZATION
LET US HELP YOU!
  • What are the Known and Unknown Adjacencies Impacting the Drone Package Delivery Market
  • What will your New Revenue Sources be?
  • Who will be your Top Customer; what will make them switch?
  • Defend your Market Share or Win Competitors
  • Get a Scorecard for Target Partners
CUSTOMIZED WORKSHOP REQUEST
  • Call Us
  • +1-888-600-6441 (Corporate office hours)
  • +1-888-600-6441 (US/Can toll free)
  • +44-800-368-9399 (UK office hours)
CONNECT WITH US
ABOUT TRUST ONLINE
©2024 MarketsandMarkets Research Private Ltd. All rights reserved
DMCA.com Protection Status Website Feedback