
E-fuels Market

E-fuels Market by Type (E-methane, E-kerosene, E-methanol, E-diesel, E-ammonia, E-gasoline), State (Gaseous, Liquid), End Use (Transportation, Chemicals, Power Generation, Grid-injection), Application (Fuel, Non-fuel) and Region - Global Forecast to 2030


OVERVIEW
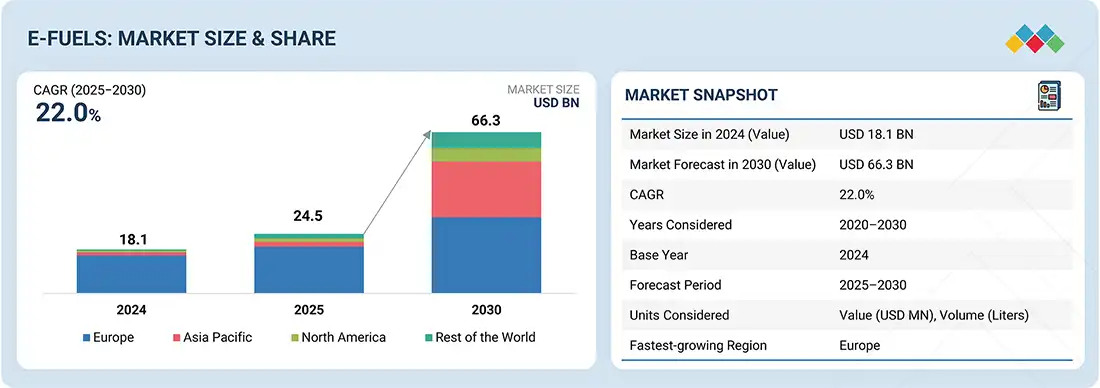
The global e-fuels market is projected to reach USD 66.3 billion by 2030 from an estimated USD 24.5 billion in 2025, at a CAGR of 22.0%, during the forecast period. The e-fuels market is driven by increasing demand for sustainable alternatives to fossil fuels in hard-to-decarbonize sectors like aviation, shipping, and heavy-duty transport.
MARKET SNAPSHOT TABLE
| REPORT METRIC | DETAILS |
|---|---|
| Market Size in 2024 (Value) | USD 18.1 Billion |
| Market Forecast in 2030 (value) | USD 66.3 Billion |
| Growth Rate | CAGR of 22.0% from 2025-2030 |
| Years Considered | 2022-2030 |
| Base Year | 2024 |
| Forecast Period | 2025-2030 |
| Units Considered | Value (USD Million), Volume (Liters) |
| Report Coverage | Revenue forecast, company ranking, competitive landscape, growth factors, and trends. |
| Segments Covered |
|
| Regions Covered | North America, Asia Pacific, Europe, Rest of the World |
E-fuels Market Size and Forecast:
- Market Size Value in 2024: USD 18.1 Billion
- Market Size Value in 2025: USD 24.5 Billion
- Revenue Forecast in 2030: USD 66.3 Billion
- Growth Rate: CAGR of 22.0% from 2025 to 2030
- Data available from 2022 to 2030
E-fuels Market Trends and Insights
- Market Growth: The E-fuels market is growing due to increasing decarbonization efforts and rising demand for sustainable fuels in aviation, marine, and transportation sectors.
-
Growing Trends: Investments in green hydrogen production and Power-to-Liquid technologies are accelerating the commercialization of E-fuels worldwide.
- Growth Opportunities: Rising need to decarbonize aviation and shipping industries and depletion of fossil fuels and push for decarbonization are creating significant E-fuels market opportunities.
- Market Share Analysis: The liquid e-fuels segment is expected to hold the largest E-fuels market share during the forecast period due to its compatibility with existing fuel infrastructure.
KEY TAKEAWAYS
-
BY STATEThe liquid segment is projected to have the highest CAGR in the e-fuels market because of its ease of storage, handling, and transportation using existing fuel infrastructure. Liquid e-fuels like e-diesel, e-gasoline, and e-kerosene provide drop-in compatibility with current internal combustion engines, making them suitable for aviation, maritime, and heavy transport sectors.
-
BY TYPEThe e-ammonia segment is expected to grow at the highest CAGR in the e-fuels market due to its high energy density, carbon-free combustion, and versatility across various applications. It is gaining popularity as a promising fuel for shipping and power generation, providing a zero-carbon alternative to traditional marine fuels.
-
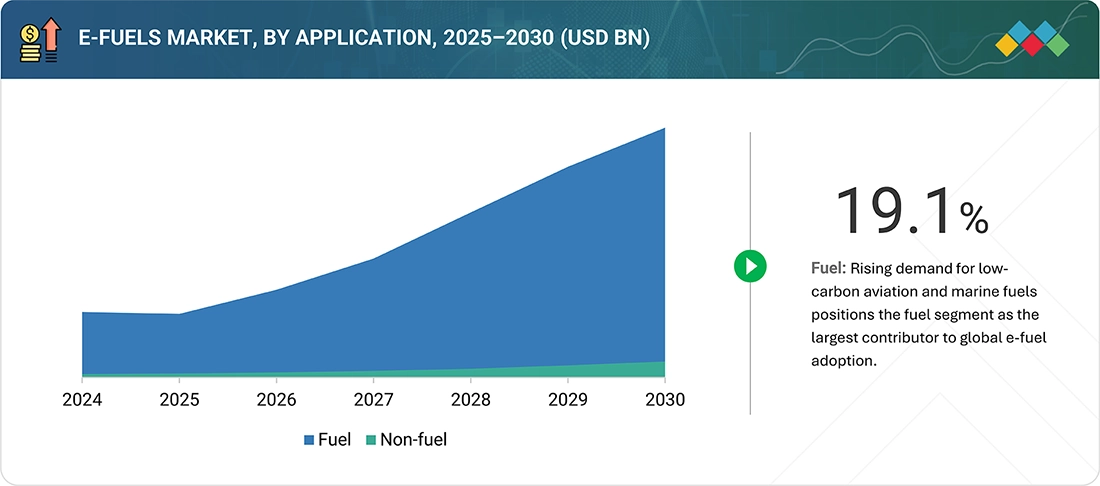
BY APPLICATIONThe fuel segment is expected to be the largest market in the e-fuels industry during the forecast period, driven by the urgent need to reduce carbon emissions in sectors where direct electrification is difficult. Aviation, maritime, and heavy-duty road transport are increasingly using e-fuels as direct replacements for traditional fossil fuels because they are compatible with existing engines and infrastructure.
-
BY END USEThe power generation sector is experiencing significant growth, mainly because e-fuels improve grid stability and help with energy storage. By storing excess renewable energy—such as solar or wind—e-fuels serve as an energy reserve that can be used during peak demand times or when renewable output is low.
-
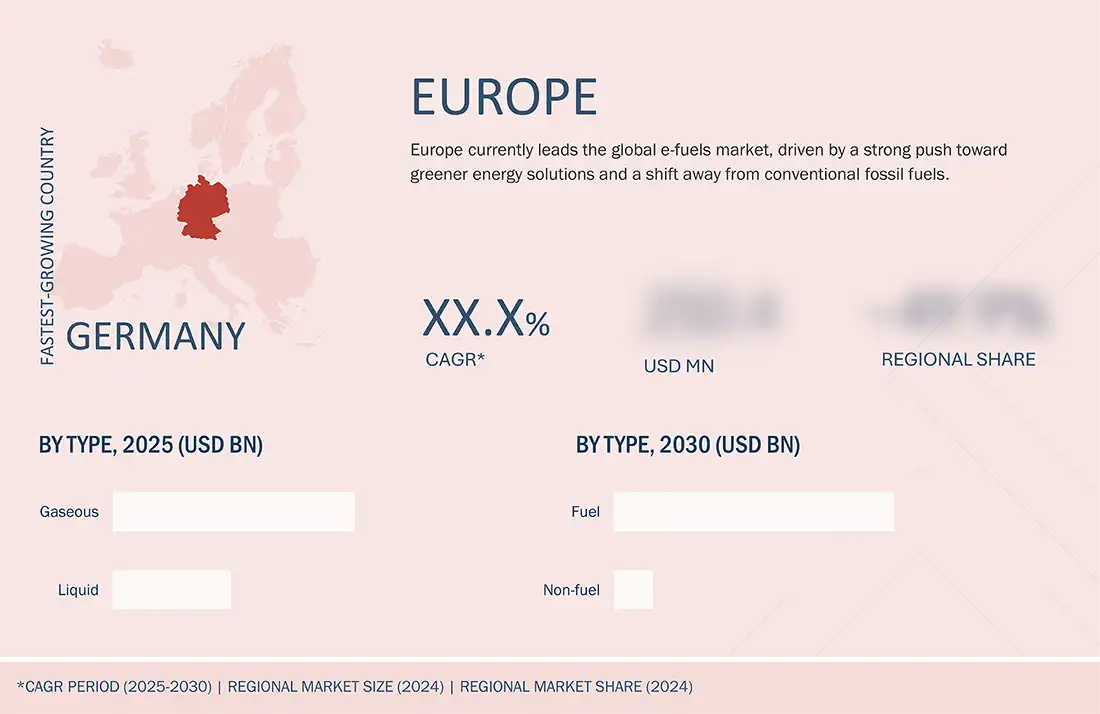
BY REGIONEurope leads the e-fuels market due to its proactive climate policies and strategic efforts toward energy independence. The region is quickly advancing in green hydrogen production and expanding sustainable fuels across aviation, shipping, and industrial sectors. Public-private partnerships and government-backed incentives are encouraging innovation and increasing production capacity.
-
COMPETITIVE LANDSCAPEMajor market players have adopted both organic and inorganic strategies, including partnerships and investments. For example, Saudi Arabian Oil Co. (Saudi Arabia), Uniper SE (Germany), and Orsted A/S (Denmark) have entered into numerous agreements and partnerships to meet the increasing demand for E-fuels.
The e-fuels market is increasingly driven by the rising demand for sustainable, drop-in fuel options that improve energy security and decrease reliance on fossil fuels. As concerns about climate change, geopolitical energy risks, and grid vulnerabilities grow, e-fuels are emerging as an important solution to decarbonize hard-to-electrify sectors such as aviation, maritime, and heavy-duty transportation. The move toward decentralized fuel production—using renewable energy and localized electrolysis facilities—also supports broader goals of energy independence and system resilience.
Source: Secondary Research, Interviews with Experts, MarketsandMarkets Analysis
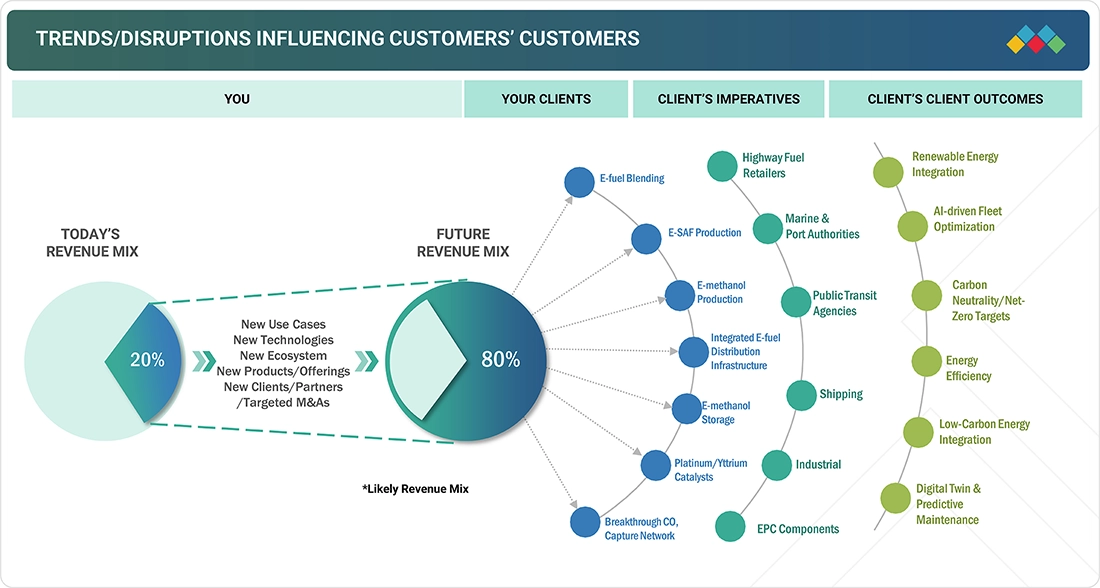
TRENDS & DISRUPTIONS IMPACTING CUSTOMERS' CUSTOMERS
The E-fuels market is experiencing transformative trends with emerging technologies boosting revenue growth. Moving from traditional to new technologies, the future revenue mix includes e-SAF production, e-methanol, and hydrogen integration, focusing on renewable energy and low-carbon solutions. Major players like highway fuel retailers and the shipping industry are adopting e-fuels, supported by industrial storage and EPC components, aiming for net-zero targets and energy efficiency despite disruptions in production and infrastructure.
Source: Secondary Research, Interviews with Experts, MarketsandMarkets Analysis
MARKET DYNAMICS
Level
-
Rising implementation of supportive frameworks for low-carbon fuel adoption

-
Growing emphasis on sustainable transport to conform to strict emission standards

Level
-
High initial capital investment

-
Mounting adoption of electric vehicles (EVs)

Level
-
Depletion of fossil fuels and push for decarbonization

-
Rising need to decarbonize aviation and shipping industries

Level
-
Requirement for significant energy for e-fuel production

-
Limited production capacity

Source: Secondary Research, Interviews with Experts, MarketsandMarkets Analysis
Driver: Rising implementation of supportive frameworks for low-carbon fuel adoption
Governments around the world are creating supportive frameworks to speed up the adoption of e-fuels—carbon-neutral alternatives intended for sectors that are hard to decarbonize, such as aviation, shipping, and heavy-duty transportation. Policies like R&D grants, renewable energy incentives, and tax credits play a key role in establishing the groundwork for scaling up e-fuels. These measures lower production costs, help standardize technology platforms, and certify low-carbon credentials essential for future deployment.
Restraint: High initial capital investment
One of the biggest challenges to the widespread use of e-fuels is the high initial investment needed for production facilities. Building an e-fuels plant involves large costs for electrolyzers used in green hydrogen production, CO2 capture systems, synthesis reactors, and advanced storage and distribution systems. These systems are technically complex and often require custom-designed, high-pressure, high-temperature parts, which increase engineering and manufacturing expenses. The cost of electrolyzers alone is high, and although prices are expected to fall over time, current projects demand significant upfront funding. Moreover, low equipment use—due to variable availability of renewable electricity—can greatly increase the cost per unit of fuel, making early projects financially difficult.
Opportunity: Depletion of fossil fuels and push for decarbonization
The rising depletion of fossil fuel reserves and the increasing push for decarbonization create a crucial opportunity for the e-fuels market. Global energy markets face long-term supply challenges as conventional oil and gas fields naturally decrease and there is underinvestment in new exploration. According to the International Energy Agency, ongoing investment in existing fields is necessary to sustain current production levels—otherwise, energy security might be at risk. Simultaneously, structural changes in the global economy and the rapid integration of clean energy technologies are transforming future energy demand. For the first time, projections indicate peaks in worldwide demand for coal, oil, and natural gas within this decade, even under current policy frameworks.
Challenge: Requirement for significant energy for e-fuel production
One of the main technical and economic challenges facing the e-fuels market is the large amount of energy needed for production. The process involves using electrolysis to split water and produce green hydrogen, then a synthesis step that combines hydrogen with captured carbon dioxide to make synthetic fuels. These steps require a lot of energy and depend on a steady, large-scale supply of cheap renewable electricity to be feasible and sustainable. Right now, the efficiency of turning renewable electricity into e-fuels is still quite low compared to direct electrification options. For instance, much of the input energy is lost at each stage, from electricity to hydrogen, and then from hydrogen to liquid fuel. As a result, making one unit of e-fuel typically needs several units of renewable electricity, increasing both production costs and the demand on the energy system.
E-fuels Market: COMMERCIAL USE CASES ACROSS INDUSTRIES
| COMPANY | USE CASE DESCRIPTION | BENEFITS |
|---|---|---|
 |
Bioagra, Poland’s leading bioethanol producer, aimed to expand into e-fuels to support the energy shift and meet rising demand for sustainable fuels like e-methanol and Sustainable Aviation Fuel (SAF). However, uncertainty lingered over the best technology route, plant design, power strategy, and cost structure to ensure commercial success and the lowest levelized cost of production (LCOx) from biogenic CO2 and green hydrogen. | When demand is high, stored e-fuels such as e-methanol and SAF are released to meet the energy needs of the aviation and transportation sectors. This system is designed to supply Bioagra's fuel requirements for an entire year by storing and releasing e-fuels as needed. Engineers studied integrating biogenic CO2 and green hydrogen with optimized technology pathways and plant designs to capture excess renewable energy during peak production periods. The stored e-fuels were then used to achieve the lowest LCOx, improve round-trip efficiencies of 50-60%, and enhance the commercial viability of sustainable fuel production. |
 |
The transport sector’s dependence on fossil fuels still significantly contributes to global carbon emissions. Decarbonizing fuel-heavy applications like passenger vehicles requires sustainable options that work with existing infrastructure. However, large-scale production of carbon-neutral liquid fuels remains limited due to difficulties in combining renewable electricity, hydrogen production, and CO2 utilization technologies. | When demand is high, the stored carbon-neutral liquid fuels are released to meet the energy needs of passenger vehicles. This system is designed to supply EcoFuel Innovations' fuel requirements for a full year by storing and releasing e-fuels as necessary. Engineers examined the integration of renewable electricity, hydrogen production, and CO2 utilization to capture excess energy during periods of high renewable output. The stored e-fuels are then used to support existing fuel infrastructure, achieving round-trip efficiencies of 45-55%, which helps promote the adoption of sustainable transportation solutions. |
Logos and trademarks shown above are the property of their respective owners. Their use here is for informational and illustrative purposes only.
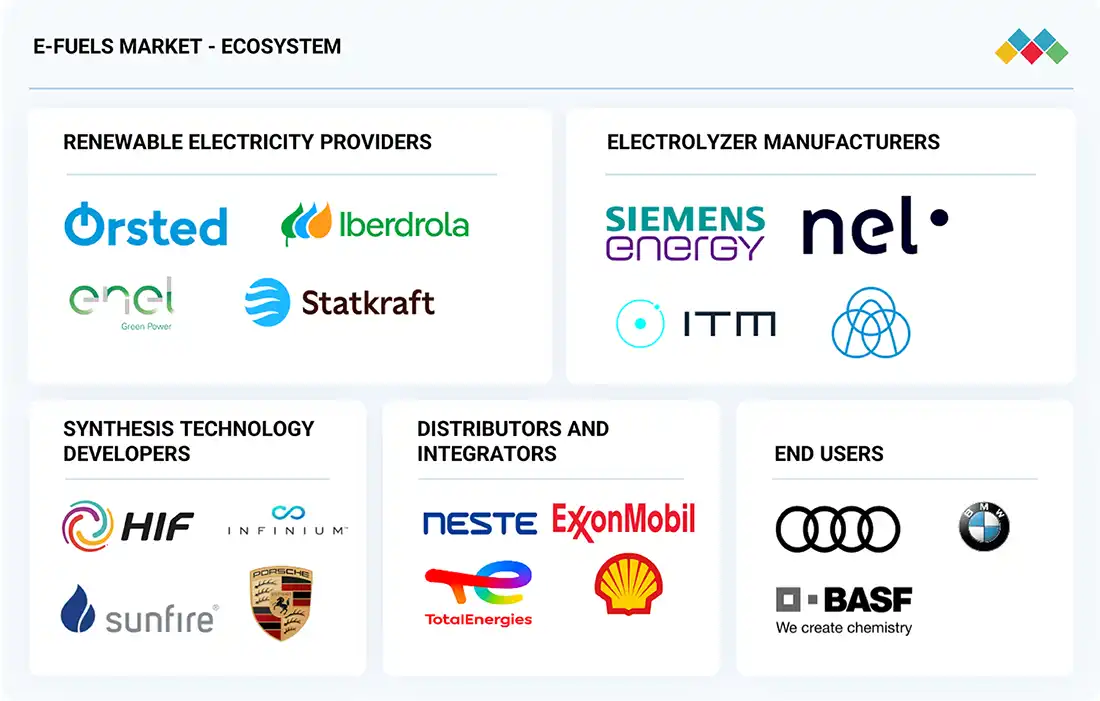
MARKET ECOSYSTEM
The e-fuels market supply chain is a complex yet synergistic ecosystem that enables the production and use of synthetic fuels made from renewable electricity and captured carbon dioxide. It starts with renewable electricity providers like Ørsted AS (Denmark) and Enel Green Power (Italy), who supply green energy for electrolysis. Electrolyzer manufacturers such as Siemens Energy (Germany) and Nel (Norway) provide the technology to split water into green hydrogen, a key feedstock. Synthesis technology developers like HIF GLOBAL (US) and Sunfire SE (Germany) combine hydrogen and CO2 to produce e-methanol, e-diesel, e-kerosene, and more. Distributors and integrators, including Mabanaft (Germany) and Air Liquide (France), handle logistics, blending, and delivery to end users. End users range from shipping giants like Maersk (Denmark) to airlines such as Lufthansa (Germany) and automotive companies like Porsche (Germany), all aiming to decarbonize transportation.
Logos and trademarks shown above are the property of their respective owners. Their use here is for informational and illustrative purposes only.
MARKET SEGMENTS
Source: Secondary Research, Interviews with Experts, MarketsandMarkets Analysis
E-fuels Market, By Type
The E-methane type accounted for the largest market revenue share in 2024. E-methane's dominance in the 2024 e-fuels market comes from its efficient, cost-effective production using renewable hydrogen and captured CO2, allowing easy integration into existing natural gas infrastructure for sectors like industrial heating, power generation, and heavy transport. This compatibility, along with global decarbonization mandates and carbon-neutral benefits, promotes widespread adoption and the highest market share.
E-fuels Market, By State
Gaseous e-fuels are motivated by increasing demand for renewable energy integration and grid balancing. They can be injected into existing natural gas pipelines, which reduces infrastructure costs and allows for quicker adoption. Supportive policies in Europe and Asia to decarbonize gas networks, along with their compatibility with current storage and distribution systems, further enhance growth potential.
E-fuels Market, By Application
The fuel segment is expected to be the largest market within the e-fuels industry during the forecast period, fueled by the urgent need to decarbonize sectors where direct electrification is difficult. Aviation, maritime, and heavy-duty road transport are increasingly adopting e-fuels as drop-in replacements for traditional fossil fuels due to their compatibility with existing engines and infrastructure.
E-fuels Market, By End Use
The power generation sector is experiencing significant growth, mainly because e-fuels can improve grid stability and aid energy storage. By capturing excess renewable energy—such as solar or wind—e-fuels serve as an energy reservoir that can be used during times of high demand or when renewable output is low. This flexibility decreases dependence on traditional backup power sources and helps balance supply and demand variations in the power grid.
REGION
Europe to be the largest-growing region in global e-fuels market during forecast period
Europe leads the e-fuels market, driven by its strong regulatory framework, ambitious climate targets, and early adoption of decarbonization technologies. Additionally, the region's focus on energy security and reducing dependence on fossil fuel imports is boosting support for synthetic alternatives. Robust public-private partnerships, growing deployment of green hydrogen projects, and incentives for sustainable aviation and maritime fuels further propel market growth. Europe's advanced renewable energy capacity and commitment to circular carbon practices also position it as a key hub for scaling e-fuel innovation, production, and export capabilities across diverse end-use sectors.
E-fuels Market: COMPANY EVALUATION MATRIX
Saudi Arabian Oil Co. (Star) leads with extensive investments in synthetic fuel production, utilizing its global infrastructure and partnerships to expand e-fuels for transportation and industrial applications. Its diverse portfolio and focus on decarbonization position it as a dominant player driving market growth. Uniper SE (Emerging Leader) is advancing e-fuels through innovative pilot projects and collaborations in Europe, especially targeting renewable integration and green hydrogen-based synthesis, steadily strengthening its role in the market.

Source: Secondary Research, Interviews with Experts, MarketsandMarkets Analysis
KEY MARKET PLAYERS
WHAT IS IN IT FOR YOU: E-fuels Market REPORT CONTENT GUIDE
DELIVERED CUSTOMIZATIONS
We have successfully delivered the following deep-dive customizations:
| CLIENT REQUEST | CUSTOMIZATION DELIVERED | VALUE ADDS |
|---|---|---|
| E-fuels Project List | List of E-fuels project from Europe Region (Northern Europe, Scandinavian, Southern Europe) |
|
| Future of E-fuels | Capability of Benchmarking for players operating in the E-fuels Market |
|
RECENT DEVELOPMENTS
- April 2025 : Repsol (Spain) and Bunge (US) formed a partnership to develop renewable fuels in Europe using intermediate crops like camelina and safflower to produce low-carbon oils for HVO and SAF. This initiative supports emission reductions of up to 90% and promotes sustainable feedstock sourcing from Spanish farmers
- September 2023 : Saudi Arabian Oil Co. (Saudi Arabia) and Stellantis (Netherlands), an automotive manufacturing corporation, collaborated to check the compatibility of e-fuels with European engine facilities. The companies have been collaborating to test surrogate e-fuels according to existing fuel standards to develop lower-carbon energy solutions. Aramco plans to utilize e-fuels in vehicles.
- February 2022 : norsk e-Fuel (Germany) partnered with Sunfire SE (Germany), they are developing a renewable fuel plant in Mosjøen, Norway, to produce green kerosene for aviation starting in 2024. Utilizing Sunfire's advanced electrolysis technologies, the plant will convert CO2, water, and renewable electricity into e-Fuels, initially producing 12.5 million liters annually, with plans to double capacity by 2026. Strategically located for access to stable green energy, the project aims to reduce CO2 emissions from Norway's major domestic flight routes by 50%, marking a significant step toward decarbonizing aviation.
- January 2021 : Perstorp (Sweden) will produce sustainable methanol at its Stenungsund site in Sweden, aiming to reduce greenhouse gas emissions by approximately 500,000 tons annually. The project, known as Project Air, intends to replace all fossil methanol used in Perstorp' s European production with sustainable methanol derived from carbon dioxide captured from its operations, biogas, and renewable hydrogen. The facility is expected to commence operations by 2025.
Table of Contents
 Exclusive indicates content/data unique to MarketsandMarkets and not available with any competitors.
Methodology
The study involved major activities in estimating the current size of the e-fuels market. Exhaustive secondary research was done to collect information on the peer and parent markets. The next step was to validate these findings, assumptions, and sizing with industry experts across the value chain through primary research. Both top-down and bottom-up approaches were employed to estimate the complete market size. Thereafter, market breakdown and data triangulation were used to estimate the market size of the segments and subsegments.
Secondary Research
The secondary sources referred to for this research study included annual reports, press releases, investor presentations of companies, white papers, certified publications, articles from recognized authors, and databases of various companies and associations. Secondary research has been mainly used to obtain key information about the industry's supply chain, market's monetary chain, total pool of key players, market classification and segmentation according to industry trends to the bottom-most level, regional markets, and key developments from both market- and technology-oriented perspectives.
Primary Research
In the primary research process, various primary sources from both the supply and demand sides have been interviewed to obtain qualitative and quantitative information for this report. Primary sources from the supply side include industry experts, such as CEOs, vice presidents, marketing directors, technology & innovation directors, and related key executives from various companies and organizations operating in the e-fuels market.
In the complete market engineering process, the top-down and bottom-up approaches and several data triangulation methods have been used to perform market estimation and market forecasts for the market segments and subsegments listed in this report. Extensive qualitative and quantitative analyses have been performed in the market engineering process to list key information/insights in the report.

To know about the assumptions considered for the study, download the pdf brochure
Market Size Estimation
Both top-down and bottom-up approaches have been used to estimate and validate the size of the global e-fuels market and its dependent submarkets. The key application areas in the market have been identified through secondary research, while their market shares in respective regions have been identified through both primary and secondary research. The data included in the study is from the annual and financial reports of the top market players and interviews with industry experts, such as CEOs, VPs, directors, sales managers, and marketing executives, for key quantitative and qualitative insights into the market. The following segments provide details about this study's overall market size estimation process.
E-fuels Market : Top-Down and Bottom-Up Approach

Data Triangulation
After arriving at the overall market size from the estimation process explained below, the total market has been split into several segments and subsegments. Where applicable, data triangulation and market breakdown procedures have been employed to complete the overall market engineering process and arrive at the exact statistics for all the segments and subsegments. The data has been triangulated by studying various factors and trends from the demand and supply sides. The market has also been validated using both top-down and bottom-up approaches.
Market Definition
E-fuels or electrofuels are renewable or low-carbon liquid or gaseous fuels. They are produced by combining renewable electricity, often sourced from wind or solar power, with carbon dioxide (CO2). This process creates synthetic hydrocarbon-based fuels such as e-diesel or e-kerosene that can replace conventional fossil fuels. E-fuels are particularly useful for aviation and heavy industries because direct electrification is difficult. However, producing e-fuels requires significant renewable energy input and faces challenges regarding costs and scalability. Despite these challenges, e-fuels can play a crucial role in achieving a sustainable and carbon-neutral energy landscape, helping to combat climate change and reduce greenhouse gas emissions.
The market size for e-fuels is the sum of revenue generated by suppliers of various types of e-fuels, such as e-diesel, e-ammonia, e-kerosene, e-gasoline, e-methane, and e-methanol. The e-fuels market for North America, Europe, Asia Pacific, and RoW has been analyzed.
Stakeholders
- E-fuel vendors
- Consulting companies in the energy & power sector
- Consulting companies related to the energy & power sector
- Energy regulators
- Government and research organizations
- Power and energy associations
- Repairs and maintenance service providers
- State and national regulatory authorities
- Research and consulting companies in the clean energy generation sector
- Organizations, forums, alliances, and associations
- Industrial authorities and associations
- State and national regulatory authorities
- Research institutes
Report Objectives
- To define, describe, segment, and forecast the size of the e-fuels market based on fuel type, state, end-use application, and region, in terms of value
- To provide information about the renewable sources used in manufacturing e-fuels
- To segment and forecast the size of the e-fuels market based on fuel type and region, in terms of volume
- To assess the market sizes for North America, Europe, Asia Pacific, and the Rest of the World region
- To offer detailed information regarding key drivers, restraints, opportunities, and challenges influencing the growth of the e-fuels market
- To provide the supply chain analysis, trends/disruptions impacting customer business, ecosystem analysis, regulatory landscape, patent analysis, case study analysis, technology analysis, key conferences & events, the impact of AI/Gen AI, macroeconomic outlook, pricing analysis, porter's five forces analysis, and regulatory analysis, the impact of 2025 US tariff on the market
- To analyze opportunities for stakeholders in the e-fuels market and draw a competitive landscape of the market
- To benchmark market players using the company evaluation matrix, which analyzes market players on broad categories of business and product strategies adopted by them
- To compare key market players for the market share, product specifications, and end-use
- To strategically profile key players and comprehensively analyze their market ranking and core competencies
- To analyze competitive developments, such as contracts, agreements, partnerships, and joint ventures, in the e-fuels market
Available Customizations
MarketsandMarkets offers customizations according to the specific needs of the companies using the given market data.
The following customization options are available for the report:
Product Analysis
- Product matrix, which gives a detailed comparison of the product portfolio of each company
Geographic Analysis as per Feasibility
- Further breakdown of the e-fuels market, by Europe, Asia Pacific, North America, and Rest of the World.
Company Information
- Detailed analysis and profiling of additional market players (up to five)
Key Questions Addressed by the Report
What was the size of the e-fuels market in 2025?
In 2025, the market size of the e-fuels market was USD 24.5 billion.
What are the major drivers for the E-fuels Market?
Major drivers for the e-fuels market include decarbonization of hard-to-electrify sectors, rising demand for sustainable fuels, supportive regulations, advancements in green hydrogen and CO2 capture technologies, and increasing investments in renewable energy-based fuel production infrastructure.
Which is the largest region for the e-fuels market during the forecast period?
Europe is projected to be the largest market for e-fuels during the forecasted period, driven by strong climate policies, advanced renewable infrastructure, significant investments in green hydrogen, and growing adoption of sustainable fuels across transport, industry, and power sectors.
By state, which segment is expected to be the largest segment during the forecast period?
The liquid segment is expected to be the largest segment during the forecast period, which can be attributed to its high energy density, ease of transport and storage, and compatibility with existing fuel infrastructure across key sectors.
Which are the key players in the e-fuels market?
Saudi Arabian Oil Co., AUDI AG, Repsol, INFINIUM, Sunfire SE, Uniper SE, and Yara are some of the key players in the e-fuels market.
Need a Tailored Report?
Customize this report to your needs
Get 10% FREE Customization
Customize This ReportPersonalize This Research
- Triangulate with your Own Data
- Get Data as per your Format and Definition
- Gain a Deeper Dive on a Specific Application, Geography, Customer or Competitor
- Any level of Personalization
Let Us Help You
- What are the Known and Unknown Adjacencies Impacting the E-fuels Market
- What will your New Revenue Sources be?
- Who will be your Top Customer; what will make them switch?
- Defend your Market Share or Win Competitors
- Get a Scorecard for Target Partners

Custom Market Research Services
We Will Customise The Research For You, In Case The Report Listed Above Does Not Meet With Your Requirements
Get 10% Free CustomisationTESTIMONIALS

Kimberly Murphy
GLOBAL MARKETING DIRECTOR
Bently Nevada,
Leading Condition Monitoring & Asset Protectionwww.bakerhughesds.com/bently-nevada

MarketsandMarkets™ showed consistent rigor for success and relentlessly worked with Bently Nevada stakeholders to positively impact go-to-market strategy. Their proactiveness and flexibility has been instrumental in achieving the objectives to grow our sales pipeline in key industrial markets.

DARRICK HUEBER
Business Development Leader
Nexus Controls LLC,
Leading Manufacturer of Automation System & Electrical Panelswww.bakerhughesds.com/nexus-controls

We partnered with MarketsandMarkets to expand our business further by tapping into new industrial segments. It was critical for us to gather crucial business insights about specific markets to achieve this goal. MarketsandMarkets engagement model and client services helped us provide those insights, it was really impressive and valuable for my business. The team was extremely flexible and helpful.

Mike Schoff
Global Industrial Commercial Strategy Leader
Nexus Controls LLC
Leading Manufacturer of Automation System & Electrical Panelswww.bakerhughesds.com/nexus-controls
We consulted MarketsandMarkets for potential Partner Identification. Overall, it was a good experience. The insights provided through interviews conducted by the team helped us put together the questionnaire required for discussion with the selected partners. Their ability to provide insights through interviews with customers in a timely manner was quite impressive.


Growth opportunities and latent adjacency in E-fuels Market