
Exoskeleton Market Size, Share and Trends

Exoskeleton Market Size, Share & Trends by Component (Sensors, Actuators, Power Systems, Controllers, Software), Functionality (Assistive, Rehabilitative, Augmentative, Preventive), Type (Powered, Passive, Hybrid), Body Part (Lower, Upper, Full Body) - Global Forecast to 2030


EXOSKELETON MARKET SIZE, SHARE & TRENDS
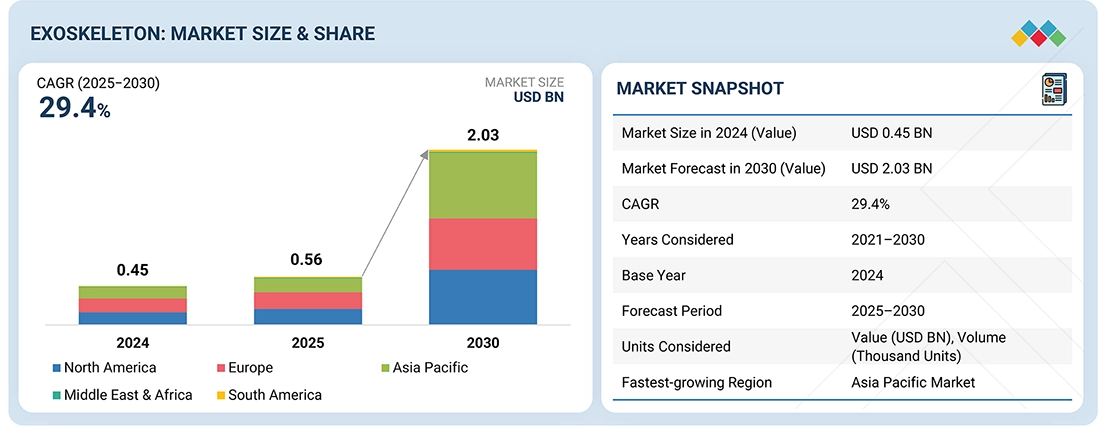
According to Marketsandmarkets, The global exoskeleton Market size was valued at USD 0.56 billion in 2025 and is projected to reach USD 2.03 billion by 2030, growing at a CAGR of 29.4%. from 2025 to 2030. It encompasses wearable robotic systems that improve human strength, endurance, and mobility across healthcare, industrial, and defense fields. Market growth is fueled by increasing demand for ergonomic and assistive technologies, along with advancements in materials, batteries, and AI-powered motion control.
MARKET SNAPSHOT TABLE
| REPORT METRIC | DETAILS |
|---|---|
| Market Size in 2025 (Value) | USD 0.56 Billion |
| Market Forecast in 2030 (Value) | USD 2.03 Billion |
| Growth Rate | CAGR of 29.4% from 2025–2030 |
| Years Considered | 2021–2030 |
| Base Year | 2024 |
| Forecast Period | 2025–2030 |
| Units Considered | Value (USD Million), Volume (Thousand Units) |
| Report Coverage | Revenue forecast, company ranking, competitive landscape, growth factors, and trends |
| Top Companies |
|
| Growth Drivers |
|
| Segments Covered |
|
| Regional Scope | North America, Europe, Asia Pacific, Middle East & Africa, and South America |
Market Size & Forecast
KEY TAKEAWAYS
- Europe dominated the exoskeleton market with a market share of 35% in 2024.
- By type, the powered exoskeletons are expected to register the highest CAGR of 32.4% during the forecast period.
- Mobile exoskeletons are widely used in rehabilitation and industrial settings to assist dynamic movements, while stationary systems are mainly employed in medical therapy and support environments that require controlled motion.
- By component, the actuator segment holds the highest share of 33% in 2024.
- By vertical, the healthcare segment leads adoption, supported by rehabilitation and mobility-assist use cases.
- Ottobock, DIH Medical, and Ekso Bionics were identified as some of the Star players in the exoskeleton market owing to their strong service portfolio, a wide market presence, and effective business strategies.
- German Bionic Systems GmbH, Japet Medical Devices, and ABLE Human Motion have distinguished themselves among startups and SMEs by securing strong footholds in specialized niche areas, underscoring their potential as progressive companies.
The exoskeleton industry is expected to grow steadily, fueled by rising demand for wearable robotics that improve physical performance and safety. These systems, created to boost human strength, mobility, and endurance, are increasingly being adopted in healthcare, industrial, defense, and construction sectors. Advances in sensors, actuators, AI-driven motion control, and lightweight materials are driving product innovation and broadening market applications.
Source: Secondary Research, Interviews with Experts, MarketsandMarkets Analysis
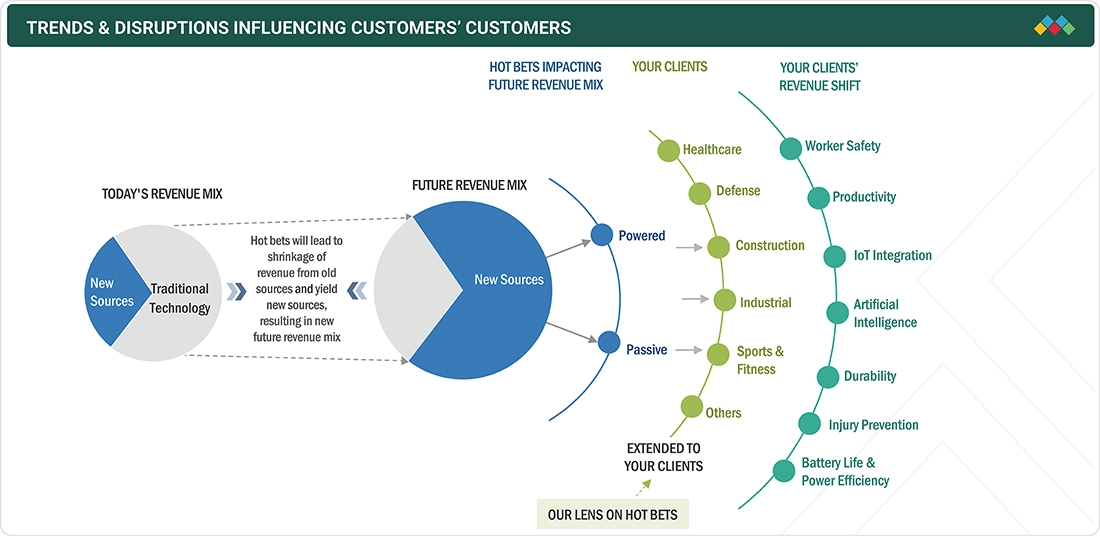
TRENDS & DISRUPTIONS IMPACTING CUSTOMERS' CUSTOMERS
The exoskeleton market trends is expanding due to rising demand for rehabilitation, workplace safety, and mobility support for aging populations. Advances in robotics, AI, and lightweight materials are boosting performance and affordability, while increased adoption across healthcare, industrial, defense, and elder care sectors is broadening market opportunities.
Source: Secondary Research, Interviews with Experts, MarketsandMarkets Analysis
EXOSKELETON MARKET DYNAMICS
Level
-
Rising demand for robotic rehabilitation solutions from healthcare sector

-
Increased adoption in industrial and manufacturing sectors

Level
-
High cost of ownership

Level
-
Integration of exoskeletons with Al and loT technologies

-
Increasing adoption of exoskeletons in military & defense sector

Level
-
Comfort and movement interference for workers

-
Power supply limitations and operational downtime

Source: Secondary Research, Interviews with Experts, MarketsandMarkets Analysis
Driver: Rising demand for robotic rehabilitation solutions from healthcare sector
The increasing incidence of spinal cord injuries worldwide and the physically demanding nature of healthcare work are driving the adoption of robotic exoskeletons. These solutions support patient rehabilitation and help reduce injury risks for medical staff.
Restraint: High cost of ownership
The high cost of exoskeletons, including expenses for training, customization, and maintenance, restricts adoption among individuals and small-to-medium businesses. Unless production becomes more affordable, this financial barrier is likely to keep limiting market growth.
Opportunity: Integration of exoskeletons with Al and loT technologies
The integration of AI and IoT in exoskeletons allows for smarter, adaptive, and data-driven devices that improve mobility, real-time performance, and predictive maintenance. This technological progress offers significant opportunities for wider adoption in medical, industrial, and sports fields.
Challenge: Comfort and movement interference for workers
Ensuring comfort and reducing movement restrictions are major challenges for occupational exoskeletons, as stiff designs can limit mobility, cause fatigue, and decrease task efficiency. These problems hinder long-term adoption and practical use across different workforces.
Exoskeleton Market: COMMERCIAL USE CASES ACROSS INDUSTRIES
| COMPANY | USE CASE DESCRIPTION | BENEFITS |
|---|---|---|
 |
Ekso Bionics launched GaitCoach in the US to enhance rehabilitation by providing real-time feedback and personalized guidance for patients using EksoNR. | Improved rehabilitation outcomes, simplified therapy processes, and enhanced patient and clinician experience |
 |
Comau introduced MATE-XB in Italy to reduce lower back fatigue and improve efficiency during lifting and repetitive industrial tasks. | Reduced worker fatigue, improved task efficiency, and enhanced comfort during repetitive motions |
 |
Hyundai Motor Group Robotics LAB developed X-ble MEX in South Korea to assist patients with lower limb rehabilitation and joint mobility. | Enhanced patient mobility, improved rehabilitation efficiency, and better support for clinical programs |
 |
Ottobock launched the Ottobock Shoulder in Germany to reduce strain and enhance comfort during overhead industrial work. | Reduced physical strain, improved worker comfort, and increased efficiency in industrial operations |
 |
Myomo Inc. announced MyoPro 2+ in the US to provide enhanced powered orthosis with better grasp functionality and improved comfort. | Improved user comfort, enhanced hand functionality, and better customization for patient needs |
Logos and trademarks shown above are the property of their respective owners. Their use here is for informational and illustrative purposes only.
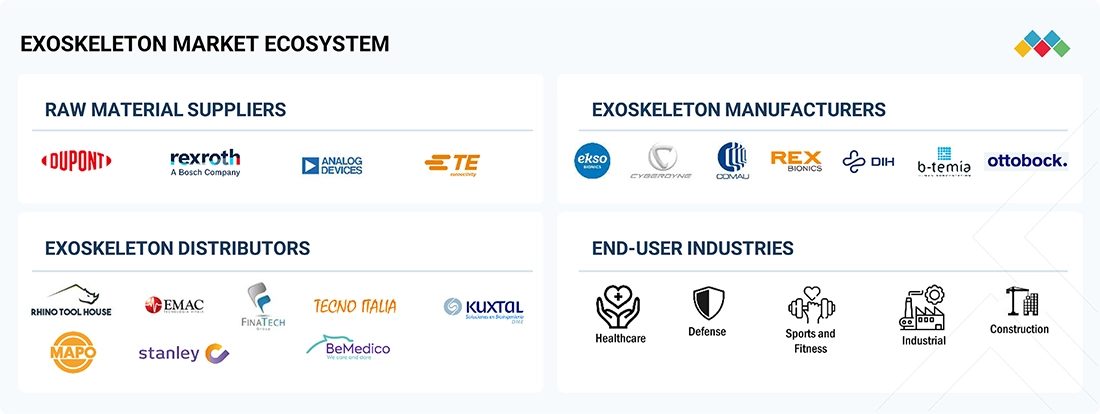
EXOSKELETON MARKET ECOSYSTEM
The exoskeleton ecosystem includes raw material suppliers, manufacturers, distributors, and end-user industries, each playing a vital role in the lifecycle of exoskeleton solutions. Raw material suppliers provide essential components, while manufacturers focus on designing and producing functional devices. Distributors make sure these solutions reach the appropriate markets efficiently. End-user industries such as healthcare, defense, industrial, construction, and others adopt and implement exoskeletons for specific applications, driving demand and fostering innovation. Together, these stakeholders form a coordinated network that supports the growth and progress of the exoskeleton market growth .
Logos and trademarks shown above are the property of their respective owners. Their use here is for informational and illustrative purposes only.
EXOSKELETON MARKET SEGMENTS
Source: Secondary Research, Interviews with Experts, MarketsandMarkets Analysis
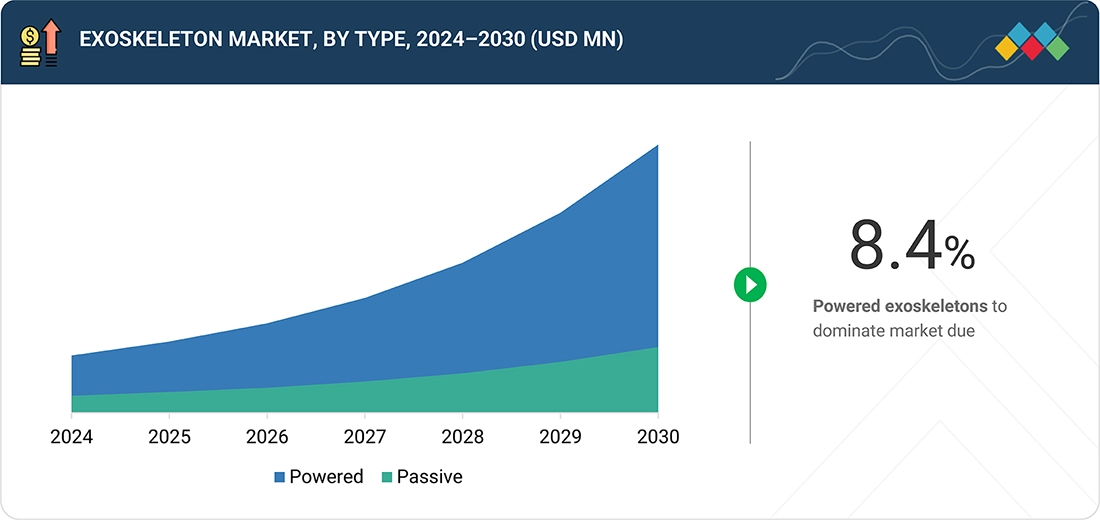
Exoskeleton Market, By Type
Powered exoskeletons lead the market due to their ability to enhance strength, mobility, and endurance in healthcare, military, and industrial applications. Advanced actuation, sensor integration, and improved battery efficiency support rehabilitation, heavy lifting, and mobility assistance. Ongoing innovation, funding, and partnerships continue to drive their widespread adoption globally.
Exoskeleton Market, By Component
Sensors are driving rapid growth in the exoskeleton market, enabling real-time responsiveness, motion detection, and user-adaptive functionality. Advances in EMG, gyroscopes, and force sensors, along with AI integration and miniaturization, enhance precision, safety, and personalization. Lightweight, wireless sensor systems are expanding adoption in healthcare, industrial, and military applications.
Exoskeleton Market, By Body Part
The lower extremities segment leads the exoskeleton market size, driven by the high prevalence of spinal cord injuries, strokes, and leg mobility impairments. Used in rehabilitation centers and home therapy, these devices improve gait, functional mobility, and independence. Advances in wearable robotics, clinical validation, and supportive insurance policies are increasing accessibility, reinforcing their adoption across healthcare and personal applications.
Exoskeleton Market, By Mobility
Mobile exoskeletons dominate the market due to their broad use across healthcare, industrial, and defense sectors. These systems enable dynamic movement, helping users perform real-world tasks like walking, lifting, and rehabilitation outside clinical settings. Their increasing application in injury prevention, workforce ergonomics, and personal mobility, along with significant investments and technological progress, further boost demand.
Exoskeleton Market, By Vertical
The healthcare sector dominates the exoskeleton market, fueled by the demand for mobility solutions for spinal cord injuries, rehabilitation, and mobility impairments. Exoskeletons improve therapy, independence, and patient outcomes. Increasing healthcare expenditure, technological advances like self-balancing designs, and rising adoption in hospitals and rehab centers are driving market growth.
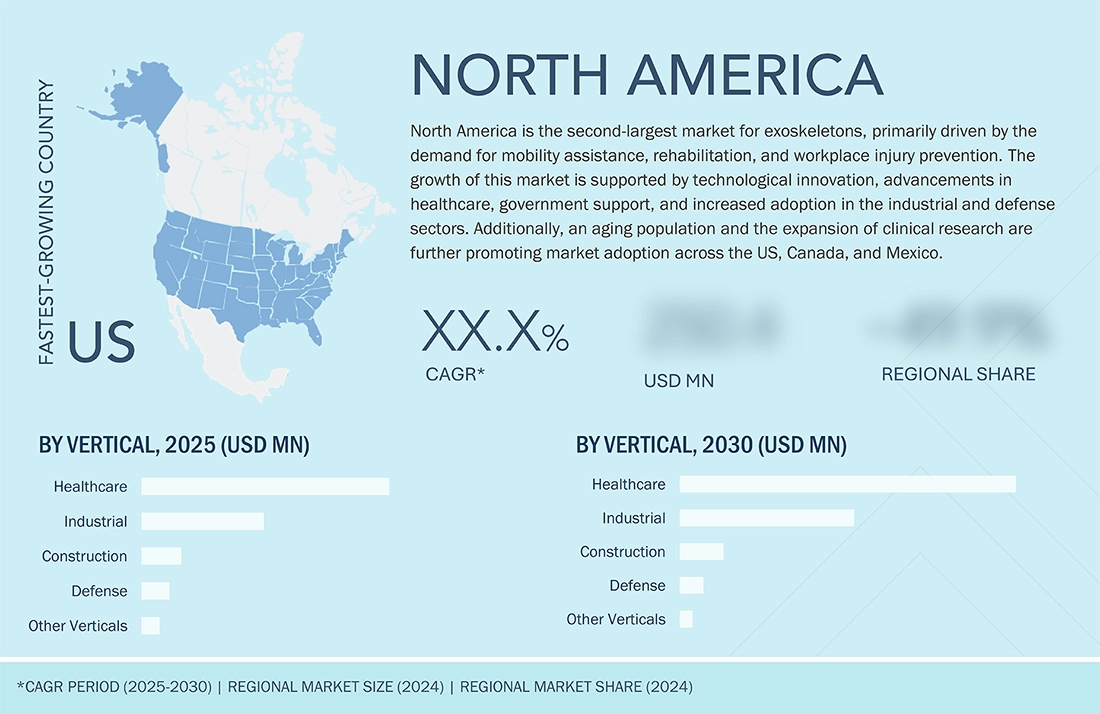
EXOSKELETON MARKET BY REGION
During the forecast period, the US is expected to be the fastest-growing market in North America.
The US leads the North American exoskeleton market due to strong investments and increasing demand across healthcare, industrial, and defense sectors. The country’s advanced healthcare system and large workforce support adoption. Exoskeletons are being used more often to reduce physical strain and improve safety for both workers and military personnel, driving higher adoption and market growth.
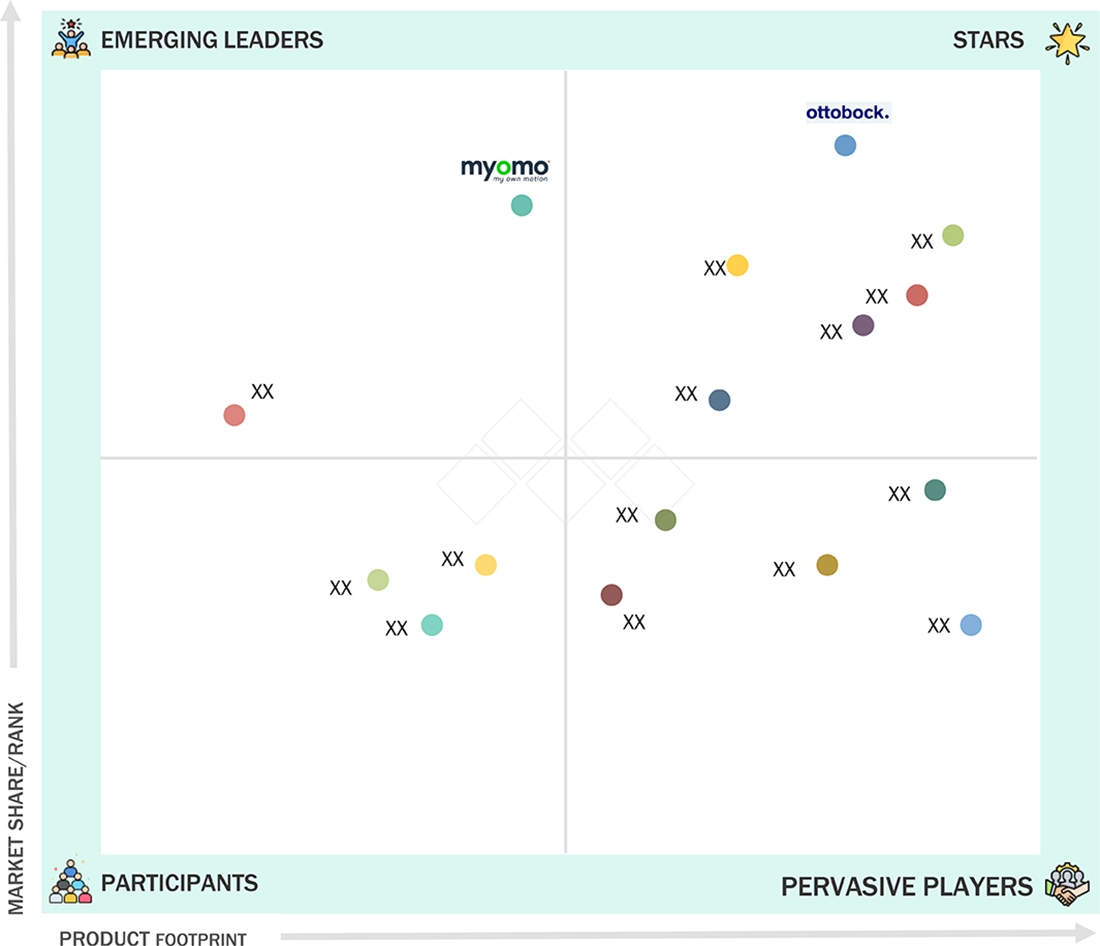
Exoskeleton Market: COMPANY EVALUATION MATRIX
In the exoskeleton companies matrix, Ottobock (Star) maintains a strong market presence, offers an extensive service portfolio, and continuously introduces product innovations, fueling widespread adoption across healthcare, industrial, and defense sectors. Myomo (Emerging Leader) is gaining momentum with its focused and innovative product offerings, steadily expanding its influence despite a smaller market share.
Source: Secondary Research, Interviews with Experts, MarketsandMarkets Analysis
EXOSKELETON MARKET : KEY PLAYERS
- Ekso Bionics (US)
- Ottobock (Germany)
- DIH Medical (Switzerland)
- Comau (Italy)
- Myomo Inc. (US)
- CYBERDYNE Inc. (Japan)
- Lifeward Ltd. (Israel)
- Hyundai Motor Group Robotics LAB. (South Korea)
- B-Temia (Canada)
- Rex Bionics Ltd. (New Zealand)
- ABLE Human Motion (Spain)
- Laevo Exoskeletons (Netherlands)
- German Bionic Systems GmbH (Germany)
- Levitate Technologies, Inc. (US)
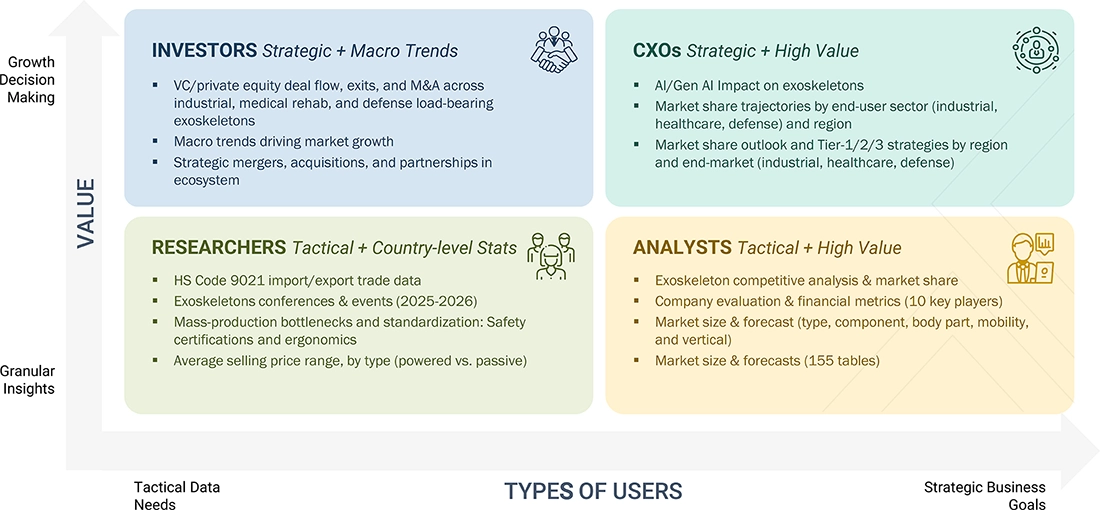
WHAT IS IN IT FOR YOU: Exoskeleton Market REPORT CONTENT GUIDE
DELIVERED CUSTOMIZATIONS
We have successfully delivered the following deep-dive customizations:
| CLIENT REQUEST | CUSTOMIZATION DELIVERED | VALUE ADDS |
|---|---|---|
| US-based Medical Exoskeleton Provider |
|
|
| Europe-based Industrial Exoskeleton Provider |
|
|
| Europe-based Exoskeleton Startup |
|
|
RECENT DEVELOPMENTS
- February 2025 : DIH Holding US, Inc. expanded its strategic partnership with Zahrawi Group (MTC Company) to include Saudi Arabia, strengthening collaboration across four Gulf countries. This expansion enhances the distribution of DIH's robotic rehabilitation solutions, leveraging Zahrawi Group's healthcare expertise.
- January 2025 : DIH Holding US, Inc. partnered with Nobis Rehabilitation Partners to integrate the Andago overground gait and balance training device into all newly established Nobis hospitals, improving rehabilitation standards and ensuring safety for patients and therapy teams.
- November 2024 : Hyundai Motor and Kia's Robotics LAB introduced the X-ble Shoulder, a wearable industrial robot designed to enhance worker safety and efficiency by reducing musculoskeletal strain, augmenting upper arm strength, and improving comfort during overhead tasks.
- June 2024 : Ekso Bionics partnered with Shepherd Center to integrate EksoNR and Ekso Indego exoskeletons into its rehabilitation network, supporting research and training programs for mobility-impaired patients and improving transition from hospital to home.
- February 2024 : DIH Holding US, Inc. merged with Aurora Technology Acquisition Corp., securing funding to strengthen its global presence in robotic and VR-enabled rehabilitation technologies.
Table of Contents
 Exclusive indicates content/data unique to MarketsandMarkets and not available with any competitors.
Methodology
The study used four major activities to estimate the size of the exoskeleton market. Exhaustive secondary research was conducted to gather information on the market and its peer and parent markets. The next step was to validate these findings, assumptions, and sizing with industry experts across the value chain through primary research. Both top-down and bottom-up approaches were employed to estimate the total market size. Finally, market breakdown and data triangulation methods were utilized to estimate the market size for different segments and subsegments.
Secondary Research
The research methodology used to estimate and forecast the size of the exoskeleton market began with the acquisition of data related to the revenues of key vendors in the market through secondary research. Various secondary sources were referred to in the secondary research process to identify and collect information for this study. Secondary sources included annual reports, press releases, and investor presentations of companies; white papers, journals, certified publications, and articles by recognized authors; websites; directories; and databases. Secondary research was mainly used to obtain key information about the value chain of the exoskeleton market, key players, market classification, and segmentation according to the industry trends to the bottom-most level, geographic markets, and key developments from both market and technology-oriented perspectives. Secondary data was collected and analyzed to determine the overall market size, further validated through primary research. The secondary research referred to for this research study involved the Exoskeleton Report LLC, MDPI, Journal of NeuroEngineering and Rehabilitation, National Library of Medicine, IEEE Spectrum, and various other sources. Moreover, the study involved extensive use of secondary sources, directories, and databases, such as Hoovers, Bloomberg Businessweek, Factiva, and OneSource, to identify and collect valuable information for a technical, market-oriented, and commercial study of the exoskeleton market. Vendor offerings were taken into consideration to determine market segmentation.
Primary Research
In the primary research, various primary sources from both the supply and demand sides were interviewed to obtain the qualitative and quantitative information relevant to this report. Primary sources from the supply side included the key industry participants, subject-matter experts (SMEs), and C-level executives and consultants from various key companies and organizations in the exoskeleton ecosystem. After the complete market engineering (including calculations for the market statistics, the market breakdown, the market size estimations, the market forecasting, and the data triangulation), extensive primary research was conducted to verify and validate the critical market numbers obtained. Extensive qualitative and quantitative analyses were performed during the market engineering process to list key information/insights throughout the report. Extensive primary research was conducted after understanding the exoskeleton market scenario through secondary research. Several primary interviews were conducted with market experts from the demand and supply-side players across key regions: North America, Europe, Asia Pacific, and the Rest of the World (Middle East, Africa, and South America). Various primary sources from the supply and demand sides of the market were interviewed to obtain qualitative and quantitative information. The following is the breakdown of the primary respondents.
Primary data was collected through questionnaires, emails, and telephonic interviews. In the canvassing of primaries, various departments within organizations, such as sales, operations, and administration, were covered to provide a holistic viewpoint in the report. After interacting with industry experts, brief sessions were conducted with highly experienced independent consultants to reinforce the findings from the primaries. This and the in-house subject matter experts’ opinions led to the findings described in the remainder of this report.

Note: The three tiers of the companies are defined based on their total revenue in 2024: Tier 1 - revenue greater than or equal to USD 1 billion; Tier 2 - revenue between USD 100 million and USD 1 billion; and Tier 3 revenue less than or equal to USD 100 million. Other designations include sales managers, marketing managers, and product managers.
To know about the assumptions considered for the study, download the pdf brochure
Market Size Estimation
Both top-down and bottom-up approaches were utilized to estimate and validate the size of the exoskeleton market and its submarkets. Secondary research was conducted to identify the key players in the market, and primary and secondary research was used to determine their market share in specific regions. The entire process involved studying top players' annual and financial reports and conducting extensive interviews with industry leaders such as CEOs, VPs, directors, and marketing executives. Secondary sources were used to determine all percentage shares and breakdowns, which were verified through primary sources. All parameters that could impact the markets covered in this research study were accounted for, analyzed in detail, verified through primary research, and consolidated to obtain the final quantitative and qualitative data.
Exoskeleton Market : Top-Down and Bottom-Up Approach

Data Triangulation
Once the overall size of the exoskeleton market was determined using the methods described above, it was divided into multiple segments and subsegments. Market engineering was performed for each segment and subsegment using market breakdown and data triangulation methods, as applicable, to obtain accurate statistics. To triangulate the data, various factors and trends from the demand and supply sides were studied. The market was validated using both top-down and bottom-up approaches.
Market Definition
The exoskeleton market encompasses wearable, externally mounted devices designed to augment, support, or restore human physical performance. These systems are typically categorized into powered and passive types and are used to assist with movement, reduce strain, or enhance strength and endurance. They incorporate advanced technologies such as sensors, actuators, and artificial intelligence to deliver real-time motion assistance and are applied across healthcare, industrial, military, and rehabilitation sectors. In medical applications, exoskeletons aid in mobility restoration for individuals with physical disabilities or spinal cord injuries.
Key Stakeholders
- Raw Material Providers
- Component Manufacturers
- OEMs (Original Equipment Manufacturers)
- System Integrators
- Distributors and Retailers
- End-user Industries
Report Objectives
- To estimate and forecast the size of the exoskeleton market, in terms of value, based on type, component, body part, mobility, vertical, and region
- To provide qualitative information about the structure of exoskeletons
- To describe and forecast the market size, in terms of value, for four major regions-North America, Europe, Asia Pacific, and Rest of the World (RoW)
- To provide detailed information regarding major factors such as drivers, restraints, opportunities, and challenges influencing market growth
- To provide a detailed overview of the exoskeleton value chain
- To strategically analyze micromarkets regarding individual market trends, growth prospects, and contributions to the total market
- To strategically profile key players and comprehensively analyze their market position in terms of ranking and core competencies, along with a detailed competitive landscape for the market leaders
- To analyze major growth strategies such as product launches/developments and acquisitions adopted by the key market players to enhance their market position
- To analyze the impact of the macroeconomic factors on the exoskeleton market
Customization Options:
With the given market data, MarketsandMarkets offers customizations according to the specific requirements of companies. The following customization options are available for the report:
- Detailed analysis and profiling of additional market players (up to 5)
- Additional country-level analysis of the exoskeleton market
Product Analysis
- Product matrix, which provides a detailed comparison of the product portfolio of each company in the exoskeleton market.
Key Questions Addressed by the Report
What is the current size of the Exoskeleton Market?
The global Exoskeleton Market is valued at approximately USD 0.56 billion in 2025 and is projected to reach USD 2.03 billion by 2030.
What is the expected growth rate of the Exoskeleton Market?
The market is expected to grow at a CAGR of 29.4% from 2025 to 2030, driven by increasing adoption across healthcare, industrial, and defense sectors.
What are the major growth drivers of the Exoskeleton Market?
Key growth drivers include rising spinal cord injuries, growing demand for rehabilitation solutions, increasing focus on worker safety, advancements in AI-powered robotics, and expanding industrial automation.
Which region leads the Exoskeleton Market?
Europe held the largest market share, accounting for approximately 35% of the global market in 2024, supported by strong healthcare infrastructure and industrial adoption.
Which industry segment dominates the Exoskeleton Market?
The healthcare sector is the largest end-user segment, driven by rehabilitation, mobility assistance, and physical therapy applications.
Which exoskeleton type is expected to grow the fastest?
Powered exoskeletons are expected to register the highest growth, with a projected CAGR of 32.4% during the forecast period due to superior mobility and assistance capabilities.
What are the key trends shaping the Exoskeleton Market?
Major trends include AI-integrated exoskeletons, lightweight materials, advanced sensors and actuators, wearable robotics for industrial workers, and increasing FDA-cleared medical exoskeleton deployments.
Who are the leading companies in the Exoskeleton Market?
Key market players include Ekso Bionics, Ottobock, DIH Medical, CYBERDYNE Inc., and Myomo Inc..
Which component segment holds the largest market share?
The actuator segment accounted for approximately 33% of the market share in 2024, as actuators are critical for movement assistance and power delivery in exoskeleton systems.
What does the Exoskeleton Market report analyze?
The report provides detailed analysis of market size, forecasts, growth drivers, trends, competitive landscape, component analysis, functionality, body part, type, regional outlook, and company profiles.
Need a Tailored Report?
Customize this report to your needs
Get 10% FREE Customization
Customize This ReportPersonalize This Research
- Triangulate with your Own Data
- Get Data as per your Format and Definition
- Gain a Deeper Dive on a Specific Application, Geography, Customer or Competitor
- Any level of Personalization
Let Us Help You
- What are the Known and Unknown Adjacencies Impacting the Exoskeleton Market
- What will your New Revenue Sources be?
- Who will be your Top Customer; what will make them switch?
- Defend your Market Share or Win Competitors
- Get a Scorecard for Target Partners

Custom Market Research Services
We Will Customise The Research For You, In Case The Report Listed Above Does Not Meet With Your Requirements
Get 10% Free CustomisationTESTIMONIALS

Tetsuya Ohhira
Business Development Manager-Technology Business
Nikon Corporation,
Leading Japanese MNC specializing in optics and imaging productswww.nikon.com
MarketsandMarkets™ response
is quick. Their attitude is flexible and positive. Analyst Insights are globally considered and
significant. Client Services quickly respond to our inquiry and demand. Their wide range of global
surveys help us make our strategic plan.
We hope Knowledge Store will be easier to search
for a report.
VP - Marketing & Business Development
Leading Provider of Process Control Solutions
We engaged with MarketsandMarkets on a study to perform an analysis and recommend a Go-To-Market strategy for metrology and process control in the semiconductor market. The study was tailored to our targets and needs with well-defined milestones. Our overall experience with the MarketsandMarkets team was very good throughout the project in all aspects including the analysis methodologies used, the quality and depth of primary and secondary data sets, the professionalism and flexibility of the team and the ability to meet the target schedule and milestones. We want to thank MarketsandMarkets team for a job well done.
Growth opportunities and latent adjacency in Exoskeleton Market


LAMONT
May, 2019
Could you please send me the brochure for Exoskeleton Market report? .
Eugene
Apr, 2026
As a product development head, will this study help evaluate advancements in actuators, sensors, and control systems shaping next-generation exoskeleton performance?.
Felix
Apr, 2026
As a defense sector strategist, does the report explore growth opportunities and adoption trends of exoskeletons in military and tactical applications?.
Anna
Mar, 2019
Would like to see the brochure for: Exoskeleton Market by Component (Hardware and Software), Type (Powered and Passive), Mobility (Stationary and Mobile), Body Part (Lower, Upper, and Full Body), Vertical (Healthcare, Defense, and Industrial), and Geography - Global Forecast to 2023. .
Anna
Mar, 2019
Requesting to send executive summary of Exoskeleton Market- Global Forecast to 2023. .
Bryan
Jan, 2018
We want customization of this Exoskeleton Market by Component (Hardware and Software). Can you provide us with the customization of this study?.
Ramazan
Dec, 2019
I want to learn about exoskeleton market on world wide. So I will be glad if you allow me see the report..
Joseph
Oct, 2019
My objective in requesting to download this PDF is to gain a greater knowledge on the future and current markets of Exo-Skeletons..
Mukund
Mar, 2019
I'm working on a project which is aimed at developing a low-cost exoskeleton. For deeper insights into this market, I'll like to use this report in my research..
Leslie
Jan, 2017
We are a small company and are wondering if there are any discounts we can obtain re this report? Our intent is to quote from the report in our presentations - we are only interested in the rehabilitative section of the report (healthcare) - can we buy part of the report?.