Facial Recognition Market

Facial Recognition Market by Component (Software Tools (3D Facial Recognition) and Services), Application (Law Enforcement, Access Control, Emotion Recognition), Vertical (BFSI, Government and Defense, Automotive), and Region - Global Forecast to 2025

Report Code: TC 3421 Dec, 2020, by marketsandmarkets.com

Updated on : Aug 29, 2023

Facial Recognition Market Forecast & Statistics, Global Size

The global Facial Recognition Market size is projected to grow at a CAGR of 17.2% during the forecast period to reach USD 8.5 billion by 2025 from an estimated USD 3.8 billion in 2020. The major factors driving the growth of a market are the growing importance of the surveillance industry, increasing investment in facial recognition technologies by the government and defense sector, and increasing technological advancement across industry verticals. However, facial occlusion and face detection error, and lack of knowledge and awareness are some of the major challenges hindering the growth of the facial recognition market.


Facial Recognition Market

To know about the assumptions considered for the study, Request for Free Sample Report

Facial Recognition Market Dynamics

Driver: Increasing investments in facial recognition technologies by government and defense sectors

Governments across the world have been investing a significant amount of their resources in the adoption of facial recognition technologies, among which the US and China can be considered as the leading adopters. China is considered as one of the major adopters and exporters of facial recognition tools. The government in the country adopted surveillance technologies, which is one of the main reasons for the growth of the facial recognition market in the region. Currently, the country has the most extensive public surveillance system. According to Comparitech, the number of CCTV cameras in China range from 200 million to 626 million by 2020.

Facial recognition technologies have been deployed via homeland security, federal and regional law enforcement departments, and other security agencies across the globe. This has helped solve numerous criminal investigations, thereby facilitating various departments.  This has helped in the rapid identification of offenders, thus solving numerous criminal investigations. Government organizations are spending large amounts on the deployment of these solutions across different government applications, such as law enforcement, military and defense, and homeland security. The Defense Advanced Research Products Agency (DARPA), an agency of the US Department of Defense, funded the Facial Recognition Technology (FERET) evaluation from 1993–1997, to boost the advancement of face recognition algorithms and technologies This, in turn, has helped in evaluating the prototypes of facial recognition systems and propelled these systems from to become commercial market products.

Restraint: Difficulty in countering legal risks and eDiscovery

Facial recognition technology is used across industry verticals ranging from healthcare and retail to government and defense. Federal and police departments also use facial recognition technologies to catch suspected criminals in different cases. Even though the federal and police departments use this technology, the possibility of false matches poses a major problem in the implementation of facial recognition technologies.

For example, Boston's Logan Airport ran two separate facial recognition system tests at its security checkpoints, using volunteers posing as terrorists over a three-month period and posted disappointing results. Throughout the testing period, the systems correctly identified the volunteers 153 times and failed to identify the volunteers 96 times. The high number of false alarms can result in the arrest of innocent people that do not have any criminal records against them. The arrest of innocent individuals could further lead to them taking legal action against the concerned authorities. Hence, this also remains a major restraint in the implementation of facial recognition technology.

Opportunity: Adoption of the cloud-based facial recognition technology

The adoption of IoT is witnessing exponential growth also proves to be a prerequisite for facial recognition technologies, such as facial recognition, middleware, modeling and restructuring, and analytics. The growing cloud storage, which is expected to reach USD 65.41 billion by 2020, has provided a robust cloud-based storage platform, enabling the captured data to be stored and accessed easily from mobile devices and platforms. Cloud-based solutions reduce various upfront costs and eliminate concerns related to the maintenance of servers. Hence, cloud-based solutions are best-suited for Small and Medium Enterprises (SMEs) and organizations that find on-premises solutions expensive. The increasing adoption of cloud-based technology and IoT is a great opportunity for the growth of the facial recognition vendors, which would eliminate the barriers related to high costs.

Challenge: Lack of knowledge and awareness leading to technical challenges

Facial recognition is cutting-edge technology and has several advantages in different sectors. The technical challenges faced needing immediate attention to make the facial imaging approach robust for out-of-the-lab applications. According to the Neurodata Lab, the lack of effective data to train the algorithms is expected to impact the market growth negatively. The emotion AI technology is used to transform traditional business approaches and redefine them to enhance the organization’s productivity and profit margins. However, organizations lack AI skills and understanding that can help them design algorithms for governing a facial recognition system. This is due to the complexity of neural networks and Machine Learning (ML) algorithms in the facial recognition system and the unestablished regulatory environment for AI governance. An organization should have a skilled workforce for building critical ML models. Organizations around the world are challenged by the retention and increased attrition rates of skilled employees. Hence, inadequate AI expertise and skills pose a major challenge among organizations, which might reduce in the near future.

Among vertical segment, government and defense to hold the largest market size during the forecast period

The growing number of government and defense investments in implementing facial recognition technology for various activities, such as border control and criminal identification, are driving the adoption of the facial recognition technology solutions and services. Facial recognition eases the process of identification and verification; hence it is being adopted widely for immigration at airports and attendance tracking and monitoring. The increasing technological advancements across sectors are encouraging enterprises to adopt facial recognition tools and services for easier manual processing and time-saving.

Various governments are relying on ubiquitous sensors and powerful analytics algorithms, instead of the physical presence of a human. In the war against COVID-19, several governments have implemented these new surveillance devices in healthcare, public safety, and surveillance applications. There are some major surveillance and authentication use cases of facial recognition to fight against COVID-19. Governments of all the COVID-19 affected nations have allocated special budgets to fight the epidemic. Different countries are also using digital technology to tackle the pandemic by strict monitoring with Closed-Circuit Television (CCTV) cameras and using smart city services, such as smart transportation, smart parking, and smart citizen services for their citizens. People are advised to use delivery apps for essential items required. Maps are used to locate the real-time availability of essential items with confirmation from local people over the app. Digital banking transactions are also promoted to avoid touch and flow of contaminated cash.

Facial Recognition Market by Region

Asia Pacific to grow with fastest growing CAGR during the forecast period

APAC includes big and developing economies, such as China, Japan, India, Singapore, and South Korea. The growing number of investments in security and surveillance, due to high criminal activities, leads to increased public awareness. Owing to these factors, the market in witnessing growth opportunities in the region. The use of facial recognition technology is used across verticals, such as BFSI, healthcare, government, defense and places, including airports, country, and state borders. The growing number of investments in security and surveillance, due to high criminal activities, leads to increased public awareness. Owing to these factors, the market in witnessing growth opportunities in the region. For example, passengers at the Narita International Airport in Japan will be able to board flights with facial biometrics instead of a passport or boarding pass check, starting in spring, 2020.

According to the Biometric update, the facial recognition system is expected to increase convenience for travelers, including those attending the 2020 Tokyo Summer Olympics and Paralympics, for which a similar fast-matching facial recognition solution from NEC will be used for athlete screening. This varied application of facial recognition technology across various countries is driving the facial recognition market in APAC. During the COVID-19 pandamic, Countries such as South Korea and Singapore have done better than Spain and Italy. Asian countries have used technologies, which can resist the pandemic. For instance, South Korea has designed an app called Corona 100m, which alerts the users if they come within a range of 100 meters of a corona-affected person

Technology Analysis

Facial recognition is the process of detecting and identifying the identity of the individuals with the help of their face.  Face recognition systems utilize images, videos or real-time footage for identification. Following are the steps of how a facial recognition system works:

  • Image is captured
  • Eye locations are determined
  • Image is converted to grayscale and cropped
  • Image is converted to a template used by the search engine for facial comparison results
  • Image is searched and matched using a sophisticated algorithm to compare the template to other templates in the database
  • Duplicate licenses are investigated for fraud

Source: Electronic Frontier Foundation (EFF)

Facial recognition systems use computer algorithms to detect and select specifics or characteristics of a person’s face. These characteristics could be eyes, the shape of the eyes and chin, skin texture, and others. These details are then converted into mathematical models and compared with other face characteristics collected and stored in a database. AI, ML, deep learning, and neuroscience are the major and basic technologies behind facial recognition systems.

Facial Recognition Market Interconnection

Facial Recognition Market by Interconnection

Adjacent Markets

The adjacent markets for the facial recognition market are Emotion Detection and Recognition Market, Image Recognition Market, Voice Biometrics Market, Biometric System Market, Biometric-as-a-Service Market, Access Control Market, Video Surveillance Market, Physical Security Market, Public Safety and Security Market.

Top Companies

Major vendors in the global facial recognition market include NEC Corporation (NEC) (Japan), Aware, Inc. (Aware) (US), Ayonix Corporation (Ayonix) (Japan), Cognitec Systems GmbH (Cognitec Systems) (Germany), NVISO SA (nViso) (Switzerland), Animetrics (US), Neurotechnology (Lithuania), Daon (Ireland), Stereovision Imaging, Inc. (SVI) (US), Techno Brain (Dubai), Innovatrics (Bratislava), id3 Technologies (id3) (Israel), Thales (France), Idemia (France), Nuance Communications, Inc. (Nuance) (US), BioID (Germany), Fulcrum Biometrics, LLC. (Fulcrum Biometrics) (US), TrueFace.AI (US), Amazon (US), FacePhi (Spain), Herta Security (Herta) (Spain), Kairos AR, Inc. (Kairos) (US), SightCorp Inc. (SightCorp) (The Netherlands), and Microsoft Corporation (Microsoft) (US).

Thales:

Thales e-Security was founded in 2000 and is headquartered in La Defense, France. The company specializes in aerospace, defense, security, space, transportation, and cybersecurity. Thales e-Security, specializes in data encryption, tokenization, data masking, Hardware Security Model (HSM) management, key management, and digital signature. The company caters to various verticals, such as business services, CSPs, SaaS providers, connected vehicle security, education, financial services, government, healthcare, high-tech manufacturing, insurance providers, IoT, security and managed services, media and entertainment, outsourcing, retail, and pharmacies. Thales e-Security has a wide employee base with regional offices set up in more than 56 countries. The company, in April 2019, acquired Gemalto N.V., a Netherlands-based international digital security company that provides software applications and secure personal devices.

The company has a large clientele comprising both public and private sector clients from across the globe. Some of its major customers include Fujitsu, BMC Software, Delta Dental of Missouri, and McKesson.

Report Highlights:

Report Metric

Details

Market size value in 2020

USD 3.8 billion

Revenue forecast in 2025

USD 8.5 billion

Growth Rate

17.2% CAGR

Historical period

2014-2025

Base year 

2019

Forecast period

2021-2025

Forecast units

Value (USD Billion)

Segments covered

Component (incl. software tools and services), Application, Verticals and Regions

Market Drivers

  • Growing importance of the surveillance industry
  • Increasing investments in facial recognition technologies by government and defense sectors
  • Increasing technological advancements across industry verticals

Market Opportunities

  • Adoption of the cloud-based facial recognition technology
  • Emerging applications for facial recognition technology

Geographies covered

North America, Europe, Asia Pacific, Middle East & Africa (MEA), and Latin America

Top companies covered

NEC Corporation (NEC) (Japan), Aware, Inc. (Aware) (US), Ayonix Corporation (Ayonix) (Japan), Cognitec Systems GmbH (Cognitec Systems) (Germany), NVISO SA (nViso) (Switzerland), Animetrics (US), Neurotechnology (Lithuania), Daon (Ireland), Stereovision Imaging, Inc. (SVI) (US), Techno Brain (Dubai), Innovatrics (Bratislava), id3 Technologies (id3) (Israel), Thales (France), Idemia (France), Nuance Communications, Inc. (Nuance) (US), BioID (Germany), Fulcrum Biometrics, LLC. (Fulcrum Biometrics) (US), TrueFace.AI (US), Amazon (US), FacePhi (Spain), Herta Security (Herta) (Spain), Kairos AR, Inc. (Kairos) (US), SightCorp Inc. (SightCorp) (The Netherlands), and Microsoft Corporation (Microsoft) (US).

Recent Developments

  • In August 2020, Microsoft Azure updated its facial recognition solution. Microsoft’s Azure supports a hybrid architecture that empowers businesses so that they can control their data and provide flexibility and cost savings for running workloads and applications.
  • In April 2020, Microsoft Azure updated its facial recognition solution. The new version has a simplified User Interface (UI) and addresses customer feedback easily. It also helps devices to get faster and updated data, which can be sent quickly with improved IoT Central application workflow.
  • In April 2020, Amazon expanded its business operations. AWS setup three Availability Zones in AWS Africa (Cape Town) region. The aim of establishing its first infrastructure on the African continent was to drive the adoption of cloud in the region. With AWS infrastructure, African regions could meet the highest levels of security, compliance, and data protection regulations, such as the Protection of Personal Information Act (POPIA).
  • In February 2020, Thales launched Fast Identity Online 2.0 (FIDO2) and Microsoft Azure AD tested devices that would offer password-less access to cloud apps, domains, and all connected devices and services. This will ultimately help businesses and organizations move their operations securely to the cloud.
  • In February 2020, Thales partnered with Fujitsu, a leading Japanese ICT technology company that would offer a full range of technology, solutions, and services to support its new PKI security and enterprise data encryption offerings
  • In November 2019, IDEMIA collaborated with the Oklahoma Department of Public Safety, the Oklahoma Office of Management and Enterprise Services, and Innovate Oklahoma for deploying mobile phone-based driver’s license.
  • In November 2019, NEC partnered with INTERPOL to strengthen the latter’s cybersecurity by analyzing complex and sophisticated cybercrimes.
  • In October 2019, Daon partnered with AU10TIX and Kingland. Daon, AU10TIX, and Kingland joined the Nice Actimize’s X-sight marketplace, which is the industry’s first financial crime management ecosystem.
  • In October 2019, IDEMIA acquired X Core Technologies Metal Payment Card business and launched the Smart Metal Art offers.
  • In April 2019, Thales Group, a parent company of Thales e-Security, announced the completion of its acquisition of Gemalto, a leader in digital identity and security. The acquisition would create a world-class leader with an unrivalled portfolio of digital identity and security solutions based on technologies, such as biometry, data protection, and, more broadly, cybersecurity.

Frequently Asked Questions (FAQ):

To speak to our analyst for a discussion on the above findings, click Speak to Analyst


TABLE OF CONTENTS

1 INTRODUCTION (Page No. - 43)
    1.1 INTRODUCTION TO COVID-19
    1.2 COVID-19 HEALTH ASSESSMENT
        FIGURE 1 COVID-19: GLOBAL PROPAGATION
        FIGURE 2 COVID-19 PROPAGATION: SELECT COUNTRIES
    1.3 COVID-19 ECONOMIC ASSESSMENT
        FIGURE 3 REVISED GROSS DOMESTIC PRODUCT FORECASTS FOR SELECT G20 COUNTRIES IN 2020
           1.3.1 COVID-19 ECONOMIC IMPACT—SCENARIO ASSESSMENT
                 FIGURE 4 CRITERIA IMPACTING GLOBAL ECONOMY
                 FIGURE 5 SCENARIOS IN TERMS OF RECOVERY OF GLOBAL ECONOMY
    1.4 OBJECTIVES OF THE STUDY
    1.5 MARKET DEFINITION
           1.5.1 INCLUSIONS AND EXCLUSIONS
    1.6 MARKET SCOPE
           1.6.1 MARKET SEGMENTATION
           1.6.2 REGIONS COVERED
    1.7 YEARS CONSIDERED FOR THE STUDY
    1.8 CURRENCY CONSIDERED
        TABLE 1 UNITED STATES DOLLAR EXCHANGE RATE, 2014–2019
    1.9 STAKEHOLDERS
    1.10 SUMMARY OF CHANGES

2 RESEARCH METHODOLOGY (Page No. - 53)
    2.1 RESEARCH DATA
        FIGURE 6 FACIAL RECOGNITION MARKET: RESEARCH DESIGN
           2.1.1 SECONDARY DATA
           2.1.2 PRIMARY DATA
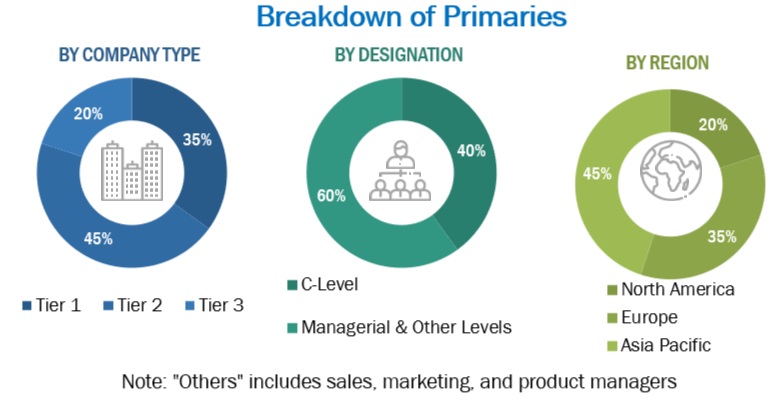
                    2.1.2.1 Breakup of primary profiles
    2.2 MARKET BREAKUP AND DATA TRIANGULATION
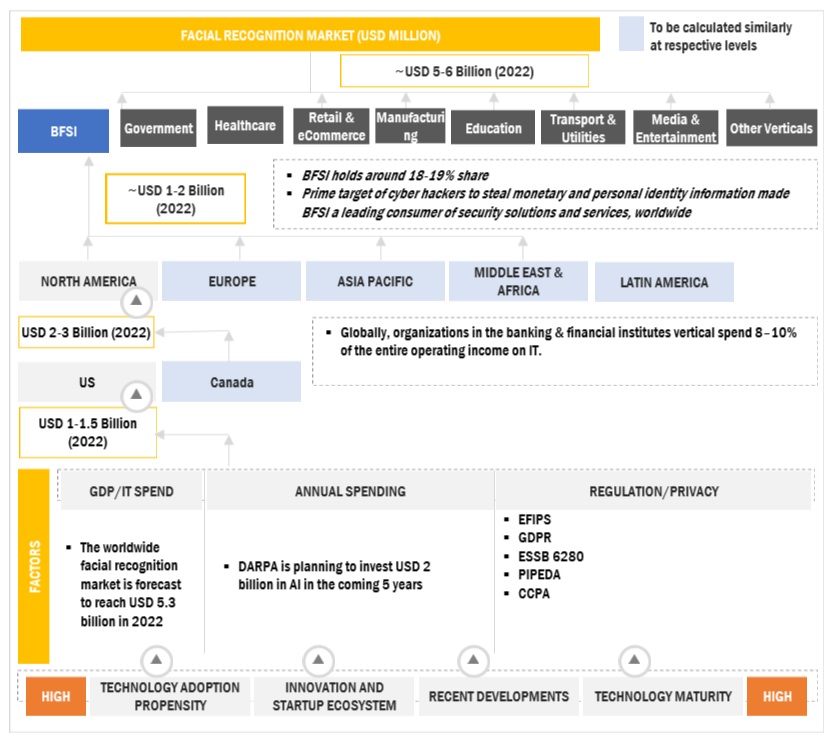
    2.3 MARKET SIZE ESTIMATION
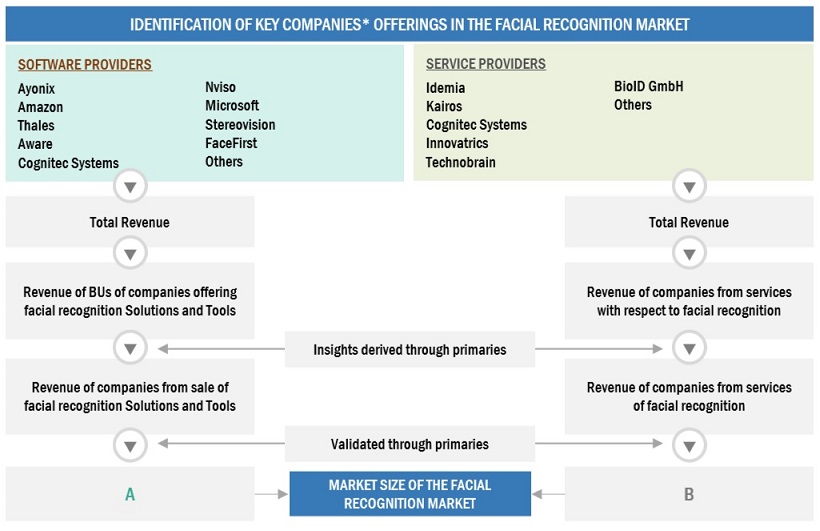
        FIGURE 7 MARKET SIZE ESTIMATION METHODOLOGY - APPROACH 1 (SUPPLY SIDE): REVENUE OF SOFTWARE TOOLS AND SERVICES OF THE MARKET
        FIGURE 8 MARKET SIZE ESTIMATION METHODOLOGY—APPROACH 1— BOTTOM-UP (SUPPLY SIDE): COLLECTIVE REVENUE OF ALL SOFTWARE TOOLS AND SERVICES OF MARKET
        FIGURE 9 MARKET SIZE ESTIMATION METHODOLOGY—APPROACH 2—BOTTOM-UP (DEMAND SIDE): PRODUCTS/SOLUTIONS/SERVICES
    2.4 MARKET FORECAST
        FIGURE 10 FACTOR ANALYSIS
    2.5 ASSUMPTIONS FOR THE STUDY
    2.6 LIMITATIONS OF THE STUDY

3 EXECUTIVE SUMMARY (Page No. - 62)
  TABLE 2 FACIAL RECOGNITION MARKET SIZE AND GROWTH, 2014–2019 (USD MILLION, Y-O-Y %)
  TABLE 3 PRE-COVID-19: MARKET SIZE AND GROWTH, 2019–2025 (USD MILLION, Y-O-Y %)
  TABLE 4 POST-COVID-19: MARKET SIZE AND GROWTH, 2019–2025 (USD MILLION, Y-O-Y %)
  FIGURE 11 NORTH AMERICA TO ACCOUNT FOR THE HIGHEST MARKET SHARE IN 2020
  FIGURE 12 SEGMENTS WITH THE HIGHEST CAGRS IN THE MARKET DURING THE FORECAST PERIOD

4 PREMIUM INSIGHTS (Page No. - 67)
    4.1 ATTRACTIVE OPPORTUNITIES IN THE FACIAL RECOGNITION MARKET
        FIGURE 13 GROWING IMPORTANCE OF THE SURVEILLANCE INDUSTRY TO BOOST THE MARKET GROWTH
    4.2 MARKET, BY COMPONENT, 2020
        FIGURE 14 SOFTWARE TOOLS SEGMENT TO HOLD A LARGER MARKET SIZE DURING THE FORECAST PERIOD
    4.3 MARKET, BY SOFTWARE TOOL, 2020
        FIGURE 15 2D FACIAL RECOGNITION SEGMENT TO HOLD THE LARGEST MARKET SIZE DURING THE FORECAST PERIOD
    4.4 MARKET, BY SERVICE, 2020
        FIGURE 16 TRAINING AND CONSULTING SEGMENT TO HOLD A HIGHER MARKET SHARE DURING THE FORECAST PERIOD
    4.5 FACIAL RECOGNITION MARKET, SHARE OF TOP THREE VERTICALS AND REGIONS, 2020
        FIGURE 17 GOVERNMENT AND DEFENSE VERTICAL AND NORTH AMERICA TO HAVE THE HIGHEST MARKET SHARE IN 2020
    4.6 MARKET INVESTMENT SCENARIO
        FIGURE 18 ASIA PACIFIC TO EMERGE AS THE BEST MARKET FOR INVESTMENTS IN THE NEXT FIVE YEARS

5 MARKET OVERVIEW AND INDUSTRY TRENDS (Page No. - 71)
    5.1 INTRODUCTION
    5.2 MARKET DYNAMICS
        FIGURE 19 FACIAL RECOGNITION MARKET: DRIVERS, RESTRAINTS, OPPORTUNITIES, AND CHALLENGES
           5.2.1 DRIVERS
                    5.2.1.1 Growing importance of the surveillance industry
                    5.2.1.2 Increasing investments in facial recognition technologies by government and defense sectors
                    5.2.1.3 Increasing technological advancements across industry verticals
                    5.2.1.4 COVID-19 Impact
           5.2.2 RESTRAINTS
                    5.2.2.1 Privacy concerns related to the adoption of facial recognition technologies
                    5.2.2.2 Difficulty in countering legal risks and eDiscovery
                    5.2.2.3 COVID-19 Impact
           5.2.3 OPPORTUNITIES
                    5.2.3.1 Adoption of the cloud-based facial recognition technology
                    5.2.3.2 Emerging applications for facial recognition technology
                    5.2.3.3 COVID-19 Impact
           5.2.4 CHALLENGES
                    5.2.4.1 Facial occlusion and facial detection error
                    5.2.4.2 Lack of knowledge and awareness leading to technical challenges
                    5.2.4.3 COVID-19 Impact
           5.2.5 COVID-19 PANDEMIC-DRIVEN MARKET DYNAMICS AND FACTOR ANALYSIS
                    5.2.5.1 Drivers and Opportunities
                    5.2.5.2 Restraint and Challenges
    5.3 USE CASES
           5.3.1 USE CASE: ZENUS
           5.3.2 USE CASE: SIGNICAT
           5.3.3 USE CASE: NEC
    5.4 REGULATORY LANDSCAPE
           5.4.1 GENERAL DATA PROTECTION REGULATION
           5.4.2 FEDERAL INFORMATION PROCESSING STANDARDS
           5.4.3 ESSB 6280
           5.4.4 PERSONAL INFORMATION PROTECTION AND ELECTRONIC DOCUMENTS ACT
    5.5 FACIAL RECOGNITION MARKET ECOSYSTEM
        FIGURE 20 ECOSYSTEM: MARKET
    5.6 FACIAL RECOGNITION SYSTEM ANALYSIS, BY STAKEHOLDER
           5.6.1 TECHNOLOGY PROVIDERS
           5.6.2 SYSTEM INTEGRATORS
           5.6.3 RESELLERS
           5.6.4 MANAGED SERVICE PROVIDERS
    5.7 PRICING MODEL ANALYSIS
    5.8 TECHNOLOGY ANALYSIS

6 FACIAL RECOGNITION MARKET, BY COMPONENT (Page No. - 88)
    6.1 INTRODUCTION
        FIGURE 21 SOFTWARE TOOLS SEGMENT TO HOLD A LARGER MARKET SIZE DURING THE FORECAST PERIOD
        TABLE 5 MARKET SIZE, BY COMPONENT, 2014–2019 (USD MILLION)
        TABLE 6 MARKET SIZE, BY COMPONENT, 2019–2025 (USD MILLION)
    6.2 SOFTWARE TOOLS
           6.2.1 SOFTWARE TOOLS: MARKET DRIVERS
           6.2.2 SOFTWARE TOOLS: COVID-19 IMPACT
                 TABLE 7 COMPONENT: MARKET SIZE, BY SOFTWARE TOOL, 2014–2019 (USD MILLION)
                 TABLE 8 COMPONENT: MARKET SIZE, BY SOFTWARE TOOL, 2019–2025 (USD MILLION)
                 TABLE 9 SOFTWARE TOOLS: MARKET SIZE, BY REGION, 2014–2019 (USD MILLION)
                 TABLE 10 SOFTWARE TOOLS: MARKET SIZE, BY REGION, 2019–2025 (USD MILLION)
           6.2.3 2D FACIAL RECOGNITION
                 TABLE 11 2D FACIAL RECOGNITION: FACIAL RECOGNITION MARKET SIZE, BY REGION, 2014–2019 (USD MILLION)
                 TABLE 12 2D FACIAL RECOGNITION: MARKET SIZE, BY REGION, 2019–2025 (USD MILLION)
           6.2.4 3D FACIAL RECOGNITION
                 TABLE 13 3D FACIAL RECOGNITION: MARKET SIZE, BY REGION, 2014–2019 (USD MILLION)
                 TABLE 14 3D FACIAL RECOGNITION: MARKET SIZE, BY REGION, 2019–2025 (USD MILLION)
           6.2.5 FACIAL ANALYTICS
                 TABLE 15 FACIAL ANALYTICS: MARKET SIZE, BY REGION, 2014–2019 (USD MILLION)
                 TABLE 16 FACIAL ANALYTICS: MARKET SIZE, BY REGION, 2019–2025 (USD MILLION)
    6.3 SERVICES
           6.3.1 SERVICES: MARKET DRIVERS
           6.3.2 SERVICES: COVID-19 IMPACT
                 TABLE 17 COMPONENT: MARKET SIZE, BY SERVICE, 2014–2019 (USD MILLION)
                 TABLE 18 COMPONENT: MARKET SIZE, BY SERVICE, 2019–2025 (USD MILLION)
                 TABLE 19 SERVICES: FACIAL RECOGNITION MARKET SIZE, BY REGION, 2014–2019 (USD MILLION)
                 TABLE 20 SERVICES: MARKET SIZE, BY REGION, 2019–2025 (USD MILLION)
           6.3.3 TRAINING AND CONSULTING
                 TABLE 21 TRAINING AND CONSULTING: MARKET SIZE, BY REGION, 2014–2019 (USD MILLION)
                 TABLE 22 TRAINING AND CONSULTING: MARKET SIZE, BY REGION, 2019–2025 (USD MILLION)
           6.3.4 CLOUD-BASED FACIAL RECOGNITION
                 TABLE 23 CLOUD-BASED FACIAL RECOGNITION: MARKET SIZE, BY REGION, 2014–2019 (USD MILLION)
                 TABLE 24 CLOUD-BASED FACIAL RECOGNITION: MARKET SIZE, BY REGION, 2019–2025 (USD MILLION)

7 FACIAL RECOGNITION MARKET, BY APPLICATION (Page No. - 100)
    7.1 INTRODUCTION
           7.1.1 APPLICATIONS: MARKET DRIVERS
           7.1.2 APPLICATIONS: COVID-19 IMPACT
                 FIGURE 22 LAW ENFORCEMENT SEGMENT TO HOLD THE LARGEST MARKET SIZE DURING THE FORECAST PERIOD
                 TABLE 25 MARKET SIZE, BY APPLICATION, 2014–2019 (USD MILLION)
                 TABLE 26 MARKET SIZE, BY APPLICATION, 2019–2025 (USD MILLION)
    7.2 LAW ENFORCEMENT
        TABLE 27 LAW ENFORCEMENT: MARKET SIZE, BY REGION, 2014–2019 (USD MILLION)
        TABLE 28 LAW ENFORCEMENT: MARKET SIZE, BY REGION, 2019–2025 (USD MILLION)
    7.3 ACCESS CONTROL
        TABLE 29 ACCESS CONTROL: MARKET SIZE, BY REGION, 2014–2019 (USD MILLION)
        TABLE 30 ACCESS CONTROL: MARKET SIZE, BY REGION, 2019–2025 (USD MILLION)
    7.4 EMOTION RECOGNITION
        TABLE 31 EMOTION RECOGNITION: FACIAL RECOGNITION MARKET SIZE, BY REGION, 2014–2019 (USD MILLION)
        TABLE 32 EMOTION RECOGNITION: MARKET SIZE, BY REGION, 2019–2025 (USD MILLION)
    7.5 ATTENDANCE TRACKING AND MONITORING
        TABLE 33 ATTENDANCE TRACKING AND MONITORING: MARKET SIZE, BY REGION, 2014–2019 (USD MILLION)
        TABLE 34 ATTENDANCE TRACKING AND MONITORING: MARKET SIZE, BY REGION, 2019–2025 (USD MILLION)
    7.6 OTHER APPLICATIONS
        TABLE 35 OTHER APPLICATIONS: MARKET SIZE, BY REGION, 2014–2019 (USD MILLION)
        TABLE 36 OTHER APPLICATIONS: MARKET SIZE, BY REGION, 2019–2025 (USD MILLION)

8 FACIAL RECOGNITION MARKET, BY VERTICAL (Page No. - 109)
    8.1 INTRODUCTION
        FIGURE 23 GOVERNMENT AND DEFENSE VERTICAL TO LEAD THE MARKET DURING THE FORECAST PERIOD
           8.1.1 VERTICALS: MARKET DRIVERS
           8.1.2 VERTICALS: COVID-19 IMPACT
                 TABLE 37 MARKET SIZE, BY VERTICAL, 2014–2019 (USD MILLION)
                 TABLE 38 MARKET SIZE, BY VERTICAL, 2019–2025 (USD MILLION)
    8.2 BANKING, FINANCIAL SERVICES AND INSURANCE
        TABLE 39 USE CASES: BANKING, FINANCIAL SERVICES AND INSURANCE
        TABLE 40 BANKING, FINANCIAL SERVICES AND INSURANCE: MARKET SIZE, BY REGION, 2014–2019 (USD MILLION)
        TABLE 41 BANKING, FINANCIAL SERVICES AND INSURANCE: MARKET SIZE, BY REGION, 2019–2025 (USD MILLION)
    8.3 RETAIL AND ECOMMERCE
        TABLE 42 USE CASES: RETAIL AND ECOMMERCE
        TABLE 43 RETAIL AND ECOMMERCE: FACIAL RECOGNITION MARKET SIZE, BY REGION, 2014–2019 (USD MILLION)
        TABLE 44 RETAIL AND ECOMMERCE: MARKET SIZE, BY REGION, 2019–2025 (USD MILLION)
    8.4 GOVERNMENT AND DEFENSE
        TABLE 45 USE CASES: GOVERNMENT AND DEFENSE
        TABLE 46 GOVERNMENT AND DEFENSE: MARKET SIZE, BY REGION, 2014–2019 (USD MILLION)
        TABLE 47 GOVERNMENT AND DEFENSE: MARKET SIZE, BY REGION, 2019–2025 (USD MILLION)
    8.5 HEALTHCARE
        TABLE 48 USE CASES: HEALTHCARE
        TABLE 49 HEALTHCARE: MARKET SIZE, BY REGION, 2014–2019 (USD MILLION)
        TABLE 50 HEALTHCARE: MARKET SIZE, BY REGION, 2019–2025 (USD MILLION)
    8.6 EDUCATION
        TABLE 51 USE CASES: EDUCATION
        TABLE 52 EDUCATION: FACIAL RECOGNITION MARKET SIZE, BY REGION 2014–2019 (USD MILLION)
        TABLE 53 EDUCATION: MARKET SIZE, BY REGION, 2019–2025 (USD MILLION)
    8.7 AUTOMOTIVE
        TABLE 54 USE CASES: AUTOMOTIVE
        TABLE 55 AUTOMOTIVE: MARKET SIZE, BY REGION, 2014–2019 (USD MILLION)
        TABLE 56 AUTOMOTIVE: MARKET SIZE, BY REGION, 2019–2025 (USD MILLION)
    8.8 OTHER VERTICALS
        TABLE 57 OTHER VERTICALS: MARKET SIZE, BY REGION, 2014–2019 (USD MILLION)
        TABLE 58 OTHER VERTICALS: MARKET SIZE, BY REGION, 2019–2025 (USD MILLION)

9 FACIAL RECOGNITION MARKET, BY REGION (Page No. - 126)
    9.1 INTRODUCTION
        TABLE 59 MARKET SIZE, BY REGION, 2014–2019 (USD MILLION)
        TABLE 60 MARKET SIZE, BY REGION, 2019–2025 (USD MILLION)
        FIGURE 24 MARKET IN APAC TO GROW AT THE HIGHEST CAGR FROM 2019 TO 2025
    9.2 NORTH AMERICA
        FIGURE 25 NORTH AMERICA: MARKET SNAPSHOT
           9.2.1 NORTH AMERICA: MARKET DRIVERS
           9.2.2 NORTH AMERICA: COVID-19 IMPACT
           9.2.3 NORTH AMERICA: FACIAL RECOGNITION REGULATIONS
                 TABLE 61 NORTH AMERICA: FACIAL RECOGNITION MARKET SIZE, BY COMPONENT, 2014–2019 (USD MILLION)
                 TABLE 62 NORTH AMERICA: MARKET SIZE, BY COMPONENT, 2019–2025 (USD MILLION)
                 TABLE 63 NORTH AMERICA: MARKET SIZE, BY SOFTWARE TOOL, 2014–2019 (USD MILLION)
                 TABLE 64 NORTH AMERICA: MARKET SIZE, BY SOFTWARE TOOL, 2019–2025 (USD MILLION)
                 TABLE 65 NORTH AMERICA: MARKET SIZE, BY SERVICE, 2014–2019 (USD MILLION)
                 TABLE 66 NORTH AMERICA: MARKET SIZE, BY SERVICE, 2019–2025 (USD MILLION)
                 TABLE 67 NORTH AMERICA: MARKET SIZE, BY APPLICATION AREA, 2014–2019 (USD MILLION)
                 TABLE 68 NORTH AMERICA: MARKET SIZE, BY APPLICATION AREA, 2019–2025 (USD MILLION)
                 TABLE 69 NORTH AMERICA: MARKET SIZE, BY VERTICAL, 2014–2019 (USD MILLION)
                 TABLE 70 NORTH AMERICA: MARKET SIZE, BY VERTICAL, 2019–2025 (USD MILLION)
                 TABLE 71 NORTH AMERICA: MARKET, BY COUNTRY, 2014–2019 (USD MILLION)
                 TABLE 72 NORTH AMERICA: MARKET, BY COUNTRY, 2019–2025 (USD MILLION)
                    9.2.3.1 United States
                            TABLE 73 UNITED STATES: FACIAL RECOGNITION MARKET SIZE, BY COMPONENT, 2014–2019 (USD MILLION)
                            TABLE 74 UNITED STATES: MARKET SIZE, BY COMPONENT, 2019–2025 (USD MILLION)
                            TABLE 75 UNITED STATES: MARKET SIZE, BY SOFTWARE TOOL, 2014–2019 (USD MILLION)
                            TABLE 76 UNITED STATES: MARKET SIZE, BY SOFTWARE TOOL, 2019–2025 (USD MILLION)
                            TABLE 77 UNITED STATES: MARKET SIZE, BY SERVICE, 2014–2019 (USD MILLION)
                            TABLE 78 UNITED STATES: MARKET SIZE, BY SERVICE, 2019–2025 (USD MILLION)
                            TABLE 79 UNITED STATES: MARKET SIZE, BY APPLICATION AREA, 2014–2019 (USD MILLION)
                            TABLE 80 UNITED STATES: MARKET SIZE, BY APPLICATION AREA, 2019–2025 (USD MILLION)
                            TABLE 81 UNITED STATES: MARKET SIZE, BY VERTICAL, 2014–2019 (USD MILLION)
                            TABLE 82 UNITED STATES: MARKET SIZE, BY VERTICAL, 2019–2025 (USD MILLION)
                    9.2.3.2 Canada
                            TABLE 83 CANADA: FACIAL RECOGNITION MARKET SIZE, BY COMPONENT, 2014–2019 (USD MILLION)
                            TABLE 84 CANADA: MARKET SIZE, BY COMPONENT, 2019–2025 (USD MILLION)
                            TABLE 85 CANADA: MARKET SIZE, BY SOFTWARE TOOL, 2014–2019 (USD MILLION)
                            TABLE 86 CANADA: MARKET SIZE, BY SOFTWARE TOOL, 2019–2025 (USD MILLION)
                            TABLE 87 CANADA: MARKET SIZE, BY SERVICE, 2014–2019 (USD MILLION)
                            TABLE 88 CANADA: MARKET SIZE, BY SERVICE, 2019–2025 (USD MILLION)
                            TABLE 89 CANADA: MARKET SIZE, BY APPLICATION AREA, 2014–2019 (USD MILLION)
                            TABLE 90 CANADA: MARKET SIZE, BY APPLICATION AREA, 2019–2025 (USD MILLION)
                            TABLE 91 CANADA: MARKET SIZE, BY VERTICAL, 2014–2019 (USD MILLION)
                            TABLE 92 CANADA: MARKET SIZE, BY VERTICAL, 2019–2025 (USD MILLION)
    9.3 EUROPE
        FIGURE 26 EUROPE: MARKET SNAPSHOT
           9.3.1 EUROPE: MARKET DRIVERS
           9.3.2 EUROPE: COVID-19 IMPACT
           9.3.3 EUROPE: FACIAL RECOGNITION REGULATIONS
                 TABLE 93 EUROPE: FACIAL RECOGNITION MARKET SIZE, BY COMPONENT, 2014–2019 (USD MILLION)
                 TABLE 94 EUROPE: MARKET SIZE, BY COMPONENT, 2019–2025 (USD MILLION)
                 TABLE 95 EUROPE: MARKET SIZE, BY SOFTWARE TOOL, 2014–2019 (USD MILLION)
                 TABLE 96 EUROPE: MARKET SIZE, BY SOFTWARE TOOL, 2019–2025 (USD MILLION)
                 TABLE 97 EUROPE: MARKET SIZE, BY SERVICE, 2014–2019 (USD MILLION)
                 TABLE 98 EUROPE: MARKET SIZE, BY SERVICE, 2019–2025 (USD MILLION)
                 TABLE 99 EUROPE: MARKET SIZE, BY APPLICATION AREA, 2014–2019 (USD MILLION)
                 TABLE 100 EUROPE: MARKET SIZE, BY APPLICATION AREA, 2019–2025 (USD MILLION)
                 TABLE 101 EUROPE: MARKET SIZE, BY VERTICAL, 2014–2019 (USD MILLION)
                 TABLE 102 EUROPE: MARKET SIZE, BY VERTICAL, 2019–2025 (USD MILLION)
                 TABLE 103 EUROPE: MARKET, BY COUNTRY, 2014–2019 (USD MILLION)
                 TABLE 104 EUROPE: MARKET, BY COUNTRY, 2019–2025 (USD MILLION)
                    9.3.3.1 United Kingdom
                            TABLE 105 UNITED KINGDOM: FACIAL RECOGNITION MARKET SIZE, BY COMPONENT, 2014–2019 (USD MILLION)
                            TABLE 106 UNITED KINGDOM: MARKET SIZE, BY COMPONENT, 2019–2025 (USD MILLION)
                            TABLE 107 UNITED KINGDOM: MARKET SIZE, BY SOFTWARE TOOL, 2014–2019 (USD MILLION)
                            TABLE 108 UNITED KINGDOM: MARKET SIZE, BY SOFTWARE TOOL, 2019–2025 (USD MILLION)
                            TABLE 109 UNITED KINGDOM: MARKET SIZE, BY SERVICE, 2014–2019 (USD MILLION)
                            TABLE 110 UNITED KINGDOM: MARKET SIZE, BY SERVICE, 2019–2025 (USD MILLION)
                            TABLE 111 UNITED KINGDOM: MARKET SIZE, BY APPLICATION AREA, 2014–2019 (USD MILLION)
                            TABLE 112 UNITED KINGDOM: MARKET SIZE, BY APPLICATION AREA, 2019–2025 (USD MILLION)
                            TABLE 113 UNITED KINGDOM: MARKET SIZE, BY VERTICAL, 2014–2019 (USD MILLION)
                            TABLE 114 UNITED KINGDOM: MARKET SIZE, BY VERTICAL, 2019–2025 (USD MILLION)
                    9.3.3.2 Germany
                            TABLE 115 GERMANY: FACIAL RECOGNITION MARKET SIZE, BY COMPONENT, 2014–2019 (USD MILLION)
                            TABLE 116 GERMANY: MARKET SIZE, BY COMPONENT, 2019–2025 (USD MILLION)
                            TABLE 117 GERMANY: MARKET SIZE, BY SOFTWARE TOOL, 2014–2019 (USD MILLION)
                            TABLE 118 GERMANY: MARKET SIZE, BY SOFTWARE TOOL, 2019–2025 (USD MILLION)
                            TABLE 119 GERMANY: MARKET SIZE, BY SERVICE, 2014–2019 (USD MILLION)
                            TABLE 120 GERMANY: MARKET SIZE, BY SERVICE, 2019–2025 (USD MILLION)
                            TABLE 121 GERMANY: MARKET SIZE, BY APPLICATION AREA, 2014–2019 (USD MILLION)
                            TABLE 122 GERMANY: MARKET SIZE, BY APPLICATION AREA, 2019–2025 (USD MILLION)
                            TABLE 123 GERMANY: MARKET SIZE, BY VERTICAL, 2014–2019 (USD MILLION)
                            TABLE 124 GERMANY: MARKET SIZE, BY VERTICAL, 2019–2025 (USD MILLION)
                    9.3.3.3 France
                            TABLE 125 FRANCE: FACIAL RECOGNITION MARKET SIZE, BY COMPONENT, 2014–2019 (USD MILLION)
                            TABLE 126 FRANCE: MARKET SIZE, BY COMPONENT, 2019–2025 (USD MILLION)
                            TABLE 127 FRANCE: MARKET SIZE, BY SOFTWARE TOOL, 2014–2019 (USD MILLION)
                            TABLE 128 FRANCE: MARKET SIZE, BY SOFTWARE TOOL, 2019–2025 (USD MILLION)
                            TABLE 129 FRANCE: MARKET SIZE, BY SERVICE, 2014–2019 (USD MILLION)
                            TABLE 130 FRANCE: MARKET SIZE, BY SERVICE, 2019–2025 (USD MILLION)
                            TABLE 131 FRANCE: MARKET SIZE, BY APPLICATION AREA, 2014–2019 (USD MILLION)
                            TABLE 132 FRANCE: MARKET SIZE, BY APPLICATION AREA, 2019–2025 (USD MILLION)
                            TABLE 133 FRANCE: MARKET SIZE, BY VERTICAL, 2014–2019 (USD MILLION)
                            TABLE 134 FRANCE: MARKET SIZE, BY VERTICAL, 2019–2025 (USD MILLION)
                    9.3.3.4 Rest of Europe
                            TABLE 135 REST OF EUROPE: FACIAL RECOGNITION MARKET SIZE, BY COMPONENT, 2014–2019 (USD MILLION)
                            TABLE 136 REST OF EUROPE: MARKET SIZE, BY COMPONENT, 2019–2025 (USD MILLION)
                            TABLE 137 REST OF EUROPE: MARKET SIZE, BY SOFTWARE TOOL, 2014–2019 (USD MILLION)
                            TABLE 138 REST OF EUROPE: MARKET SIZE, BY SOFTWARE TOOL, 2019–2025 (USD MILLION)
                            TABLE 139 REST OF EUROPE: MARKET SIZE, BY SERVICE, 2014–2019 (USD MILLION)
                            TABLE 140 REST OF EUROPE: MARKET SIZE, BY SERVICE, 2019–2025 (USD MILLION)
                            TABLE 141 REST OF EUROPE: MARKET SIZE, BY APPLICATION AREA, 2014–2019 (USD MILLION)
                            TABLE 142 REST OF EUROPE: MARKET SIZE, BY APPLICATION AREA, 2019–2025 (USD MILLION)
                            TABLE 143 REST OF EUROPE: MARKET SIZE, BY VERTICAL, 2014–2019 (USD MILLION)
                            TABLE 144 REST OF EUROPE: MARKET SIZE, BY VERTICAL, 2019–2025 (USD MILLION)
    9.4 ASIA PACIFIC
        FIGURE 27 ASIA-PACIFIC: MARKET SNAPSHOT
           9.4.1 ASIA PACIFIC: MARKET DRIVERS
           9.4.2 ASIA PACIFIC: COVID-19 IMPACT
           9.4.3 ASIA PACIFIC: FACIAL RECOGNITION REGULATIONS
                 TABLE 145 ASIA PACIFIC: FACIAL RECOGNITION MARKET SIZE, BY COMPONENT, 2014–2019 (USD MILLION)
                 TABLE 146 ASIA PACIFIC: MARKET SIZE, BY COMPONENT,  2019–2025 (USD MILLION)
                 TABLE 147 ASIA PACIFIC: MARKET SIZE, BY SOFTWARE TOOL, 2014–2019 (USD MILLION)
                 TABLE 148 ASIA PACIFIC: MARKET SIZE, BY SOFTWARE TOOL, 2019–2025 (USD MILLION)
                 TABLE 149 ASIA PACIFIC: MARKET SIZE, BY SERVICE, 2014–2019 (USD MILLION)
                 TABLE 150 ASIA PACIFIC: MARKET SIZE, BY SERVICE, 2019–2025 (USD MILLION)
                 TABLE 151 ASIA PACIFIC: MARKET SIZE, BY APPLICATION AREA, 2014–2019 (USD MILLION)
                 TABLE 152 ASIA PACIFIC: MARKET SIZE, BY APPLICATION AREA, 2019–2025 (USD MILLION)
                 TABLE 153 ASIA PACIFIC: MARKET SIZE, BY VERTICAL, 2014–2019 (USD MILLION)
                 TABLE 154 ASIA PACIFIC: MARKET SIZE, BY VERTICAL, 2019–2025 (USD MILLION)
                 TABLE 155 ASIA PACIFIC: MARKET, BY COUNTRY, 2014–2019 (USD MILLION)
                 TABLE 156 ASIA PACIFIC: MARKET, BY COUNTRY, 2019–2025 (USD MILLION)
                    9.4.3.1 China
                            TABLE 157 CHINA: FACIAL RECOGNITION MARKET SIZE, BY COMPONENT, 2014–2019 (USD MILLION)
                            TABLE 158 CHINA: MARKET SIZE, BY COMPONENT, 2019–2025 (USD MILLION)
                            TABLE 159 CHINA: MARKET SIZE, BY SOFTWARE TOOL, 2014–2019 (USD MILLION)
                            TABLE 160 CHINA: MARKET SIZE, BY SOFTWARE TOOL, 2019–2025 (USD MILLION)
                            TABLE 161 CHINA: MARKET SIZE, BY SERVICE, 2014–2019 (USD MILLION)
                            TABLE 162 CHINA: MARKET SIZE, BY SERVICE, 2019–2025 (USD MILLION)
                            TABLE 163 CHINA: MARKET SIZE, BY APPLICATION AREA, 2014–2019 (USD MILLION)
                            TABLE 164 CHINA: MARKET SIZE, BY APPLICATION AREA, 2019–2025 (USD MILLION)
                            TABLE 165 CHINA: MARKET SIZE, BY VERTICAL, 2014–2019 (USD MILLION)
                            TABLE 166 CHINA: MARKET SIZE, BY VERTICAL, 2019–2025 (USD MILLION)
                    9.4.3.2 Japan
                            TABLE 167 JAPAN: FACIAL RECOGNITION MARKET SIZE, BY COMPONENT, 2014–2019 (USD MILLION)
                            TABLE 168 JAPAN: MARKET SIZE, BY COMPONENT, 2019–2025 (USD MILLION)
                            TABLE 169 JAPAN: MARKET SIZE, BY SOFTWARE TOOL, 2014–2019 (USD MILLION)
                            TABLE 170 JAPAN: MARKET SIZE, BY SOFTWARE TOOL, 2019–2025 (USD MILLION)
                            TABLE 171 JAPAN: MARKET SIZE, BY SERVICE, 2014–2019 (USD MILLION)
                            TABLE 172 JAPAN: MARKET SIZE, BY SERVICE, 2019–2025 (USD MILLION)
                            TABLE 173 JAPAN: MARKET SIZE, BY APPLICATION AREA, 2014–2019 (USD MILLION)
                            TABLE 174 JAPAN: MARKET SIZE, BY APPLICATION AREA, 2019–2025 (USD MILLION)
                            TABLE 175 JAPAN: MARKET SIZE, BY VERTICAL, 2014–2019 (USD MILLION)
                            TABLE 176 JAPAN: MARKET SIZE, BY VERTICAL, 2019–2025 (USD MILLION)
                    9.4.3.3 India
                            TABLE 177 INDIA: FACIAL RECOGNITION MARKET SIZE, BY COMPONENT, 2014–2019 (USD MILLION)
                            TABLE 178 INDIA: MARKET SIZE, BY COMPONENT, 2019–2025 (USD MILLION)
                            TABLE 179 INDIA: MARKET SIZE, BY SOFTWARE TOOL, 2014–2019 (USD MILLION)
                            TABLE 180 INDIA: MARKET SIZE, BY SOFTWARE TOOL, 2019–2025 (USD MILLION)
                            TABLE 181 INDIA: MARKET SIZE, BY SERVICE, 2014–2019 (USD MILLION)
                            TABLE 182 INDIA: MARKET SIZE, BY SERVICE, 2019–2025 (USD MILLION)
                            TABLE 183 INDIA: MARKET SIZE, BY APPLICATION AREA, 2014–2019 (USD MILLION)
                            TABLE 184 INDIA: MARKET SIZE, BY APPLICATION AREA, 2019–2025 (USD MILLION)
                            TABLE 185 INDIA: MARKET SIZE, BY VERTICAL, 2014–2019 (USD MILLION)
                            TABLE 186 INDIA: MARKET SIZE, BY VERTICAL, 2019–2025 (USD MILLION)
                    9.4.3.4 Rest of Asia Pacific
                            TABLE 187 REST OF ASIA PACIFIC: FACIAL RECOGNITION MARKET SIZE, BY COMPONENT, 2014–2019 (USD MILLION)
                            TABLE 188 REST OF ASIA PACIFIC: MARKET SIZE, BY COMPONENT, 2019–2025 (USD MILLION)
                            TABLE 189 REST OF ASIA PACIFIC: MARKET SIZE, BY SOFTWARE TOOL, 2014–2019 (USD MILLION)
                            TABLE 190 REST OF ASIA PACIFIC: MARKET SIZE, BY SOFTWARE TOOL, 2019–2025 (USD MILLION)
                            TABLE 191 REST OF ASIA PACIFIC: MARKET SIZE, BY SERVICE, 2014–2019 (USD MILLION)
                            TABLE 192 REST OF ASIA PACIFIC: MARKET SIZE, BY SERVICE, 2019–2025 (USD MILLION)
                            TABLE 193 REST OF ASIA PACIFIC: MARKET SIZE, BY APPLICATION AREA, 2014–2019 (USD MILLION)
                            TABLE 194 REST OF ASIA PACIFIC: MARKET SIZE, BY APPLICATION AREA, 2019–2025 (USD MILLION)
                            TABLE 195 REST OF ASIA PACIFIC: MARKET SIZE, BY VERTICAL, 2014–2019 (USD MILLION)
                            TABLE 196 REST OF ASIA PACIFIC: MARKET SIZE, BY VERTICAL, 2019–2025 (USD MILLION)
    9.5 MIDDLE EAST AND AFRICA
        FIGURE 28 MIDDLE EAST AND AFRICA: MARKET SNAPSHOT
           9.5.1 MIDDLE EAST AND AFRICA: MARKET DRIVERS
           9.5.2 MIDDLE EAST AND AFRICA: COVID-19 IMPACT
           9.5.3 MIDDLE EAST AND AFRICA: FACIAL RECOGNITION REGULATIONS
                 TABLE 197 MIDDLE EAST AND AFRICA: FACIAL RECOGNITION MARKET SIZE, BY COMPONENT, 2014–2019 (USD MILLION)
                 TABLE 198 MIDDLE EAST AND AFRICA: MARKET SIZE, BY COMPONENT, 2019–2025 (USD MILLION)
                 TABLE 199 MIDDLE EAST AND AFRICA: MARKET SIZE, BY SOFTWARE TOOL, 2014–2019 (USD MILLION)
                 TABLE 200 MIDDLE EAST AND AFRICA: MARKET SIZE, BY SOFTWARE TOOL, 2019–2025 (USD MILLION)
                 TABLE 201 MIDDLE EAST AND AFRICA: MARKET SIZE, BY SERVICE, 2014–2019 (USD MILLION)
                 TABLE 202 MIDDLE EAST AND AFRICA: MARKET SIZE, BY SERVICE, 2019–2025 (USD MILLION)
                 TABLE 203 MIDDLE EAST AND AFRICA: MARKET SIZE, BY APPLICATION AREA, 2014–2019 (USD MILLION)
                 TABLE 204 MIDDLE EAST AND AFRICA: MARKET SIZE, BY APPLICATION AREA, 2019–2025 (USD MILLION)
                 TABLE 205 MIDDLE EAST AND AFRICA: MARKET SIZE, BY VERTICAL, 2014–2019 (USD MILLION)
                 TABLE 206 MIDDLE EAST AND AFRICA: MARKET SIZE, BY VERTICAL, 2019–2025 (USD MILLION)
                 TABLE 207 MIDDLE EAST AND AFRICA: MARKET, BY COUNTRY, 2014–2019 (USD MILLION)
                 TABLE 208 MIDDLE EAST AND AFRICA: MARKET, BY COUNTRY, 2019–2025 (USD MILLION)
                    9.5.3.1 United Arab Emirates
                            TABLE 209 UNITED ARAB EMIRATES: FACIAL RECOGNITION MARKET SIZE, BY COMPONENT, 2014–2019 (USD MILLION)
                            TABLE 210 UNITED ARAB EMIRATES: MARKET SIZE, BY COMPONENT, 2019–2025 (USD MILLION)
                            TABLE 211 UNITED ARAB EMIRATES: MARKET SIZE, BY SOFTWARE TOOL, 2014–2019 (USD MILLION)
                            TABLE 212 UNITED ARAB EMIRATES: MARKET SIZE, BY SOFTWARE TOOL, 2019–2025 (USD MILLION)
                            TABLE 213 UNITED ARAB EMIRATES: MARKET SIZE, BY SERVICE, 2014–2019 (USD MILLION)
                            TABLE 214 UNITED ARAB EMIRATES: MARKET SIZE, BY SERVICE, 2019–2025 (USD MILLION)
                            TABLE 215 UNITED ARAB EMIRATES: MARKET SIZE, BY APPLICATION AREA, 2014–2019 (USD MILLION)
                            TABLE 216 UNITED ARAB EMIRATES: MARKET SIZE, BY APPLICATION AREA, 2019–2025 (USD MILLION)
                            TABLE 217 UNITED ARAB EMIRATES: MARKET SIZE, BY VERTICAL, 2014–2019 (USD MILLION)
                            TABLE 218 UNITED ARAB EMIRATES: MARKET SIZE, BY VERTICAL, 2019–2025 (USD MILLION)
                    9.5.3.2 Kingdom of Saudi Arabia
                            TABLE 219 KINGDOM OF SAUDI ARABIA: FACIAL RECOGNITION MARKET SIZE, BY COMPONENT, 2014–2019 (USD MILLION)
                            TABLE 220 KINGDOM OF SAUDI ARABIA: MARKET SIZE, BY COMPONENT, 2019–2025 (USD MILLION)
                            TABLE 221 KINGDOM OF SAUDI ARABIA: MARKET SIZE, BY SOFTWARE TOOL, 2014–2019 (USD MILLION)
                            TABLE 222 KINGDOM OF SAUDI ARABIA: MARKET SIZE, BY SOFTWARE TOOL, 2019–2025 (USD MILLION)
                            TABLE 223 KINGDOM OF SAUDI ARABIA: MARKET SIZE, BY SERVICE, 2014–2019 (USD MILLION)
                            TABLE 224 KINGDOM OF SAUDI ARABIA: MARKET SIZE, BY SERVICE, 2019–2025 (USD MILLION)
                            TABLE 225 KINGDOM OF SAUDI ARABIA: MARKET SIZE, BY APPLICATION AREA, 2014–2019 (USD MILLION)
                            TABLE 226 KINGDOM OF SAUDI ARABIA: MARKET SIZE, BY APPLICATION AREA, 2019–2025 (USD MILLION)
                            TABLE 227 KINGDOM OF SAUDI ARABIA: MARKET SIZE, BY VERTICAL, 2014–2019 (USD MILLION)
                            TABLE 228 KINGDOM OF SAUDI ARABIA: MARKET SIZE, BY VERTICAL, 2019–2025 (USD MILLION)
                    9.5.3.3 Africa
                               9.5.3.3.1 South Africa
                                         TABLE 229 SOUTH AFRICA: FACIAL RECOGNITION MARKET SIZE, BY COMPONENT, 2014–2019 (USD MILLION)
                                         TABLE 230 SOUTH AFRICA: MARKET SIZE, BY COMPONENT, 2019–2025 (USD MILLION)
                                         TABLE 231 SOUTH AFRICA: MARKET SIZE, BY SOFTWARE TOOL, 2014–2019 (USD MILLION)
                                         TABLE 232 SOUTH AFRICA: MARKET SIZE, BY SOFTWARE TOOL, 2019–2025 (USD MILLION)
                                         TABLE 233 SOUTH AFRICA: MARKET SIZE, BY SERVICE, 2014–2019 (USD MILLION)
                                         TABLE 234 SOUTH AFRICA: MARKET SIZE, BY SERVICE, 2019–2025 (USD MILLION)
                                         TABLE 235 SOUTH AFRICA: MARKET SIZE, BY APPLICATION AREA, 2014–2019 (USD MILLION)
                                         TABLE 236 SOUTH AFRICA: MARKET SIZE, BY APPLICATION AREA, 2019–2025 (USD MILLION)
                                         TABLE 237 SOUTH AFRICA: MARKET SIZE, BY VERTICAL, 2014–2019 (USD MILLION)
                                         TABLE 238 SOUTH AFRICA: MARKET SIZE, BY VERTICAL, 2019–2025 (USD MILLION)
                               9.5.3.3.2 Rest of Middle East and Africa
                                         TABLE 239 REST OF MIDDLE EAST AND AFRICA: FACIAL RECOGNITION MARKET SIZE, BY COMPONENT, 2014–2019 (USD MILLION)
                                         TABLE 240 REST OF MIDDLE EAST AND AFRICA: MARKET SIZE, BY COMPONENT, 2019–2025 (USD MILLION)
                                         TABLE 241 REST OF MIDDLE EAST AND AFRICA: MARKET SIZE, BY SOFTWARE TOOL, 2014–2019 (USD MILLION)
                                         TABLE 242 REST OF MIDDLE EAST AND AFRICA: MARKET SIZE, BY SOFTWARE TOOL, 2019–2025 (USD MILLION)
                                         TABLE 243 REST OF MIDDLE EAST AND AFRICA: MARKET SIZE, BY SERVICE, 2014–2019 (USD MILLION)
                                         TABLE 244 REST OF MIDDLE EAST AND AFRICA: MARKET SIZE, BY SERVICE, 2019–2025 (USD MILLION)
                                         TABLE 245 REST OF MIDDLE EAST AND AFRICA: MARKET SIZE, BY APPLICATION AREA, 2014–2019 (USD MILLION)
                                         TABLE 246 REST OF MIDDLE EAST AND AFRICA: MARKET SIZE, BY APPLICATION AREA, 2019–2025 (USD MILLION)
                                         TABLE 247 REST OF MIDDLE EAST AND AFRICA: MARKET SIZE, BY VERTICAL, 2014–2019 (USD MILLION)
                                         TABLE 248 REST OF MIDDLE EAST AND AFRICA: MARKET SIZE, BY VERTICAL, 2019–2025 (USD MILLION)
    9.6 LATIN AMERICA
        FIGURE 29 LATIN AMERICA: MARKET SNAPSHOT
           9.6.1 LATIN AMERICA: MARKET DRIVERS
           9.6.2 LATIN AMERICA: COVID-19 IMPACT
           9.6.3 LATIN AMERICA: FACIAL RECOGNITION REGULATIONS
                 TABLE 249 LATIN AMERICA: FACIAL RECOGNITION MARKET SIZE, BY COMPONENT, 2014–2019 (USD MILLION)
                 TABLE 250 LATIN AMERICA: MARKET SIZE, BY COMPONENT, 2019–2025 (USD MILLION)
                 TABLE 251 LATIN AMERICA: MARKET SIZE, BY SOFTWARE TOOL, 2014–2019 (USD MILLION)
                 TABLE 252 LATIN AMERICA: MARKET SIZE, BY SOFTWARE TOOL, 2019–2025 (USD MILLION)
                 TABLE 253 LATIN AMERICA: MARKET SIZE, BY SERVICE, 2014–2019 (USD MILLION)
                 TABLE 254 LATIN AMERICA: MARKET SIZE, BY SERVICE, 2019–2025 (USD MILLION)
                 TABLE 255 LATIN AMERICA: MARKET SIZE, BY APPLICATION AREA, 2014–2019 (USD MILLION)
                 TABLE 256 LATIN AMERICA: MARKET SIZE, BY APPLICATION AREA, 2019–2025 (USD MILLION)
                 TABLE 257 LATIN AMERICA: MARKET SIZE, BY VERTICAL, 2014–2019 (USD MILLION)
                 TABLE 258 LATIN AMERICA: MARKET SIZE, BY VERTICAL, 2019–2025 (USD MILLION)
                 TABLE 259 LATIN AMERICA: MARKET, BY COUNTRY, 2014–2019 (USD MILLION)
                 TABLE 260 LATIN AMERICA: MARKET, BY COUNTRY, 2019–2025 (USD MILLION)
                    9.6.3.1 Mexico
                            TABLE 261 MEXICO: FACIAL RECOGNITION MARKET SIZE, BY COMPONENT, 2014–2019 (USD MILLION)
                            TABLE 262 MEXICO: MARKET SIZE, BY COMPONENT, 2019–2025 (USD MILLION)
                            TABLE 263 MEXICO: MARKET SIZE, BY SOFTWARE TOOL, 2014–2019 (USD MILLION)
                            TABLE 264 MEXICO: MARKET SIZE, BY SOFTWARE TOOL, 2019–2025 (USD MILLION)
                            TABLE 265 MEXICO: MARKET SIZE, BY SERVICE, 2014–2019 (USD MILLION)
                            TABLE 266 MEXICO: MARKET SIZE, BY SERVICE, 2019–2025 (USD MILLION)
                            TABLE 267 MEXICO: MARKET SIZE, BY APPLICATION AREA, 2014–2019 (USD MILLION)
                            TABLE 268 MEXICO: MARKET SIZE, BY APPLICATION AREA, 2019–2025 (USD MILLION)
                            TABLE 269 MEXICO: MARKET SIZE, BY VERTICAL, 2014–2019 (USD MILLION)
                            TABLE 270 MEXICO: MARKET SIZE, BY VERTICAL, 2019–2025 (USD MILLION)
                    9.6.3.2 Brazil
                            TABLE 271 BRAZIL: FACIAL RECOGNITION MARKET SIZE, BY COMPONENT, 2014–2019 (USD MILLION)
                            TABLE 272 BRAZIL: MARKET SIZE, BY COMPONENT, 2019–2025 (USD MILLION)
                            TABLE 273 BRAZIL: MARKET SIZE, BY SOFTWARE TOOL, 2014–2019 (USD MILLION)
                            TABLE 274 BRAZIL: MARKET SIZE, BY SOFTWARE TOOL, 2019–2025 (USD MILLION)
                            TABLE 275 BRAZIL: MARKET SIZE, BY SERVICE, 2014–2019 (USD MILLION)
                            TABLE 276 BRAZIL: MARKET SIZE, BY SERVICE, 2019–2025 (USD MILLION)
                            TABLE 277 BRAZIL: MARKET SIZE, BY APPLICATION AREA, 2014–2019 (USD MILLION)
                            TABLE 278 BRAZIL: MARKET SIZE, BY APPLICATION AREA, 2019–2025 (USD MILLION)
                            TABLE 279 BRAZIL: MARKET SIZE, BY VERTICAL, 2014–2019 (USD MILLION)
                            TABLE 280 BRAZIL: MARKET SIZE, BY VERTICAL, 2019–2025 (USD MILLION)
                    9.6.3.3 Rest of Latin America
                            TABLE 281 REST OF LATIN AMERICA: FACIAL RECOGNITION MARKET SIZE, BY COMPONENT, 2014–2019 (USD MILLION)
                            TABLE 282 REST OF LATIN AMERICA: MARKET SIZE, BY COMPONENT, 2019–2025 (USD MILLION)
                            TABLE 283 REST OF LATIN AMERICA: MARKET SIZE, BY SOFTWARE TOOL, 2014–2019 (USD MILLION)
                            TABLE 284 REST OF LATIN AMERICA: MARKET SIZE, BY SOFTWARE TOOL, 2019–2025 (USD MILLION)
                            TABLE 285 REST OF LATIN AMERICA: MARKET SIZE, BY SERVICE, 2014–2019 (USD MILLION)
                            TABLE 286 REST OF LATIN AMERICA: MARKET SIZE, BY SERVICE, 2019–2025 (USD MILLION)
                            TABLE 287 REST OF LATIN AMERICA: MARKET SIZE, BY APPLICATION AREA, 2014–2019 (USD MILLION)
                            TABLE 288 REST OF LATIN AMERICA: MARKET SIZE, BY APPLICATION AREA, 2019–2025 (USD MILLION)
                            TABLE 289 REST OF LATIN AMERICA: MARKET SIZE, BY VERTICAL, 2014–2019 (USD MILLION)
                            TABLE 290 REST OF LATIN AMERICA: MARKET SIZE, BY VERTICAL, 2019–2025 (USD MILLION)

10 COMPETITIVE LANDSCAPE (Page No. - 229)
     10.1 OVERVIEW
     10.2 MARKET EVALUATION FRAMEWORK
          FIGURE 30 MARKET EVALUATION FRAMEWORK: 2018, 2019, AND 2020 WITNESSED FACIAL RECOGNITION MARKET EXPANSION AND CONSOLIDATION
             10.2.1 NEW PRODUCT LAUNCHES/DEVELOPMENTS
                    TABLE 291 NEW PRODUCT LAUNCHES/DEVELOPMENTS, 2018–2020
             10.2.2 PARTNERSHIPS/AGREEMENTS/COLLABORATIONS
                    TABLE 292 PARTNERSHIPS, AGREEMENTS, AND COLLABORATIONS, 2018–2020
             10.2.3 ACQUISITIONS
                    TABLE 293 ACQUISITIONS, 2018–2020
             10.2.4 BUSINESS EXPANSIONS
                    TABLE 294 BUSINESS EXPANSIONS, 2018–2020
     10.3 MARKET REVENUE ANALYSIS
          FIGURE 31 THREE-YEAR REVENUE ANALYSIS OF KEY PUBLIC LISTED COMPANIES
     10.4 COMPETITIVE LEADERSHIP MAPPING
          TABLE 295 EVALUATION CRITERIA
             10.4.1 STAR
             10.4.2 EMERGING LEADERS
             10.4.3 PERVASIVE
                    FIGURE 32 FACIAL RECOGNITION MARKET (GLOBAL), COMPETITIVE LEADERSHIP MAPPING, 2020
     10.5 COMPETITIVE LEADERSHIP MAPPING, FOR STARTUPS
             10.5.1 PROGRESSIVE COMPANIES
             10.5.2 RESPONSIVE COMPANIES
             10.5.3 DYNAMIC COMPANIES
             10.5.4 STARTING BLOCKS
                    FIGURE 33 MARKET (GLOBAL), COMPETITIVE LEADERSHIP MAPPING, FOR STARTUPS, 2020
     10.6 MARKET SHARE OF KEY PLAYERS IN MARKET
          FIGURE 34 FACIAL RECOGNITION MARKET (GLOBAL), MARKET SHARE, 2019

11 COMPANY PROFILES (Page No. - 245)
     11.1 INTRODUCTION
(Business overview, Products offered, Recent Developments, SWOT analysis, MNM view)*
     11.2 NEC
          FIGURE 35 NEC: COMPANY SNAPSHOT
     11.3 AWARE
          FIGURE 36 AWARE: COMPANY SNAPSHOT
     11.4 THALES E-SECURITY
          FIGURE 37 THALES E-SECURITY: COMPANY SNAPSHOT
     11.5 NUANCE COMMUNICATIONS
          FIGURE 38 NUANCE COMMUNICATIONS: COMPANY SNAPSHOT
     11.6 MICROSOFT
          FIGURE 39 MICROSOFT: COMPANY SNAPSHOT
     11.7 AMAZON
          FIGURE 40 AMAZON: COMPANY SNAPSHOT
     11.8 GEMALTO (ACQUIRED BY THALES)
          FIGURE 41 GEMALTO: COMPANY SNAPSHOT
     11.9 AYONIX
     11.10 IDEMIA
     11.11 COGNITEC SYSTEMS
     11.12 DAON
     11.13 NVISO
     11.14 STEREOVISION IMAGING
     11.15 TECHNOBRAIN
     11.16 NEUROTECHNOLOGY
     11.17 INNOVATRICS
     11.18 ID3 TECHNOLOGIES
     11.19 ANIMETRICS
     11.20 MEGVII (FACE++)
     11.21 FACEFIRST
     11.22 SIGHTCORP
     11.23 FACEPHI
     11.24 HERTA SECURITY
     11.25 KAIROS
     11.26 BIOID
     11.27 FULCRUM BIOMETRICS
     11.28 TRUEFACE.AI

*Details on Business overview, Products offered, Recent Developments, SWOT analysis, MNM view might not be captured in case of unlisted companies.

12 ADJACENT MARKETS (Page No. - 287)
     12.1 INTRODUCTION TO ADJACENT MARKETS
          TABLE 296 ADJACENT MARKETS AND FORECASTS
     12.2 LIMITATIONS
     12.3 FACIAL RECOGNITION MARKET ECOSYSTEM AND ADJACENT MARKETS
     12.4 IMAGE RECOGNITION MARKET
          TABLE 297 IMAGE RECOGNITION MARKET SIZE, BY TECHNOLOGY, 2014–2021 (USD MILLION)
          TABLE 298 IMAGE RECOGNITION MARKET SIZE, BY COMPONENT, 2014–2021(USD MILLION)
          TABLE 299 IMAGE RECOGNITION MARKET SIZE, BY APPLICATION MODE, 2014–2021 (USD MILLION)
          TABLE 300 IMAGE RECOGNITION MARKET SIZE, BY DEPLOYMENT MODE, 2014–2021(USD MILLION)
          TABLE 301 IMAGE RECOGNITION MARKET SIZE, BY VERTICAL, 2014–2021 (USD MILLION)
          TABLE 302 BFSI: IMAGE RECOGNITION MARKET SIZE, BY REGION, 2014–2021(USD MILLION)
          TABLE 303 MEDIA AND ENTERTAINMENT: IMAGE RECOGNITION MARKET SIZE, BY REGION, 2014–2021(USD MILLION)
          TABLE 304 RETAIL AND CONSUMER GOODS: IMAGE RECOGNITION MARKET SIZE, BY REGION, 2014–2021 (USD MILLION)
          TABLE 305 IT AND TELECOM: IMAGE RECOGNITION MARKET SIZE, BY REGION, 2014–2021 (USD MILLION)
          TABLE 306 GOVERNMENT: IMAGE RECOGNITION MARKET SIZE, BY REGION, 2014–2021(USD MILLION)
          TABLE 307 HEALTHCARE: IMAGE RECOGNITION MARKET SIZE, BY REGION, 2014–2021(USD MILLION)
          TABLE 308 TRANSPORTATION AND LOGISTICS: IMAGE RECOGNITION MARKET SIZE, BY REGION, 2014–2021(USD MILLION)
          TABLE 309 OTHERS: IMAGE RECOGNITION MARKET SIZE, BY REGION, 2014–2021(USD MILLION)
     12.5 EMOTION DETECTION AND RECOGNITION MARKET
             12.5.1 ADJACENT MARKET: EMOTION DETECTION AND RECOGNITION MARKET, BY TECHNOLOGY
                    TABLE 310 EMOTION DETECTION AND RECOGNITION MARKET SIZE, BY TECHNOLOGY, 2017–2024 (USD MILLION)
             12.5.2 ADJACENT MARKET: EMOTION DETECTION AND RECOGNITION MARKET, BY APPLICATION AREA
                    TABLE 311 EMOTION DETECTION AND RECOGNITION MARKET SIZE, BY APPLICATION AREA, 2017–2024 (USD MILLION)
             12.5.3 ADJACENT MARKET: EMOTION DETECTION AND RECOGNITION MARKET, BY SOFTWARE TOOL
                    TABLE 312 EMOTION DETECTION AND RECOGNITION MARKET SIZE, BY SOFTWARE TOOL, 2017–2024 (USD MILLION)
             12.5.4 ADJACENT MARKET: EMOTION DETECTION AND RECOGNITION MARKET, BY END USER
                    TABLE 313 EMOTION DETECTION AND RECOGNITION MARKET SIZE, BY END USER, 2017–2024 (USD MILLION)
             12.5.5 ADJACENT MARKET: EMOTION DETECTION AND RECOGNITION MARKET, BY REGION
                    TABLE 314 EMOTION DETECTION AND RECOGNITION MARKET SIZE, BY REGION,  2017–2024 (USD MILLION)
                    TABLE 315 NORTH AMERICA: EMOTION DETECTION AND RECOGNITION MARKET SIZE, BY TECHNOLOGY, 2017–2024 (USD MILLION)
                    TABLE 316 NORTH AMERICA: FEATURE EXTRACTION AND 3D MODELING MARKET SIZE, BY COUNTRY, 2017–2024 (USD MILLION)
                    TABLE 317 NORTH AMERICA: BIOSENSORS TECHNOLOGY MARKET SIZE, BY COUNTRY, 2017–2024 (USD MILLION)
                    TABLE 318 NORTH AMERICA: NATURAL LANGUAGE PROCESSING MARKET SIZE, BY COUNTRY, 2017–2024 (USD MILLION)
                    TABLE 319 NORTH AMERICA: MACHINE LEARNING MARKET SIZE, BY COUNTRY, 2017–2024 (USD MILLION)
                    TABLE 320 NORTH AMERICA: OTHER TECHNOLOGIES MARKET SIZE, BY COUNTRY, 2017–2024 (USD MILLION)
                    TABLE 321 NORTH AMERICA: EMOTION DETECTION AND RECOGNITION MARKET SIZE, BY SOFTWARE TOOL, 2017–2024 (USD MILLION)
                    TABLE 322 NORTH AMERICA: FACIAL EXPRESSION RECOGNITION MARKET SIZE, BY COUNTRY, 2017–2024 (USD MILLION)
                    TABLE 323 NORTH AMERICA: BIOSENSING SOFTWARE TOOLS AND APPS MARKET SIZE, BY COUNTRY, 2017–2024 (USD MILLION)
                    TABLE 324 NORTH AMERICA: SPEECH AND VOICE RECOGNITION MARKET SIZE, BY COUNTRY, 2017–2024 (USD MILLION)
                    TABLE 325 NORTH AMERICA: GESTURE AND POSTURE RECOGNITION MARKET SIZE, BY COUNTRY, 2017–2024 (USD MILLION)
                    TABLE 326 NORTH AMERICA: EMOTION DETECTION AND RECOGNITION MARKET SIZE, BY APPLICATION AREA, 2017–2024 (USD MILLION)
                    TABLE 327 NORTH AMERICA: MEDICAL EMERGENCY MARKET SIZE, BY COUNTRY, 2017–2024 (USD MILLION)
                    TABLE 328 NORTH AMERICA: MARKETING AND ADVERTISING MARKET SIZE,  BY COUNTRY, 2017–2024 (USD MILLION)
                    TABLE 329 NORTH AMERICA: LAW ENFORCEMENT, SURVEILLANCE, AND MONITORING MARKET SIZE, BY COUNTRY, 2017–2024 (USD MILLION)
                    TABLE 330 NORTH AMERICA: ENTERTAINMENT AND CONSUMER ELECTRONICS MARKET SIZE, BY COUNTRY, 2017–2024 (USD MILLION)
                    TABLE 331 NORTH AMERICA: OTHER APPLICATION AREAS MARKET SIZE, BY COUNTRY, 2017–2024 (USD MILLION)
                    TABLE 332 NORTH AMERICA: EMOTION DETECTION AND RECOGNITION MARKET SIZE, BY END USER, 2017–2024 (USD MILLION)
                    TABLE 333 NORTH AMERICA: ENTERPRISES MARKET SIZE, BY COUNTRY, 2017–2024 (USD MILLION)
                    TABLE 334 NORTH AMERICA: DEFENSE AND SECURITY AGENCY MARKET SIZE, BY COUNTRY, 2017–2024 (USD MILLION)
                    TABLE 335 NORTH AMERICA: COMMERCIAL MARKET SIZE, BY COUNTRY, 2017–2024 (USD MILLION)
                    TABLE 336 NORTH AMERICA: INDUSTRIAL MARKET SIZE, BY COUNTRY, 2017–2024 (USD MILLION)
                    TABLE 337 NORTH AMERICA: OTHER END USERS MARKET SIZE, BY COUNTRY, 2017–2024 (USD MILLION)
                    TABLE 338 EUROPE: EMOTION DETECTION AND RECOGNITION MARKET SIZE, BY END USER, 2017–2024 (USD MILLION)
                    TABLE 339 ASIA PACIFIC: EMOTION DETECTION AND RECOGNITION MARKET SIZE, BY TECHNOLOGY, 2017–2024 (USD MILLION)
                    TABLE 340 ASIA PACIFIC: EMOTION DETECTION AND RECOGNITION MARKET SIZE, BY SOFTWARE TOOL, 2017–2024 (USD MILLION)
                    TABLE 341 ASIA PACIFIC: EMOTION DETECTION AND RECOGNITION MARKET SIZE, BY APPLICATION AREA, 2017–2024 (USD MILLION)
                    TABLE 342 ASIA PACIFIC: EMOTION DETECTION AND RECOGNITION MARKET SIZE, BY END USER, 2017–2024 (USD MILLION)
                    TABLE 343 MIDDLE EAST AND AFRICA: EMOTION DETECTION AND RECOGNITION MARKET SIZE, BY TECHNOLOGY, 2017–2024 (USD MILLION)
                    TABLE 344 MIDDLE EAST AND AFRICA: EMOTION DETECTION AND RECOGNITION MARKET SIZE, BY SOFTWARE TOOL, 2017–2024 (USD MILLION)
                    TABLE 345 MIDDLE EAST AND AFRICA: EMOTION DETECTION AND RECOGNITION MARKET SIZE, BY APPLICATION AREA, 2017–2024 (USD MILLION)
                    TABLE 346 MIDDLE EAST AND AFRICA: EMOTION DETECTION AND RECOGNITION MARKET SIZE, BY END USER, 2017–2024 (USD MILLION)
                    TABLE 347 LATIN AMERICA: EMOTION DETECTION AND RECOGNITION MARKET SIZE, BY TECHNOLOGY, 2017–2024 (USD MILLION)
                    TABLE 348 LATIN AMERICA: EMOTION DETECTION AND RECOGNITION MARKET SIZE, BY SOFTWARE TOOL, 2017–2024 (USD MILLION)
                    TABLE 349 LATIN AMERICA: EMOTION DETECTION AND RECOGNITION MARKET SIZE, BY APPLICATION AREA, 2017–2024 (USD MILLION)
                    TABLE 350 LATIN AMERICA: EMOTION DETECTION AND RECOGNITION MARKET SIZE, BY END USER, 2017–2024 (USD MILLION)

13 APPENDIX (Page No. - 307)
     13.1 DISCUSSION GUIDE
     13.2 KNOWLEDGE STORE: MARKETSANDMARKETS’ SUBSCRIPTION PORTAL
     13.3 AVAILABLE CUSTOMIZATIONS
     13.4 RELATED REPORTS
     13.5 AUTHOR DETAILS

The study involved major activities in estimating the current market size for the facial recognition market. An exhaustive secondary research was done to collect information on the facial recognition industry. The next step was to validate these findings, assumptions, and sizing with industry experts across the value chain using primary research. Different approaches like Top-down, bottom up were employed to estimate the total market size. After that, the market breakup and data triangulation procedures were used to estimate the market size of the segments and sub segments of the facial recognition market.

Secondary Research

In the secondary research process, various secondary sources were referred to, for identifying and collecting information regarding the study. The secondary sources included annual reports, press releases, investor presentations of facial recognition solutions and service vendors, forums, certified publications, and whitepapers. The secondary research was mainly used to obtain key information about the industry’s supply chain, the total pool of key players, market classification and segmentation according to industry trends to the bottom-most level, regional markets, and key developments from both market- and technology-oriented perspectives, all of which were further validated by primary sources. Factors considered for estimating the facial recognition market size are Gross Domestic Product (GDP) growth, Recent market developments, Technology adoption rates, Market share analysis of major facial recognition solution providers, and COVID-19 impact on the economy, and facial recognition industry.

Primary Research

In the primary research process, various primary sources from both supply and demand sides were interviewed to obtain qualitative and quantitative information for the facial recognition market. The primary sources from the supply side included various industry experts, including Chief Executive Officers (CEOs), Vice Presidents (VPs), marketing directors, technology and innovation directors, and related key executives from various key companies and organizations operating in the facial recognition market.

Facial Recognition Market Size, and Share

To know about the assumptions considered for the study, download the pdf brochure

Facial Recognition Market Size Estimation

In the market engineering process, top-down and bottom-up approaches were extensively used, along with several data triangulation methods, to perform the market estimation and market forecasting for the overall market segments and sub segments listed in this report. Extensive qualitative and quantitative analysis was performed on the complete market engineering process to list key information/insights throughout the report. The research methodology used to estimate the market size included the following details: the key players in the market were identified through secondary research, and their revenue contribution in respective regions were determined through primary and secondary research. This entire procedure included the study of the annual and financial reports of top market players and extensive interviews for key insights from industry leaders, such as CEOs, VPs, directors, and marketing executives. All percentage splits and breakups were determined using secondary sources and verified through primary sources. All the possible parameters that affect the market are covered in this research study have been accounted for, viewed in extensive detail, verified through primary research, and analyzed to get the final quantitative and qualitative data. This data is consolidated and added to detailed inputs and analysis from MarketsandMarkets.

Data Triangulation

After arriving at the overall facial recognition market size using the market size estimation processes as explained above, the market was split into several segments and subsegments. The data triangulation and market breakup procedures were employed, wherever applicable, to complete the overall market engineering process and arrive at the exact statistics of each market segment and subsegments. The data was triangulated by studying various factors and trends from both the demand and supply sides.

Report Objectives

  • To define, describe, and forecast the facial recognition market by type, by component, by deployment, by organization size, by vertical and by region
  • To provide detailed information about the major factors (drivers, restraints, opportunities, and challenges) influencing the growth of the facial recognition market
  • To analyse micro markets with respect to individual growth trends, prospects, and contributions to the total market
  • To analyse opportunities in the market for stakeholders by identifying high-growth segments of the facial recognition market
  • To forecast the size of the market segments with respect to five main regions: North America, Europe, Asia Pacific (APAC), Middle East and Africa (MEA), and Latin America
  • To profile key players of the facial recognition market and comprehensively analyse their market share and core competencies
  • To track and analyse competitive developments, such as new product launches and enhancements; acquisitions; and partnerships and collaborations, in the facial recognition market

Available customizations

Along with the market data, MarketsandMarkets offers customizations as per the company’s specific needs. The following customization options are available for the report:

Geographic analysis

  • Further breakup of the North America facial recognition market into countries
  • Further breakup of the Europe facial recognition market into countries
  • Further breakup of the APAC facial recognition market into countries
  • Further breakup of the MEA facial recognition market into countries
  • Further breakup of the Latin America facial recognition market into countries

Company information

  • Detailed analysis and profiling of additional market players
Custom Market Research Services

We will customize the research for you, in case the report listed above does not meet with your exact requirements. Our custom research will comprehensively cover the business information you require to help you arrive at strategic and profitable business decisions.

Request Customization
Report Code
TC 3421
Published ON
Dec, 2020
Choose License Type
BUY NOW
  • SHARE
X
Request Customization
Speak to Analyst
Speak to Analyst
OR FACE-TO-FACE MEETING
PERSONALIZE THIS RESEARCH
  • Triangulate with your Own Data
  • Get Data as per your Format and Definition
  • Gain a Deeper Dive on a Specific Application, Geography, Customer or Competitor
  • Any level of Personalization
REQUEST A FREE CUSTOMIZATION
LET US HELP YOU!
  • What are the Known and Unknown Adjacencies Impacting the Facial Recognition Market
  • What will your New Revenue Sources be?
  • Who will be your Top Customer; what will make them switch?
  • Defend your Market Share or Win Competitors
  • Get a Scorecard for Target Partners
CUSTOMIZED WORKSHOP REQUEST
+1-888-600-6441
  • Call Us
  • +1-888-600-6441 (Corporate office hours)
  • +1-888-600-6441 (US/Can toll free)
  • +44-800-368-9399 (UK office hours)
CONNECT WITH US
ABOUT TRUST ONLINE
©2023 MarketsandMarkets Research Private Ltd. All rights reserved
DMCA.com Protection Status Website Feedback