In-flight Entertainment & Connectivity Market Size, Share and Trends by Offering (IF Entertainment. IF Connectivity), Class (First, Business, Premium Economy, Economy), Platform (Narrow-body Aircraft, Wide-body Aircraft, Business Jet), End Use - Global Forecast to 2031

icon1
USD 13.20 BN
MARKET SIZE, 2031
icon2
CAGR 6.8%
(2026-2031)
icon3
300
REPORT PAGES
icon4
200
MARKET TABLES

IN-FLIGHT ENTERTAINMENT & CONNECTIVITY MARKET OVERVIEW

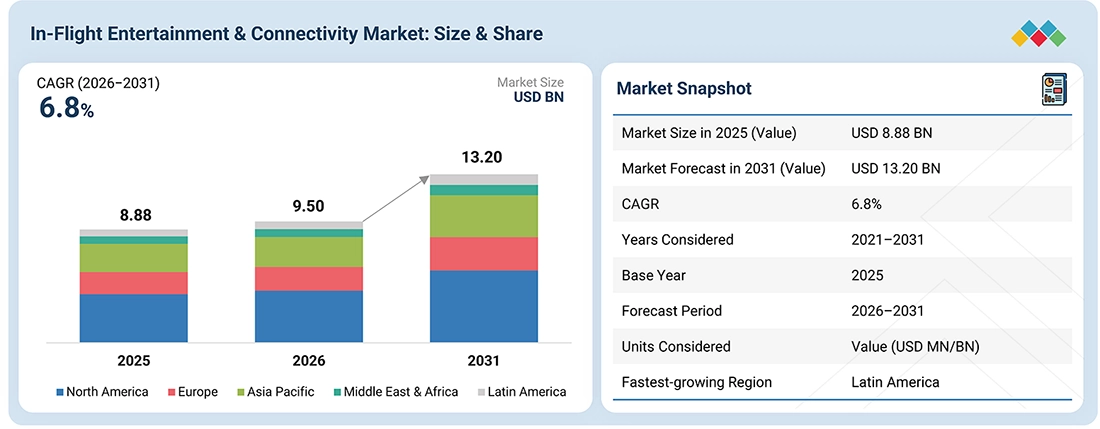
According to Marketsandmarkets, The global In-flight Entertainment and Connectivity (IFEC) Market size was valued at USD 9.50 billion in 2026 and is projected to reach USD 13.20 billion by 2031, growing at a CAGR of 6.8 % from 2026 to 2031. This growth is driven by increasing passenger need for digital entertainment and reliable onboard connectivity. Global passenger demand increased 5.3% in 2025, while 77% of passengers surveyed by Viasat considered in-flight Wi-Fi important. Airlines are therefore expanding high-speed connectivity and integrating Wi-Fi with streaming entertainment, personalized content, and other digital services. The deployment of satellite and hybrid connectivity solutions across aircraft fleets is further supporting demand for IFEC solutions.

REPORT SCOPE

REPORT METRIC DETAILS
Market Size in 2025 (Value) USD 8.88 Billion
Market Size in 2026 (Value) USD 9.50 Billion
Market Forecast in 2031 (Value) USD 13.20 Billion
Growth Rate CAGR of 6.8% from 2026 to 2031
Years Considered 2021–2031
Base Year 2025
Forecast Period 2026–2031
Units Considered USD Billion
Report Coverage Revenue Forecast, Company Ranking, Competitive Landscape, Growth Factors, and Trends
Top Companies
  • Panasonic Corporation of North America (US)
  • Thales (France)
  • Anuvu (US)
  • RTX (US)
  • Astronics Corporation (US)
Growth Drivers
  • Rapid adoption of personal devices and passenger demand for connected experiences
  • Expansion of satellite, LEO, and hybrid connectivity solutions across aircraft fleets
  • Growing integration of cloud based and software driven IFEC platforms
  • Increasing airline investment in premium and personalized passenger experiences
  • Growing aircraft deliveries and factory installed IFEC systems through the OEM channel
Segments Covered
  • By Offering:
    • In-Flight Entertainment
    • In-Flight Connectivity
  • By End Use:
    • OEM
    • Aftermarket
  • By Platform:
    • Narrow-Body Aircraft
    • Wide-Body Aircraft
    • Business Jets
  • By Class:
    • First Class
    • Business Class
    • Premium Class
    • Economy
Regions Covered North America, Europe, Asia Pacific, Middle East & Africa, Latin America

KEY TAKEAWAYS

  • By Region
    Latin America is projected to have the highest CAGR during the forecast period.
  • By Offering
    By offering, in-flight entertainment is set to experience a high growth rate of 7.1% during the forecast period.
  • By End Use
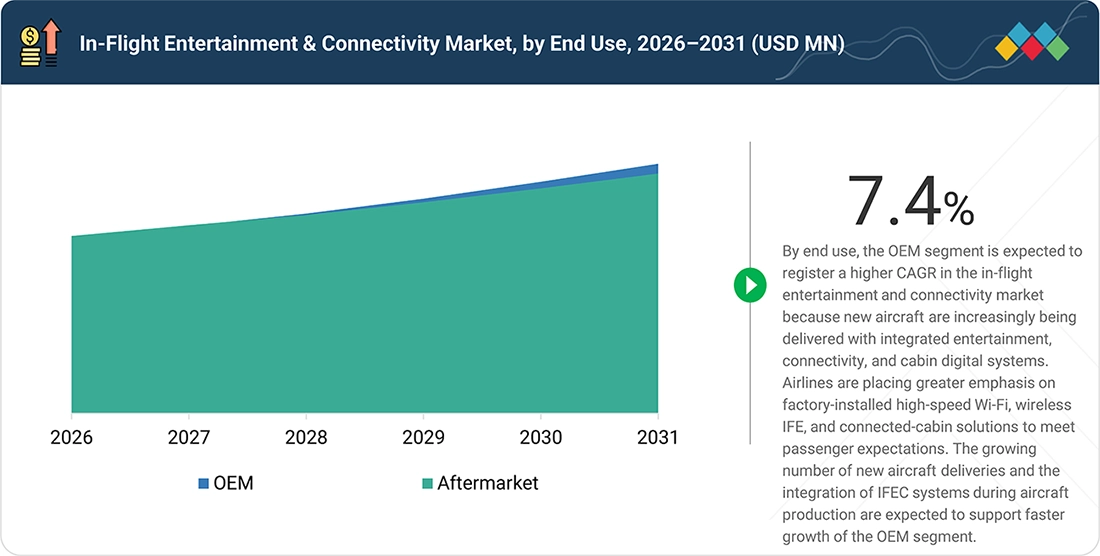
    By end use, the OEM segment is set to experience a high growth rate of 7.4% during the forecast period.
  • By Platform
    By platform, narrow-body aircraft hold a dominant market share during the forecast period.
  • By Class
    By class, the business class segment holds the largest market share.
  • Competitive Landscape - Key Players
    Panasonic Avionics Corporation(US), Thales (France), and Anuvu (US) were identified as some of the star players in the IFEC market, given their strong market share and product footprint.
  • Competitive Landscape - Startups/SMEs
    Eutelsat Communication SA has identified itself among SMEs by securing strong footholds in specialized niche areas, underscoring its potential as an emerging market leader.

Growth in the In-flight Entertainment & Connectivity Industry is supported by airlines upgrading and improving internet connectivity, onboard entertainment systems, and offering more digital services. Demand is driven by the increasing use of personal devices, the need for reliable in-flight internet, and increasing passenger expectations for easy access to entertainment and online services. The adoption of satellite-based and hybrid connectivity solutions, along with onboard retail and advertising, is further helping the growth of the market.
in-flight-entertainment-communications-market Overview

Source: Secondary Research, Interviews with Experts, MarketsandMarkets Analysis

TRENDS & DISRUPTIONS IMPACTING CUSTOMERS' CUSTOMERS

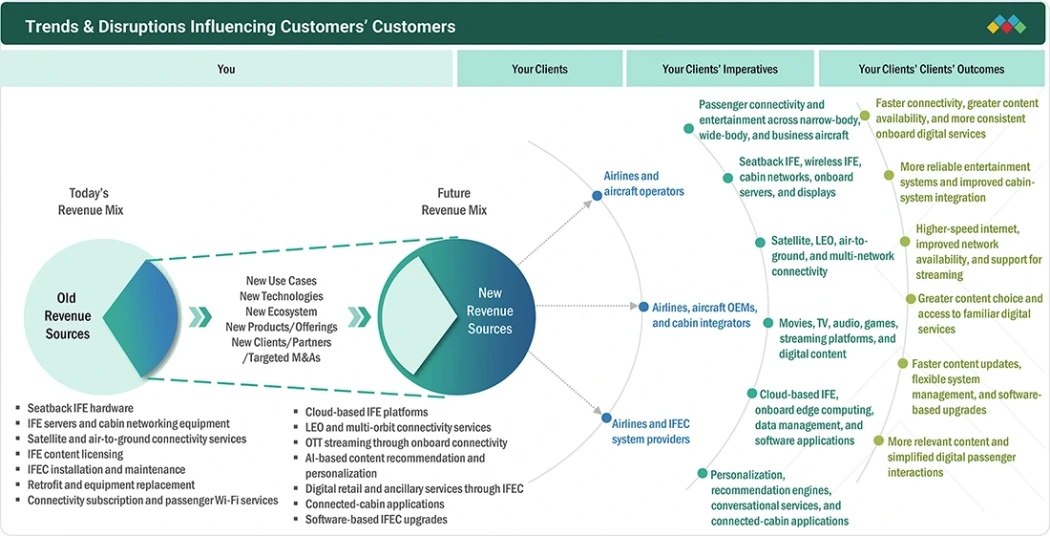
The In-flight entertainment and connectivity market is increasingly influenced by airlines and aircraft operators shifting from traditional, hardware-focused IFE systems toward connected and software-enabled passenger experiences. Historically, the market relied heavily on seatback IFE hardware, content licensing, installation, and maintenance, while newer revenue opportunities are emerging through cloud-based IFE platforms, high-speed connectivity, software upgrades, digital retail, and connected-cabin applications. Demand is being shaped by passengers' growing use of personal devices and expectations for reliable Wi-Fi, streaming, and personalized digital services. At the same time, airlines and aircraft OEMs are moving toward satellite-based, LEO, multi-orbit, and hybrid connectivity solutions to improve speed and coverage. Open digital platforms and AI-based personalization are also creating opportunities to deliver more relevant content, targeted retail and advertising, and connected-cabin services. These changes are shifting the market toward more flexible, connected, and software-driven systems, with airlines, aircraft OEMs, cabin integrators, and IFEC providers becoming increasingly important across the value chain.
in-flight-entertainment-communications-market Disruptions

Source: Secondary Research, Interviews with Experts, MarketsandMarkets Analysis

MARKET DYNAMICS

Drivers
Impact
Level
  • Rising trend of bring your own device among passengers
  • Rising shift toward cloud services
RESTRAINTS
Impact
Level
  • Stringent data privacy regulations
  • Bandwidth limitations
OPPORTUNITIES
Impact
Level
  • Growing collaborations between airlines and content platforms
  • Rising interest in exclusive in-flight offers
CHALLENGES
Impact
Level
  • Complexity of securing content licensing rights for in-flight streaming
  • High cost of installation and integration

Source: Secondary Research, Interviews with Experts, MarketsandMarkets Analysis

Driver: Rising trend of bring your own device among the passengers

The IFEC market is benefiting from the growing use of passengers' personal devices during flights. Viasat reports that 97% of passengers use personal devices in the air, increasing demand for Wi-Fi, streaming, and device-based entertainment. This is encouraging airlines to support personal-device connectivity alongside traditional seatback systems.

Restraint: Stringent data privacy regulations

The IFEC market has data privacy requirements as connected services increasingly collect and process passenger information. Regulations such as the EU GDPR require organizations to follow rules on consent, storage, data minimization, transparency, and security. These requirements can add issues when airlines use data for advertising, personalization, and digital services.

Opportunity: Growing collaborations between airlines and content platforms

The IFEC market has opportunities through collaborations between airlines, IFEC providers, and content platforms. Recent collaborations are enabling airlines to provide streaming services, personalized entertainment, and content across seatback systems and passengers’ personal devices. Such deals can also support continuously updated content and new digital passenger services.

Challenge: Complexity of securing content licensing rights for in-flight streaming

The IFEC market faces issues in obtaining and managing content rights for streaming in aircraft and geographic markets. Airlines and content providers need rights-cleared programming that can be distributed through personal devices and onboard systems. The development of aviation-specific streaming platforms such as BBC Player with Panasonic Avionics highlights the need for dedicated rights-cleared content solutions.

IN-FLIGHT ENTERTAINMENT & CONNECTIVITY MARKET: COMMERCIAL USE CASES ACROSS INDUSTRIES

COMPANY USE CASE DESCRIPTION BENEFITS
company logo
Panasonic Avionics provides in-flight entertainment and connectivity solutions that combine seatback entertainment, onboard Wi-Fi, satellite connectivity, and digital passenger services. Its systems support multi-orbit connectivity using 5G, LEO, and GEO networks and allow airlines to manage content, connectivity packages, and onboard services. Improves passenger connectivity | Supports high-speed onboard internet | Enables flexible content and service management | Supports personalized digital passenger experiences
company logo
Thales provides in-flight entertainment and connectivity systems that combine IFE, high-speed connectivity, content management, and passenger applications. Its FlyEDGE platform uses cloud-hosted architecture and onboard edge computing to support entertainment applications, remote fleet management, and passenger engagement data. Enables connected passenger experiences | Supports flexible entertainment applications | Improves remote content and system management | Provides passenger engagement information
company logo
Safran developed RAVE In-Flight Entertainment and Connectivity solutions that support seatback and wireless entertainment, personal-device casting, cloud-based content distribution, and onboard edge computing. RAVE Cloud Services enables airlines to distribute content to aircraft through satellite, cellular, Wi-Fi, and other available pathways. Supports personal-device entertainment | Enables faster content distribution | Reduces dependence on additional onboard hardware | Supports flexible and scalable IFEC services

Logos and trademarks shown above are the property of their respective owners. Their use here is for informational and illustrative purposes only.

MARKET ECOSYSTEM

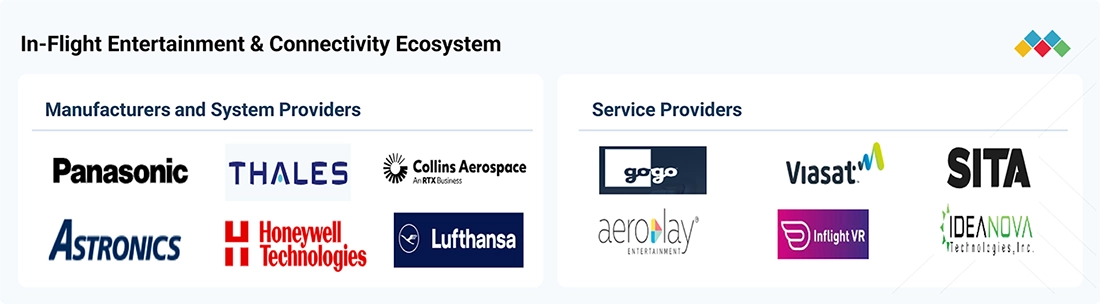
The in-flight entertainment and connectivity market ecosystem consists of manufacturers and system providers, service providers, airlines, aircraft operators, and technology and content partners that contribute to the development, integration, deployment, and delivery of onboard entertainment and connectivity solutions. Prominent manufacturers and system providers such as Panasonic Avionics Corporation, Thales, Collins Aerospace, Astronics Corporation, Honeywell International Inc., Lufthansa Technik, Bluebox Aviation Systems Ltd., AERQ, ECA Group, and Immfly provide in-flight entertainment systems, connectivity equipment, cabin networking, content platforms, and related software and hardware. Service providers such as Anuvu, Viasat Inc., Gogo Business Aviation LLC, SITA, Iridium Communications Inc., Eutelsat Communications SA, Inflight VR, IdeaNova Technologies, SmartSky Networks LLC, AeroPlay Entertainment, and Spafax contribute satellite and air-to-ground connectivity, content delivery, digital entertainment, passenger applications, and media services. Airlines and aircraft operators use these capabilities to provide onboard internet, streaming and stored entertainment, digital services, retail, advertising, and connected-cabin applications, while maintenance and integration providers support installation, retrofit, certification, and system upgrades. This ecosystem is supporting the continued transition of the IFEC market from traditional hardware-based IFE toward wireless, connected, cloud-enabled, and software-driven passenger services.
in-flight-entertainment-communications-market Ecosystem

Logos and trademarks shown above are the property of their respective owners. Their use here is for informational and illustrative purposes only.

MARKET SEGMENTS
in-flight-entertainment-communications-market Segments

Source: Secondary Research, Interviews with Experts, MarketsandMarkets Analysis

In-Flight Entertainment and Connectivity Market, By Offering

The in-flight entertainment segment is expected to account for the largest share of the IFEC market, which is supported by continued airline investment in modern entertainment systems and digital passenger services. Rising passenger expectations for on-demand movies, TV, music, games, and access through personal devices are increasing demand for advanced IFE solutions. The shift toward wireless and personalized entertainment is further supporting the segment’s position.

In-Flight Entertainment and Connectivity Market, By End Use

The OEM segment is expected to account for the largest share of the IFEC market, supported by the increasing installation of IFEC systems during aircraft manufacturing. Airlines increasingly prefer aircraft delivered with integrated connectivity, entertainment, cabin networking, and digital passenger systems to reduce later modification requirements. The growing delivery of new aircraft equipped with factory-installed IFEC solutions is therefore supporting the strong position of the OEM segment.

In-Flight Entertainment and Connectivity Market, By Platform

The narrow-body aircraft segment is expected to register the highest CAGR in the IFEC market, supported by the growing use of narrow-body aircraft on short- and medium-haul routes. Airlines are increasingly equipping these aircraft with wireless IFE, high-speed Wi-Fi, and personal-device connectivity to improve the passenger experience. The large and expanding narrow-body fleet, combined with increasing deployment of connectivity systems on single-aisle aircraft, is expected to support strong segment growth.

In-Flight Entertainment and Connectivity Market, By Class

The business class segment is set to register the highest CAGR in the IFEC market supported by increasing airline investment in premium cabin experiences. Business class passengers have higher expectations for high-speed connectivity, premium entertainment, personal-device connectivity and personalized digital services. Airlines are therefore upgrading business class cabins with advanced IFE, reliable Wi-Fi, larger displays, and connected-cabin services. The growing focus on premium travel and cabin modernization is supporting the need for IFEC solutions in business class.

REGION

Latin America to be the fastest-growing region in the in-flight entertainment and connectivity market during the forecast period

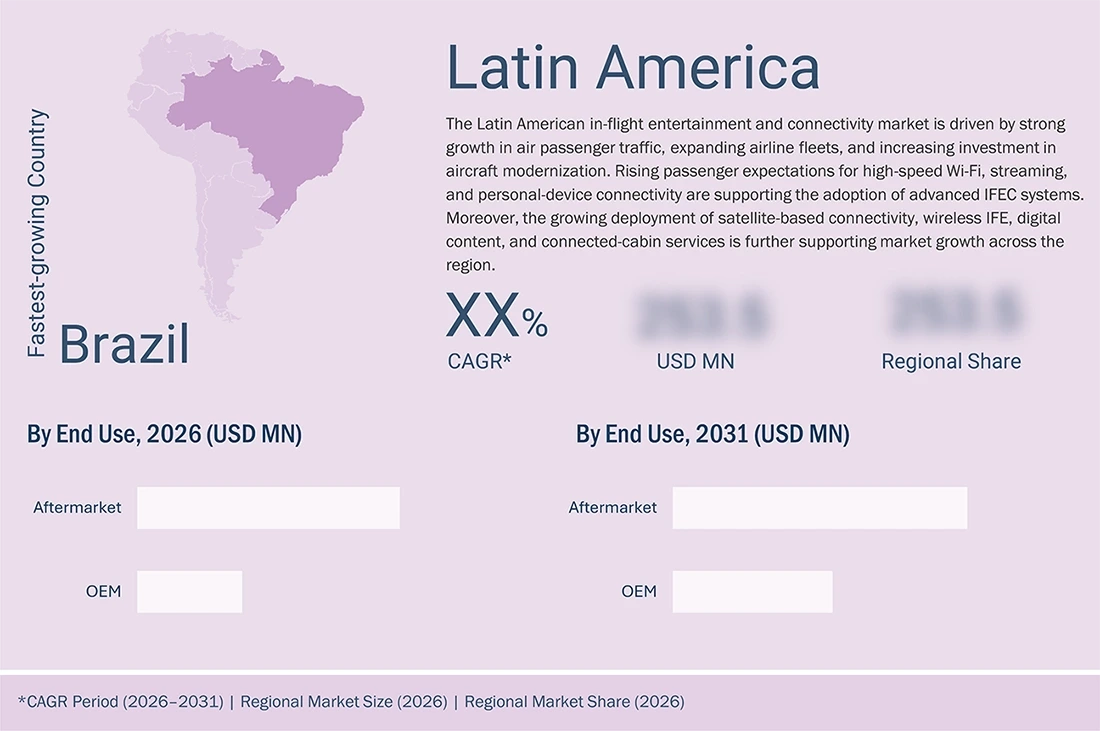
Latin America is expected to register the highest CAGR in the IFEC market, supported by strong growth in passenger traffic and airline capacity across the region. Increasing international and domestic air travel is encouraging airlines to invest in onboard connectivity, wireless entertainment, and digital passenger services. Rising passenger expectations for reliable Wi-Fi, streaming, and personal-device connectivity, along with the modernization of existing aircraft, are further supporting the adoption of IFEC solutions across Latin America.
in-flight-entertainment-communications-market Region

IN-FLIGHT ENTERTAINMENT & CONNECTIVITY MARKET: COMPANY EVALUATION MATRIX

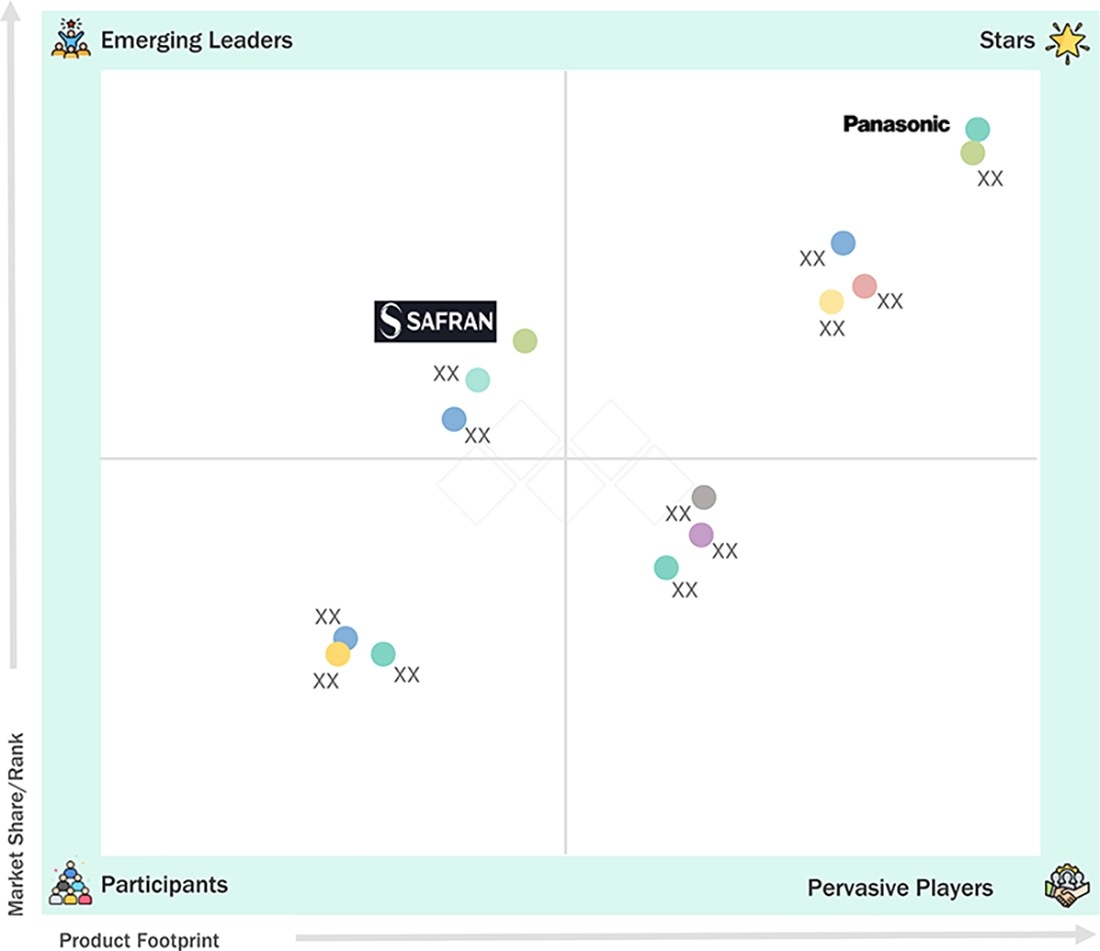
In the in-flight entertainment & connectivity market matrix, Panasonic Avionics Corporation is categorized as a “Star” because of its IFEC portfolio covering in-flight entertainment systems, multi-orbit connectivity, digital solutions, and technical services. Its connectivity portfolio combines LEO, GEO, and 5G networks, while its digital solutions support cloud-based content management, personal-device integration, and software updates, giving Panasonic a strong position across both entertainment and connectivity requirements. Safran is classified as an “Emerging Leader” because of its growing focus on software-based, cloud-enabled, and connected IFE capabilities through its RAVE platform. RAVE Cloud Services supports remote content distribution and edge computing, while newer developments include personal-device casting, edge caching, and integration of new digital services, strengthening Safran’s position in the evolving IFEC market.
in-flight-entertainment-communications-market Evaluation Metrics

Source: Secondary Research, Interviews with Experts, MarketsandMarkets Analysis

KEY MARKET PLAYERS

List of Top In-flight Entertainment & Connectivity (IFEC) Companies

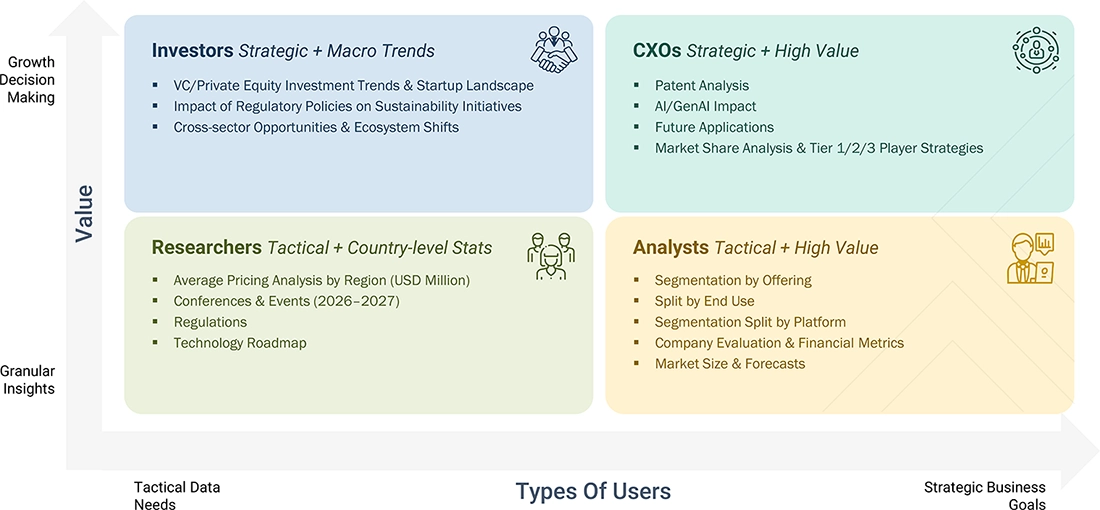
WHAT IS IN IT FOR YOU: IN-FLIGHT ENTERTAINMENT & CONNECTIVITY MARKET REPORT CONTENT GUIDE
in-flight-entertainment-communications-market Content Guide

DELIVERED CUSTOMIZATIONS

We have successfully delivered the following deep-dive customizations:

CLIENT REQUEST CUSTOMIZATION DELIVERED VALUE ADDS
Leading Manufacturer Additional segment breakdown for countries Additional country-level market sizing tables for segments/subsegments covered at the regional/global level to gain an understanding of market potential by each country
Emerging Leader Additional company profiles Competitive information on targeted players to gain granular insights into direct competition
Regional Market Leader Additional country market estimates Additional country-level deep dive for a more targeted understanding of the total addressable market

RECENT DEVELOPMENTS

  • July 2026 : Gogo announced that Gulfstream Aerospace received FAA Supplemental Type Certificate approval to install Gogo Galileo HDX on Gulfstream G650 and G650ER aircraft. The system uses Eutelsat OneWeb’s LEO network to provide high-speed, low-latency connectivity for streaming, video conferencing, communications, and internet browsing.
  • June 2026 : Panasonic Avionics Corporation announced that its Astrova in-flight engagement solution and Modular Interactive platform entered commercial service with Azerbaijan Airlines across its Airbus A320neo family fleet. The deployment covers 22 aircraft through a combination of line-fit and retrofit installations.
  • April 2026 : Viasat announced that Jetstar selected its AMARA multi-orbit in-flight connectivity solution for 11 Boeing 787 aircraft. The system is intended to provide reliable onboard internet supporting streaming, messaging, and browsing as part of Jetstar’s cabin modernization program.

Table of Contents

checkmarkExclusive indicates content/data unique to MarketsandMarkets and not available with any competitors.

TITLE
PAGE NO
1
INTRODUCTION


28
2
EXECUTIVE SUMMARY


32
3
PREMIUM INSIGHTS


38
4
MARKET OVERVIEW
In-flight connectivity soars with cloud services and BYOD, despite privacy and bandwidth constraints.


41
 
4.1
INTRODUCTION


4.2
MARKET DYNAMICS


4.2.1
DRIVERS


4.2.1.1
RISING TREND OF BRING YOUR OWN DEVICE AMONG PASSENGERS


4.2.1.2
RISING SHIFT TOWARD CLOUD SERVICES


4.2.1.3
FLEET MODERNIZATION AND RETROFIT OF LEGACY IFEC SYSTEMS


4.2.1.4
GROWING DEMAND FOR SEAMLESS, HIGH-QUALITY IN-FLIGHT CONNECTIVITY


4.2.1.5
GROWING ADOPTION OF STREAMING-BASED IN-FLIGHT ENTERTAINMENT


4.2.2
RESTRAINTS


4.2.2.1
STRINGENT DATA PRIVACY REGULATIONS


4.2.2.2
BANDWIDTH LIMITATIONS


4.2.2.3
AIRCRAFT WEIGHT AND POWER CONSTRAINTS


4.2.3
OPPORTUNITIES


4.2.3.1
EXPANSION OF OPEN AND INTEROPERABLE IFEC PLATFORMS


4.2.3.2
GROWING COLLABORATIONS BETWEEN AIRLINES AND CONTENT PLATFORMS


4.2.3.3
RISING INTEREST IN EXCLUSIVE IN-FLIGHT OFFERS


4.2.4
CHALLENGES


4.2.4.1
COMPLEXITY OF SECURING CONTENT LICENSING RIGHTS FOR IN-FLIGHT STREAMING


4.2.4.2
HIGH COST OF INSTALLATION AND INTEGRATION


4.3
UNMET NEEDS AND WHITE SPACES IN IN-FLIGHT ENTERTAINMENT AND CONNECTIVITY MARKET


4.4
INTER-CONNECTED MARKETS AND CROSS-SECTOR OPPORTUNITIES


4.5
STRATEGIC MOVES BY TIER 1/2/3 PLAYERS


5
INDUSTRY TRENDS
Emerging tech and pricing shifts redefine global in-flight entertainment and connectivity strategies.


51
 
5.1
INTRODUCTION


5.2
ECOSYSTEM ANALYSIS


5.2.1
MANUFACTURERS AND SYSTEM PROVIDER


5.2.2
SERVICE PROVIDER


5.2.3
END USER


5.3
TRENDS IN GLOBAL IN-FLIGHT ENTERTAINMENT AND CONNECTIVITY MARKET


5.4
VALUE CHAIN ANALYSIS


5.5
PRICING ANALYSIS


5.5.1
AVERAGE SELLING PRICE, BY OFFERING, 2025


5.5.2
INDICATIVE PRICING OF IFE HARDWARE DEVICES


5.6
TRADE ANALYSIS


5.6.1
HS CODE 852872


5.6.1.1
IMPORT SCENARIO (HS CODE 852872)


5.6.1.2
EXPORT SCENARIO (HS CODE 852872)


5.6.2
HS CODE 851762


5.6.2.1
IMPORT SCENARIO (HS CODE 851762)


5.6.2.2
EXPORT SCENARIO (HS CODE 851762)


5.7
CASE STUDIES


5.7.1
CASE STUDY 1: DELTA AIR LINES INTRODUCED CLOUD-BASED AND PERSONALIZED IN-FLIGHT ENTERTAINMENT


5.7.2
CASE STUDY 2: ETIHAD AIRWAYS EXPANDED VIASAT CONNECTIVITY ACROSS ITS FLEET


5.7.3
CASE STUDY 3: LUFTHANSA TESTED VIRTUAL REALITY AS PART OF IN-FLIGHT ENTERTAINMENT


5.8
KEY CONFERENCES & EVENTS, 2026–2027


5.9
TRENDS & DISRUPTIONS IMPACTING CUSTOMER BUSINESS


5.10
OPERATIONAL DATA


5.10.1
NEW NEW AIRCRAFT ORDERS BY OEMS, 2023-2025 (UNITS)


5.10.2
NEW AIRCRAFT ORDERS, BY AIRCRAFT TYPE, 2022-2024 (UNITS)


5.11
TOTAL COST OF OWNERSHIP


5.12
MACROECONOMIC OUTLOOK


5.12.1
INTRODUCTION


5.12.2
GDP TRENDS AND FORECAST


5.13
BUSINESS MODELS


5.13.1
ADVERTISING & SPONSORED CONNECTIVITY


5.13.2
CONNECTIVITY-AS-A-SERVICE


5.13.3
IFEC HARDWARE SALES & SYSTEM INTEGRATION


5.14
BILL OF MATERIALS ANALYSIS


5.14.1
BILL OF MATERIALS ANALYSIS FOR IN-FLIGHT ENTERTAINMENT SOLUTIONS


5.14.2
BILL OF MATERIALS ANALYSIS FOR IN-FLIGHT CONNECTIVITY SOLUTIONS


6
TECHNOLOGICAL ADVANCEMENTS, AI-DRIVEN IMPACT, PATENTS, INNOVATIONS, AND FUTURE APPLICATIONS
AI-driven innovations redefine in-flight connectivity, enhancing passenger experiences and operational efficiencies.


77
 
6.1
KEY TECHNOLOGIES


6.1.1
MULTI-ORBIT SATELLITE AND LEO-BASED IN-FLIGHT CONNECTIVITY TECHNOLOGY


6.1.2
5G AND NEXT-GENERATION AIR-TO-GROUND CONNECTIVITY TECHNOLOGY


6.1.3
EDGE COMPUTING AND CLOUD-ENABLED IN-FLIGHT ENTERTAINMENT TECHNOLOGY


6.2
COMPLEMENTARY TECHNOLOGIES


6.2.1
ADVANCED AIRCRAFT ANTENNA, MODEM, AND SATCOM TERMINAL TECHNOLOGIES


6.2.2
WIRELESS CABIN NETWORKING AND DIGITAL CONTENT MANAGEMENT TECHNOLOGIES


6.3
ADJACENT TECHNOLOGIES


6.3.1
AIRLINE DIGITAL COMMERCE AND PERSONALIZED PASSENGER EXPERIENCE TECHNOLOGY


6.3.2
SMART CABIN DISPLAYS, PASSENGER DEVICES, AND HUMAN-MACHINE INTERFACE TECHNOLOGY


6.4
TECHNOLOGY ROADMAP


6.5
IMPACT OF AI/GENERATIVE AI


6.5.1
TOP USE CASES AND MARKET POTENTIAL


6.5.2
BEST PRACTICES


6.5.3
CASE STUDIES OF AI IMPLEMENTATION


6.5.4
INTERCONNECTED ECOSYSTEM AND IMPACT ON MARKET PLAYERS


6.5.5
CLIENTS’ READINESS TO ADOPT GEN AI


6.6
PATENT ANALYSIS


6.7
FUTURE APPLICATIONS


6.8
SUCCESS STORIES AND REAL-WORLD APPLICATIONS


6.8.1
PANASONIC AVIONICS CORPORATION: AGENTIC AI FOR IFEC DIAGNOSTICS


6.8.2
DELTA AIR LINES: AI-BASED PERSONALIZATION OF IN-FLIGHT ENTERTAINMENT


6.8.3
LUFTHANSA GROUP: AI-BASED CABIN DEFECT MANAGEMENT


7
SUSTAINABILITY AND REGULATORY LANDSCAPE
Unlock sustainability with lightweight, recyclable IFE systems and global regulatory insights.


95
 
7.1
REGIONAL REGULATIONS AND COMPLIANCE


7.1.1
ORGANIZATIONS


7.1.2
INDUSTRY STANDARDS


7.2
SUSTAINABILITY INITIATIVES


7.2.1
LIGHTWEIGHT IFE HARDWARE AND LOW-POWER CONNECTIVITY SYSTEMS


7.2.2
USE OF RECYCLABLE MATERIALS IN IFE SCREENS, SEAT ELECTRONICS, CABLING, ANTENNAS, RADOMES, AND CONNECTIVITY EQUIPMENT


7.3
CERTIFICATIONS, LABELING, AND ECO-STANDARDS


8
CUSTOMER LANDSCAPE & BUYER BEHAVIOR
Unlock unmet needs and decision-making dynamics shaping buyer behavior in diverse industries.


107
 
8.1
DECISION-MAKING PROCESS


8.2
BUYERS, STAKEHOLDERS, AND BUYING EVALUATION CRITERIA


8.2.1
KEY STAKEHOLDERS IN BUYING PROCESS


8.2.2
BUYING CRITERIA


8.3
ADOPTION BARRIERS & INTERNAL CHALLENGES


8.4
UNMET NEEDS FROM VARIOUS END-USE INDUSTRIES


9
IN-FLIGHT ENTERTAINMENT AND CONNECTIVITY MARKET, BY OFFERING
Market Size & Growth Rate Forecast Analysis to 2031 in USD Million | 16 Data Tables


114
 
9.1
INTRODUCTION


9.2
IN-FLIGHT ENTERTAINMENT


9.2.1
PRODUCT


9.2.1.1
PORTABLE DEVICES


9.2.1.1.1
INCREASING PERSONAL-DEVICE USAGE AND WIRELESS IFE ADOPTION TO DRIVE GROWTH


9.2.1.2
NON-PORTABLE DEVICES


9.2.1.2.1
RISING AIRLINE INVESTMENT IN SEATBACK SYSTEMS TO DRIVE GROWTH


9.2.2
IN-FLIGHT CONTENT


9.2.2.1
STREAMED


9.2.2.1.1
RISING DEMAND FOR ONBOARD STREAMING AND PERSONALIZED DIGITAL CONTENT TO DRIVE GROWTH


9.2.2.2
STORED


9.2.2.2.1
EXPANDING CONTENT LIBRARIES AND RELIABLE OFFLINE ENTERTAINMENT TO DRIVE GROWTH


9.2.3
IN-FLIGHT RETAIL AND ADVERTISING


9.2.3.1
RETAIL


9.2.3.1.1
DIGITAL ONBOARD COMMERCE AND PASSENGER ENGAGEMENT TO DRIVE GROWTH


9.2.3.2
ADVERTISING


9.2.3.2.1
PERSONALIZED DIGITAL ENGAGEMENT AND NEW AIRLINE REVENUE CHANNELS TO DRIVE GROWTH
 
 
9.3
IN-FLIGHT CONNECTIVITY


9.3.1
SOLUTION


9.3.1.1
WIRED


9.3.1.1.1
FLEET MODERNIZATION AND SEATBACK IFE UPGRADES TO DRIVE GROWTH


9.3.1.2
WIRELESS


9.3.1.2.1
PERSONAL-DEVICE USAGE AND LOWER-COMPLEXITY DEPLOYMENT TO DRIVE GROWTH


9.3.2
IN-FLIGHT INTERNET


9.3.2.1
AIR-TO-GROUND (CELLULAR-BASED)


9.3.2.1.1
EXPANDING TERRESTRIAL COVERAGE AND LOWER LATENCY TO DRIVE GROWTH


9.3.2.2
SATELLITE-BASED


9.3.2.2.1
GLOBAL ROUTE COVERAGE AND HIGH-CAPACITY SATELLITE NETWORKS TO DRIVE GROWTH


9.3.2.3
HYBRID-BASED


9.3.2.3.1
MULTI-ORBIT FLEXIBILITY AND NETWORK RESILIENCE TO DRIVE GROWTH
 
10
IN-FLIGHT ENTERTAINMENT AND CONNECTIVITY MARKET, BY END USE
Market Size & Growth Rate Forecast Analysis to 2031 in USD Million | 2 Data Tables


129
 
10.1
INTRODUCTION


10.2
OEM


10.2.1
NEW-AIRCRAFT DELIVERIES AND FACTORY-INSTALLED IFEC SYSTEMS TO DRIVE GROWTH


10.3
AFTERMARKET


10.3.1
EXTENDING AIRCRAFT SERVICE LIFE AND UPGRADING LEGACY SYSTEMS TO DRIVE GROWTH


11
IN-FLIGHT ENTERTAINMENT AND CONNECTIVITY MARKET, BY PLATFORM
Market Size & Growth Rate Forecast Analysis to 2031 in USD Million | 2 Data Tables


133
 
11.1
INTRODUCTION


11.2
NARROW-BODY AIRCRAFT


11.2.1
EXPANDING SINGLE-AISLE FLEETS AND WIDER DEPLOYMENT OF WIRELESS IFEC TO DRIVE GROWTH


11.3
WIDE-BODY AIRCRAFT


11.3.1
EXPANDING LONG-HAUL FLEETS AND HIGHER IFEC REQUIREMENTS TO DRIVE MARKET


11.4
BUSINESS JET


11.4.1
RISING BUSINESS JET DELIVERIES AND GREATER DEMAND FOR CONNECTED CABINS TO DRIVE MARKET


12
IN-FLIGHT ENTERTAINMENT AND CONNECTIVITY MARKET, BY CLASS
Market Size & Growth Rate Forecast Analysis to 2031 in USD Million | 2 Data Tables


138
 
12.1
INTRODUCTION


12.2
FIRST CLASS


12.2.1
INCREASING DEMAND FOR PREMIUM-CABIN SERVICES AND ADVANCED ENTERTAINMENT TO DRIVE GROWTH


12.3
BUSINESS CLASS


12.3.1
GROWING BUSINESS TRAVEL AND PREMIUM CABIN UPGRADES TO DRIVE GROWTH


12.4
PREMIUM ECONOMY CLASS


12.4.1
INCREASING PREMIUM-CABIN CAPACITY AND ENHANCED ONBOARD SERVICES TO DRIVE GROWTH


12.5
ECONOMY CLASS


12.5.1
RISING ECONOMY-CLASS PASSENGER VOLUMES AND BROADER CONNECTIVITY DEPLOYMENT TO DRIVE GROWTH


13
IN-FLIGHT ENTERTAINMENT AND CONNECTIVITY MARKET, BY REGION
Comprehensive coverage of 8 Regions with country-level deep-dive of 19 Countries | 120 Data Tables.


144
 
13.1
INTRODUCTION


13.2
NORTH AMERICA


13.2.1
US


13.2.1.1
RISING AIR TRAVEL AND FLEET CONNECTIVITY UPGRADES TO DRIVE MARKET


13.2.2
CANADA


13.2.2.1
CONVERSION OF AIRLINE FLEETS FROM LIMITED ONBOARD CONNECTIVITY TO AIRCRAFT-WIDE, STREAMING-QUALITY INTERNET TO DRIVE MARKET


13.3
EUROPE


13.3.1
UK


13.3.1.1
RECORD AIR TRAFFIC AND FLEET-WIDE CONNECTIVITY UPGRADES TO DRIVE MARKET


13.3.2
FRANCE


13.3.2.1
EXPANSION OF HIGH-SPEED ONBOARD CONNECTIVITY TO DRIVE MARKET


13.3.3
GERMANY


13.3.3.1
LUFTHANSA’S FLEET-WIDE CONNECTIVITY UPGRADES TO DRIVE MARKET


13.3.4
ITALY


13.3.4.1
INTERNATIONAL PASSENGER TRAFFIC AND FLEET DIGITALIZATION TO DRIVE MARKET


13.3.5
SPAIN


13.3.5.1
RISING INTERNATIONAL AIR TRAFFIC AND HIGH-SPEED CONNECTIVITY DEPLOYMENT TO DRIVE MARKET


13.3.6
REST OF EUROPE


13.4
ASIA PACIFIC


13.4.1
CHINA


13.4.1.1
RAPID PASSENGER GROWTH AND AIRCRAFT CONNECTIVITY UPGRADES TO DRIVE MARKET


13.4.2
INDIA


13.4.2.1
RAPID AIR TRAVEL EXPANSION AND RISING ONBOARD DATA USAGE TO DRIVE MARKET


13.4.3
JAPAN


13.4.3.1
RISING INTERNATIONAL AIR TRAFFIC AND WIDER ONBOARD STREAMING TO DRIVE MARKET


13.4.4
AUSTRALIA


13.4.4.1
INTERNATIONAL TRAFFIC AND FLEET CONNECTIVITY UPGRADES TO DRIVE MARKET


13.4.5
SOUTH KOREA


13.4.5.1
EXPANDING INTERNATIONAL AIR TRAFFIC AND FLEET-WIDE WI-FI DEPLOYMENT TO DRIVE MARKET


13.4.6
REST OF ASIA PACIFIC


13.5
MIDDLE EAST & AFRICA


13.5.1
GCC


13.5.1.1
UAE


13.5.1.1.1
RAPID AIRLINE EXPANSION AND HIGH-CAPACITY CONNECTIVITY TO DRIVE MARKET


13.5.1.2
SAUDI ARABIA


13.5.1.2.1
GROWING LONG-HAUL OPERATIONS AND AIRLINE FLEET MODERNIZATION TO DRIVE MARKET


13.5.1.3
QATAR


13.5.1.3.1
EXPANDING GLOBAL CONNECTIVITY AND FLEET-WIDE SATELLITE UPGRADES TO DRIVE MARKET


13.5.2
TURKEY


13.5.2.1
RECORD PASSENGER TRAFFIC AND EXPANDING ONBOARD CONNECTIVITY TO DRIVE MARKET


13.5.3
SOUTH AFRICA


13.5.3.1
INTERNATIONAL ROUTE RECOVERY AND DIGITAL CABIN UPGRADES TO DRIVE MARKET


13.6
LATIN AMERICA


13.6.1
BRAZIL


13.6.1.1
RECORD PASSENGER TRAFFIC AND GROWING PASSENGER-DEVICE CONNECTIVITY TO DRIVE MARKET


13.6.2
MEXICO


13.6.2.1
TRANSITION TOWARD WIRELESS ENTERTAINMENT AND ONBOARD INTERNET ON NEWER AIRCRAFT TO DRIVE MARKET


13.6.3
REST OF LATIN AMERICA


14
COMPETITIVE LANDSCAPE
Discover market leaders' strategies and emerging players reshaping competitive dynamics.


195
 
14.1
INTRODUCTION


14.2
KEY PLAYER STRATEGIES


14.3
REVENUE ANALYSIS


14.4
MARKET SHARE ANALYSIS


14.5
COMPANY EVALUATION MATRIX


14.5.1
STARS


14.5.2
EMERGING LEADERS


14.5.3
PERVASIVE PLAYERS


14.5.4
PARTICIPANTS


14.5.5
COMPANY FOOTPRINT


14.6
STARTUP/SME EVALUATION MATRIX, 2025


14.6.1
PROGRESSIVE COMPANIES


14.6.2
RESPONSIVE COMPANIES


14.6.3
DYNAMIC COMPANIES


14.6.4
STARTING BLOCKS


14.6.5
COMPETITIVE BENCHMARKING


14.7
COMPANY VALUATION AND FINANCIAL METRICS


14.8
BRAND COMPARISON


14.9
COMPETITIVE SCENARIO


14.9.1
PRODUCT LAUNCHES


14.9.2
DEALS


14.9.3
OTHER DEVELOPMENTS


15
COMPANY PROFILES
In-depth Company Profiles of Leading Market Players with detailed Business Overview, Product and Service Portfolio, Recent Developments, and Unique Analyst Perspective (MnM View)


253
 
15.1
KEY PLAYERS


15.1.1
PANASONIC AVIONICS CORPORATION


15.1.1.1
BUSINESS OVERVIEW


15.1.1.2
PRODUCTS/SOLUTIONS/SERVICES OFFERED


15.1.1.3
RECENT DEVELOPMENTS


15.1.1.4
MNM VIEW


15.1.1.4.1
KEY STRENGTHS


15.1.1.4.2
STRATEGIC CHOICES


15.1.1.4.3
WEAKNESSES AND COMPETITIVE THREATS


15.1.2
THALES


15.1.3
ANUVU


15.1.4
COLLINS AEROSPACE (PARENT:RTX CORPORATION)


15.1.5
ASTRONICS CORPORATION


15.1.6
VIASAT, INC.


15.1.7
GOGO BUSINESS AVIATION, LLC


15.1.8
SAFRAN


15.1.9
HONEYWELL INTERNATIONAL INC.


15.1.10
SITA


15.1.11
ECA GROUP


15.1.12
IRIDIUM COMMUNICATIONS INC.


15.1.13
LUFTHANSA SYSTEMS


15.1.14
AERQ


15.1.15
BLUEBOX AVIATION SYSTEMS LTD.


15.2
OTHER PLAYERS


15.2.1
EUTELSAT COMMUNICATIONS SA


15.2.2
IMMFLY


15.2.3
IDEANOVA TECHNOLOGIES, INC.


15.2.4
INFLIGHT VR SOFTWARE GMBH


15.2.5
SMARTSKY NETWORKS, LLC.


15.2.6
ARGONFDS


15.2.7
AEROPLAY ENTERTAINMENT


15.2.8
IMAGIK INTERNATIONAL CORP.


15.2.9
SPAFAX


15.2.10
BURRANA


16
RESEARCH METHODOLOGY


347
 
16.1
RESEARCH DATA


16.1.1
SECONDARY DATA


16.1.1.1
KEY DATA FROM SECONDARY SOURCES


16.1.2
PRIMARY DATA


16.1.2.1
BREAKDOWN OF PRIMARY INTERVIEWS


16.1.3
KEY PRIMARY SOURCES


16.2
FACTOR ANALYSIS


16.2.1
INTRODUCTION


16.2.2
DEMAND-SIDE ANALYSIS


16.2.3
DEMAND-SIDE INDICATORS


16.2.3.1
PASSENGER TRAFFIC


16.2.3.2
EMERGING COUNTRIES


16.2.4
SUPPLY-SIDE ANALYSIS


16.2.4.1
SUPPLY-SIDE INDICATORS


16.3
RESEARCH APPROACH AND METHODOLOGY


16.3.1
IN-FLIGHT ENTERTAINMENT AND CONNECTIVITY MARKET


16.3.1.1
OEM


16.3.1.2
AFTERMARKET


16.3.2
IN-FLIGHT CONNECTIVITY MARKET


16.3.3
IN-FLIGHT ENTERTAINMENT MARKET


16.3.4
TOP-DOWN APPROACH


16.4
DATA TRIANGULATION


16.5
RESEARCH ASSUMPTIONS


16.5.1
ASSUMPTIONS USED IN MARKET SIZING AND FORECAST


16.6
RESEARCH LIMITATIONS


16.7
RISK ANALYSIS


17
APPENDIX


360
 
17.1
DISCUSSION GUIDE


17.2
KNOWLEDGESTORE: MARKETSANDMARKETS’ SUBSCRIPTION PORTAL


17.3
CUSTOMIZATION OPTIONS


17.4
RELATED REPORTS


17.5
AUTHOR DETAILS


LIST OF TABLES


TABLE 1
IN-FLIGHT ENTERTAINMENT AND CONNECTIVITY MARKET: INCLUSIONS AND EXCLUSIONS


TABLE 2
USD EXCHANGE RATES, 2021–2025


TABLE 3
STRATEGIC MOVES BY TIER 1, 2, AND 3 PLAYERS


TABLE 4
ROLE OF COMPANIES IN ECOSYSTEM


TABLE 5
AVERAGE SELLING PRICE, BY OFFERING, 2025


TABLE 6
IMPORT DATA FOR HS CODE 852872-COMPLIANT PRODUCTS, BY COUNTRY, 2021–2025 (USD THOUSAND)


TABLE 7
EXPORT DATA FOR HS CODE 8903 -COMPLIANT PRODUCTS, BY COUNTRY, 2021–2025 (USD THOUSAND)


TABLE 8
IMPORT DATA FOR HS CODE 851762 -COMPLIANT PRODUCTS, BY COUNTRY, 2021–2025 (USD THOUSAND)


TABLE 9
EXPORT DATA FOR HS CODE 851762-COMPLIANT PRODUCTS, BY COUNTRY, 2021–2025 (USD THOUSAND)


TABLE 10
KEY CONFERENCES & EVENTS, 2026–2027


TABLE 11
NEW AIRCRAFT ORDERS BY OEMS, 2023–2025 (UNITS)


TABLE 12
NEW AIRCRAFT ORDERS, BY AIRCRAFT TYPE, 2022–2024 (UNITS)


TABLE 13
Y-O-Y PENETRATION OF IN-FLIGHT CONNECTIVITY INTO ACTIVE FLEET, 2021–2031


TABLE 14
Y-O-Y PENETRATION OF IN-FLIGHT ENTERTAINMENT INTO ACTIVE FLEET, 2021–2031


TABLE 15
GDP PERCENTAGE CHANGE, BY COUNTRY, 2021–2030


TABLE 16
EVOLUTION OF IN-FLIGHT ENTERTAINMENT AND CONNECTIVITY MARKET


TABLE 17
PATENT ANALYSIS, 2021-2025


TABLE 18
IMMERSIVE VR/AR-BASED IN-FLIGHT ENTERTAINMENT


TABLE 19
CLOUD-BASED LIVE STREAMING AND GAMING THROUGH IFEC


TABLE 20
NORTH AMERICA: REGULATORY BODIES, GOVERNMENT AGENCIES, AND OTHER ORGANIZATIONS


TABLE 21
EUROPE: REGULATORY BODIES, GOVERNMENT AGENCIES, AND OTHER ORGANIZATIONS


TABLE 22
ASIA PACIFIC: REGULATORY BODIES, GOVERNMENT AGENCIES, AND OTHER ORGANIZATIONS


TABLE 23
MIDDLE EAST: REGULATORY BODIES, GOVERNMENT AGENCIES, AND OTHER ORGANIZATIONS


TABLE 24
LATIN AMERICA : REGULATORY BODIES, GOVERNMENT AGENCIES, AND OTHER ORGANIZATIONS


TABLE 25
INDUSTRY STANDARDS IN IN-FLIGHT ENTERTAINMENT AND CONNECTIVITY MARKET


TABLE 26
SUSTAINABILITY INITIATIVES IN IN-FLIGHT ENTERTAINMENT AND CONNECTIVITY MARKET


TABLE 27
CERTIFICATIONS, LABELING, AND ECO-STANDARDS


TABLE 28
INFLUENCE OF STAKEHOLDERS, END USE (%)


TABLE 29
KEY BUYING CRITERIA FOR IN-FLIGHT ENTERTAINMENT AND CONNECTIVITY MARKET, BY END USE


TABLE 30
IN-FLIGHT ENTERTAINMENT AND CONNECTIVITY MARKET, BY OFFERING, 2021–2025 (USD MILLION)


TABLE 31
IN-FLIGHT ENTERTAINMENT AND CONNECTIVITY MARKET, BY OFFERING, 2026–2031 (USD MILLION)


TABLE 32
IN-FLIGHT ENTERTAINMENT MARKET, BY TYPE, 2021–2025 (USD MILLION)


TABLE 33
IN-FLIGHT ENTERTAINMENT MARKET, BY TYPE, 2026–2031 (USD MILLION)


TABLE 34
IN-FLIGHT ENTERTAINMENT MARKET, BY PRODUCT, 2021–2025 (USD MILLION)


TABLE 35
IN-FLIGHT ENTERTAINMENT MARKET, BY PRODUCT, 2026–2031 (USD MILLION)


TABLE 36
IN-FLIGHT ENTERTAINMENT MARKET, BY IN-FLIGHT CONTENT, 2021–2025 (USD MILLION)


TABLE 37
IN-FLIGHT ENTERTAINMENT MARKET, BY IN-FLIGHT CONTENT, 2026–2031 (USD MILLION)


TABLE 38
IN-FLIGHT ENTERTAINMENT MARKET, BY IN-FLIGHT RETAIL AND ADVERTISING, 2021–2025 (USD MILLION)


TABLE 39
IN-FLIGHT ENTERTAINMENT MARKET, BY IN-FLIGHT RETAIL AND ADVERTISING, 2026–2031 (USD MILLION)


TABLE 40
IN-FLIGHT CONNECTIVITY MARKET, BY TYPE, 2021–2025 (USD MILLION)


TABLE 41
IN-FLIGHT CONNECTIVITY MARKET, BY TYPE, 2026–2031 (USD MILLION)


TABLE 42
IN-FLIGHT CONNECTIVITY MARKET, BY SOLUTION, 2021–2025 (USD MILLION)


TABLE 43
IN-FLIGHT CONNECTIVITY MARKET, BY SOLUTION, 2026–2031 (USD MILLION)


TABLE 44
IN-FLIGHT CONNECTIVITY MARKET, BY IN-FLIGHT INTERNET, 2021–2025 (USD MILLION)


TABLE 45
IN-FLIGHT CONNECTIVITY MARKET, BY IN-FLIGHT INTERNET, 2026–2031 (USD MILLION)


TABLE 46
IN-FLIGHT ENTERTAINMENT AND CONNECTIVITY MARKET, BY END USE, 2021–2025 (USD MILLION)


TABLE 47
IN-FLIGHT ENTERTAINMENT AND CONNECTIVITY MARKET, BY END USE, 2026–2031 (USD MILLION)


TABLE 48
IN-FLIGHT ENTERTAINMENT AND CONNECTIVITY MARKET, BY PLATFORM, 2021–2025 (USD MILLION)


TABLE 49
IN-FLIGHT ENTERTAINMENT AND CONNECTIVITY MARKET, BY PLATFORM, 2026–2031 (USD MILLION)


TABLE 50
IN-FLIGHT ENTERTAINMENT AND CONNECTIVITY MARKET, BY CLASS, 2021–2025 (USD MILLION)


TABLE 51
IN-FLIGHT ENTERTAINMENT AND CONNECTIVITY MARKET, BY CLASS, 2026–2031 (USD MILLION)


TABLE 52
IN-FLIGHT ENTERTAINMENT AND CONNECTIVITY SYSTEM MARKET, BY REGION, 2021–2025 (USD MILLION)


TABLE 53
IN-FLIGHT ENTERTAINMENT AND CONNECTIVITY MARKET, BY REGION, 2026–2031 (USD MILLION)


TABLE 54
NORTH AMERICA: IN-FLIGHT ENTERTAINMENT AND CONNECTIVITY MARKET, BY COUNTRY, 2021–2025 (USD MILLION)


TABLE 55
NORTH AMERICA: IN-FLIGHT ENTERTAINMENT AND CONNECTIVITY MARKET, BY COUNTRY, 2026–2031 (USD MILLION)


TABLE 56
NORTH AMERICA: IN-FLIGHT ENTERTAINMENT AND CONNECTIVITY MARKET, BY OFFERING, 2021–2025 (USD MILLION)


TABLE 57
NORTH AMERICA: IN-FLIGHT ENTERTAINMENT AND CONNECTIVITY MARKET, BY OFFERING, 2026–2031 (USD MILLION)


TABLE 58
NORTH AMERICA: IN-FLIGHT ENTERTAINMENT AND CONNECTIVITY MARKET, BY END USE, 2021–2025 (USD MILLION)


TABLE 59
NORTH AMERICA: IN-FLIGHT ENTERTAINMENT AND CONNECTIVITY MARKET, BY END USE, 2026–2031 (USD MILLION)


TABLE 60
US: IN-FLIGHT ENTERTAINMENT AND CONNECTIVITY MARKET, BY OFFERING, 2021–2025 (USD MILLION)


TABLE 61
US: IN-FLIGHT ENTERTAINMENT AND CONNECTIVITY MARKET, BY OFFERING, 2026–2031 (USD MILLION)


TABLE 62
US: IN-FLIGHT ENTERTAINMENT AND CONNECTIVITY MARKET, BY END USE, 2021–2025 (USD MILLION)


TABLE 63
US: IN-FLIGHT ENTERTAINMENT AND CONNECTIVITY MARKET, BY END USE, 2026–2031 (USD MILLION)


TABLE 64
CANADA: IN-FLIGHT ENTERTAINMENT AND CONNECTIVITY MARKET, BY OFFERING, 2021–2025 (USD MILLION)


TABLE 65
CANADA: IN-FLIGHT ENTERTAINMENT AND CONNECTIVITY MARKET, BY OFFERING, 2026–2031 (USD MILLION)


TABLE 66
CANADA: IN-FLIGHT ENTERTAINMENT AND CONNECTIVITY MARKET, BY END USE, 2021–2025 (USD MILLION)


TABLE 67
CANADA: IN-FLIGHT ENTERTAINMENT AND CONNECTIVITY MARKET, BY END USE, 2026–2031 (USD MILLION)


TABLE 68
EUROPE: IN-FLIGHT ENTERTAINMENT AND CONNECTIVITY MARKET, BY COUNTRY, 2021–2025 (USD MILLION)


TABLE 69
EUROPE: IN-FLIGHT ENTERTAINMENT AND CONNECTIVITY MARKET, BY COUNTRY, 2026–2031 (USD MILLION)


TABLE 70
EUROPE: IN-FLIGHT ENTERTAINMENT AND CONNECTIVITY MARKET, BY OFFERING, 2021–2025 (USD MILLION)


TABLE 71
EUROPE: IN-FLIGHT ENTERTAINMENT AND CONNECTIVITY MARKET, BY OFFERING, 2026–2031 (USD MILLION)


TABLE 72
EUROPE: IN-FLIGHT ENTERTAINMENT AND CONNECTIVITY MARKET, BY END USE, 2021–2025 (USD MILLION)


TABLE 73
EUROPE: IN-FLIGHT ENTERTAINMENT AND CONNECTIVITY MARKET, BY END USE, 2026–2031 (USD MILLION)


TABLE 74
UK: IN-FLIGHT ENTERTAINMENT AND CONNECTIVITY MARKET, BY OFFERING, 2021–2025 (USD MILLION)


TABLE 75
UK: IN-FLIGHT ENTERTAINMENT AND CONNECTIVITY MARKET, BY OFFERING, 2026–2031 (USD MILLION)


TABLE 76
UK: IN-FLIGHT ENTERTAINMENT AND CONNECTIVITY MARKET, BY END USE, 2021–2025 (USD MILLION)


TABLE 77
UK: IN-FLIGHT ENTERTAINMENT AND CONNECTIVITY MARKET, BY END USE, 2026–2031 (USD MILLION)


TABLE 78
FRANCE: IN-FLIGHT ENTERTAINMENT AND CONNECTIVITY MARKET, BY OFFERING, 2021–2025 (USD MILLION)


TABLE 79
FRANCE: IN-FLIGHT ENTERTAINMENT AND CONNECTIVITY MARKET, BY OFFERING, 2026–2031 (USD MILLION)


TABLE 80
FRANCE: IN-FLIGHT ENTERTAINMENT AND CONNECTIVITY MARKET, BY END USE, 2021–2025 (USD MILLION)


TABLE 81
FRANCE: IN-FLIGHT ENTERTAINMENT AND CONNECTIVITY MARKET, BY END USE, 2026–2031 (USD MILLION)


TABLE 82
GERMANY: IN-FLIGHT ENTERTAINMENT AND CONNECTIVITY MARKET, BY OFFERING, 2021–2025 (USD MILLION)


TABLE 83
GERMANY: IN-FLIGHT ENTERTAINMENT AND CONNECTIVITY MARKET, BY OFFERING, 2026–2031 (USD MILLION)


TABLE 84
GERMANY: IN-FLIGHT ENTERTAINMENT AND CONNECTIVITY MARKET, BY END USE, 2021–2025 (USD MILLION)


TABLE 85
GERMANY: IN-FLIGHT ENTERTAINMENT AND CONNECTIVITY MARKET, BY END USE, 2026–2031 (USD MILLION)


TABLE 86
ITALY: IN-FLIGHT ENTERTAINMENT AND CONNECTIVITY MARKET, BY OFFERING, 2021–2025 (USD MILLION)


TABLE 87
ITALY: IN-FLIGHT ENTERTAINMENT AND CONNECTIVITY MARKET, BY OFFERING, 2026–2031 (USD MILLION)


TABLE 88
ITALY: IN-FLIGHT ENTERTAINMENT AND CONNECTIVITY MARKET, BY END USE, 2021–2025 (USD MILLION)


TABLE 89
ITALY: IN-FLIGHT ENTERTAINMENT AND CONNECTIVITY MARKET, BY END USE, 2026–2031 (USD MILLION)


TABLE 90
SPAIN: IN-FLIGHT ENTERTAINMENT AND CONNECTIVITY MARKET, BY OFFERING, 2021–2025 (USD MILLION)


TABLE 91
SPAIN: IN-FLIGHT ENTERTAINMENT AND CONNECTIVITY MARKET, BY OFFERING, 2026–2031 (USD MILLION)


TABLE 92
SPAIN: IN-FLIGHT ENTERTAINMENT AND CONNECTIVITY MARKET, BY END USE, 2021–2025 (USD MILLION)


TABLE 93
SPAIN: IN-FLIGHT ENTERTAINMENT AND CONNECTIVITY MARKET, BY END USE, 2026–2031 (USD MILLION)


TABLE 94
REST OF EUROPE: IN-FLIGHT ENTERTAINMENT AND CONNECTIVITY MARKET, BY OFFERING, 2021–2025 (USD MILLION)


TABLE 95
REST OF EUROPE: IN-FLIGHT ENTERTAINMENT AND CONNECTIVITY MARKET, BY OFFERING, 2026–2031 (USD MILLION)


TABLE 96
REST OF EUROPE: IN-FLIGHT ENTERTAINMENT AND CONNECTIVITY MARKET, BY END USE, 2021–2025 (USD MILLION)


TABLE 97
REST OF EUROPE: IN-FLIGHT ENTERTAINMENT AND CONNECTIVITY MARKET, BY END USE, 2026–2031 (USD MILLION)


TABLE 98
ASIA PACIFIC: IN-FLIGHT ENTERTAINMENT AND CONNECTIVITY MARKET, BY COUNTRY, 2021–2025 (USD MILLION)


TABLE 99
ASIA PACIFIC: IN-FLIGHT ENTERTAINMENT AND CONNECTIVITY MARKET, BY COUNTRY, 2026–2031 (USD MILLION)


TABLE 100
ASIA PACIFIC: IN-FLIGHT ENTERTAINMENT AND CONNECTIVITY MARKET, BY OFFERING, 2021–2025 (USD MILLION)


TABLE 101
ASIA PACIFIC: IN-FLIGHT ENTERTAINMENT AND CONNECTIVITY MARKET, BY OFFERING, 2026–2031 (USD MILLION)


TABLE 102
ASIA PACIFIC: IN-FLIGHT ENTERTAINMENT AND CONNECTIVITY MARKET, BY END USE, 2021–2025 (USD MILLION)


TABLE 103
ASIA PACIFIC: IN-FLIGHT ENTERTAINMENT AND CONNECTIVITY MARKET, BY END USE, 2026–2031 (USD MILLION)


TABLE 104
CHINA: IN-FLIGHT ENTERTAINMENT AND CONNECTIVITY MARKET, BY OFFERING, 2021–2025 (USD MILLION)


TABLE 105
CHINA: IN-FLIGHT ENTERTAINMENT AND CONNECTIVITY MARKET, BY OFFERING, 2026–2031 (USD MILLION)


TABLE 106
CHINA: IN-FLIGHT ENTERTAINMENT AND CONNECTIVITY MARKET, BY END USE, 2021–2025 (USD MILLION)


TABLE 107
CHINA: IN-FLIGHT ENTERTAINMENT AND CONNECTIVITY MARKET, BY END USE, 2026–2031 (USD MILLION)


TABLE 108
INDIA: IN-FLIGHT ENTERTAINMENT AND CONNECTIVITY MARKET, BY OFFERING, 2021–2025 (USD MILLION)


TABLE 109
INDIA: IN-FLIGHT ENTERTAINMENT AND CONNECTIVITY MARKET, BY OFFERING, 2026–2031 (USD MILLION)


TABLE 110
INDIA: IN-FLIGHT ENTERTAINMENT AND CONNECTIVITY MARKET, BY END USE, 2021–2025 (USD MILLION)


TABLE 111
INDIA: IN-FLIGHT ENTERTAINMENT AND CONNECTIVITY MARKET, BY END USE, 2026–2031 (USD MILLION)


TABLE 112
JAPAN: IN-FLIGHT ENTERTAINMENT AND CONNECTIVITY MARKET, BY OFFERING, 2021–2025 (USD MILLION)


TABLE 113
JAPAN: IN-FLIGHT ENTERTAINMENT AND CONNECTIVITY MARKET, BY OFFERING, 2026–2031 (USD MILLION)


TABLE 114
JAPAN: IN-FLIGHT ENTERTAINMENT AND CONNECTIVITY MARKET, BY END USE, 2021–2025 (USD MILLION)


TABLE 115
JAPAN: IN-FLIGHT ENTERTAINMENT AND CONNECTIVITY MARKET, BY END USE, 2026–2031 (USD MILLION)


TABLE 116
AUSTRALIA: IN-FLIGHT ENTERTAINMENT AND CONNECTIVITY MARKET, BY OFFERING, 2021–2025 (USD MILLION)


TABLE 117
AUSTRALIA: IN-FLIGHT ENTERTAINMENT AND CONNECTIVITY MARKET, BY OFFERING, 2026–2031 (USD MILLION)


TABLE 118
AUSTRALIA: IN-FLIGHT ENTERTAINMENT AND CONNECTIVITY MARKET, BY END USE, 2021–2025 (USD MILLION)


TABLE 119
AUSTRALIA: IN-FLIGHT ENTERTAINMENT AND CONNECTIVITY MARKET, BY END USE, 2026–2031 (USD MILLION)


TABLE 120
SOUTH KOREA: IN-FLIGHT ENTERTAINMENT AND CONNECTIVITY MARKET, BY OFFERING, 2021–2025 (USD MILLION)


TABLE 121
SOUTH KOREA: IN-FLIGHT ENTERTAINMENT AND CONNECTIVITY MARKET, BY OFFERING, 2026–2031 (USD MILLION)


TABLE 122
SOUTH KOREA: IN-FLIGHT ENTERTAINMENT AND CONNECTIVITY MARKET, BY END USE, 2021–2025 (USD MILLION)


TABLE 123
SOUTH KOREA: IN-FLIGHT ENTERTAINMENT AND CONNECTIVITY MARKET, BY END USE, 2026–2031 (USD MILLION)


TABLE 124
REST OF ASIA PACIFIC: IN-FLIGHT ENTERTAINMENT AND CONNECTIVITY MARKET, BY OFFERING, 2021–2025 (USD MILLION)


TABLE 125
REST OF ASIA PACIFIC: IN-FLIGHT ENTERTAINMENT AND CONNECTIVITY MARKET, BY OFFERING, 2026–2031 (USD MILLION)


TABLE 126
REST OF ASIA PACIFIC: IN-FLIGHT ENTERTAINMENT AND CONNECTIVITY MARKET, BY END USE, 2021–2025 (USD MILLION)


TABLE 127
REST OF ASIA PACIFIC: IN-FLIGHT ENTERTAINMENT AND CONNECTIVITY MARKET, BY END USE, 2026–2031 (USD MILLION)


TABLE 128
MIDDLE EAST & AFRICA: IN-FLIGHT ENTERTAINMENT AND CONNECTIVITY MARKET, BY COUNTRY, 2021–2025 (USD MILLION)


TABLE 129
MIDDLE EAST & AFRICA: IN-FLIGHT ENTERTAINMENT AND CONNECTIVITY MARKET, BY COUNTRY, 2026–2031 (USD MILLION)


TABLE 130
MIDDLE EAST & AFRICA: IN-FLIGHT ENTERTAINMENT AND CONNECTIVITY MARKET, BY OFFERING, 2021–2025 (USD MILLION)


TABLE 131
MIDDLE EAST & AFRICA: IN-FLIGHT ENTERTAINMENT AND CONNECTIVITY MARKET, BY OFFERING, 2026–2031 (USD MILLION)


TABLE 132
MIDDLE EAST & AFRICA: IN-FLIGHT ENTERTAINMENT AND CONNECTIVITY MARKET, BY END USE, 2021–2025 (USD MILLION)


TABLE 133
MIDDLE EAST & AFRICA: IN-FLIGHT ENTERTAINMENT AND CONNECTIVITY MARKET, BY END USE, 2026–2031 (USD MILLION)


TABLE 134
UAE: IN-FLIGHT ENTERTAINMENT AND CONNECTIVITY MARKET, BY OFFERING, 2021–2025 (USD MILLION)


TABLE 135
UAE: IN-FLIGHT ENTERTAINMENT AND CONNECTIVITY MARKET, BY OFFERING, 2026–2031 (USD MILLION)


TABLE 136
UAE: IN-FLIGHT ENTERTAINMENT AND CONNECTIVITY MARKET, BY END USE, 2021–2025 (USD MILLION)


TABLE 137
UAE: IN-FLIGHT ENTERTAINMENT AND CONNECTIVITY MARKET, BY END USE, 2026–2031 (USD MILLION)


TABLE 138
SAUDI ARABIA: IN-FLIGHT ENTERTAINMENT AND CONNECTIVITY MARKET, BY OFFERING, 2021–2025 (USD MILLION)


TABLE 139
SAUDI ARABIA: IN-FLIGHT ENTERTAINMENT AND CONNECTIVITY MARKET, BY OFFERING, 2026–2031 (USD MILLION)


TABLE 140
SAUDI ARABIA: IN-FLIGHT ENTERTAINMENT AND CONNECTIVITY MARKET, BY END USE, 2021–2025 (USD MILLION)


TABLE 141
SAUDI ARABIA: IN-FLIGHT ENTERTAINMENT AND CONNECTIVITY MARKET, BY END USE, 2026–2031 (USD MILLION)


TABLE 142
QATAR: IN-FLIGHT ENTERTAINMENT AND CONNECTIVITY MARKET, BY OFFERING, 2021–2025 (USD MILLION)


TABLE 143
QATAR: IN-FLIGHT ENTERTAINMENT AND CONNECTIVITY MARKET, BY OFFERING, 2026–2031 (USD MILLION)


TABLE 144
QATAR: IN-FLIGHT ENTERTAINMENT AND CONNECTIVITY MARKET, BY END USE, 2021–2025 (USD MILLION)


TABLE 145
QATAR: IN-FLIGHT ENTERTAINMENT AND CONNECTIVITY MARKET, BY END USE, 2026–2031 (USD MILLION)


TABLE 146
TURKEY: IN-FLIGHT ENTERTAINMENT AND CONNECTIVITY MARKET, BY OFFERING, 2021–2025 (USD MILLION)


TABLE 147
TURKEY: IN-FLIGHT ENTERTAINMENT AND CONNECTIVITY MARKET, BY OFFERING, 2026–2031 (USD MILLION)


TABLE 148
TURKEY: IN-FLIGHT ENTERTAINMENT AND CONNECTIVITY MARKET, BY END USE, 2021–2025 (USD MILLION)


TABLE 149
TURKEY: IN-FLIGHT ENTERTAINMENT AND CONNECTIVITY MARKET, BY END USE, 2026–2031 (USD MILLION)


TABLE 150
SOUTH AFRICA: IN-FLIGHT ENTERTAINMENT AND CONNECTIVITY MARKET, BY OFFERING, 2021–2025 (USD MILLION)


TABLE 151
SOUTH AFRICA: IN-FLIGHT ENTERTAINMENT AND CONNECTIVITY MARKET, BY OFFERING, 2026–2031 (USD MILLION)


TABLE 152
SOUTH AFRICA: IN-FLIGHT ENTERTAINMENT AND CONNECTIVITY MARKET, BY END USE, 2021–2025 (USD MILLION)


TABLE 153
SOUTH AFRICA: IN-FLIGHT ENTERTAINMENT AND CONNECTIVITY MARKET, BY END USE, 2026–2031 (USD MILLION)


TABLE 154
LATIN AMERICA: IN-FLIGHT ENTERTAINMENT AND CONNECTIVITY MARKET, BY COUNTRY, 2021–2025 (USD MILLION)


TABLE 155
LATIN AMERICA: IN-FLIGHT ENTERTAINMENT AND CONNECTIVITY MARKET, BY COUNTRY, 2026–2031 (USD MILLION)


TABLE 156
LATIN AMERICA: IN-FLIGHT ENTERTAINMENT AND CONNECTIVITY MARKET, BY OFFERING, 2021–2025 (USD MILLION)


TABLE 157
LATIN AMERICA: IN-FLIGHT ENTERTAINMENT AND CONNECTIVITY MARKET, BY OFFERING, 2026–2031 (USD MILLION)


TABLE 158
LATIN AMERICA: IN-FLIGHT ENTERTAINMENT AND CONNECTIVITY MARKET, BY END USE, 2021–2025 (USD MILLION)


TABLE 159
LATIN AMERICA: IN-FLIGHT ENTERTAINMENT AND CONNECTIVITY MARKET, BY END USE, 2026–2031 (USD MILLION)


TABLE 160
BRAZIL: IN-FLIGHT ENTERTAINMENT AND CONNECTIVITY MARKET, BY OFFERING, 2021–2025 (USD MILLION)


TABLE 161
BRAZIL: IN-FLIGHT ENTERTAINMENT AND CONNECTIVITY MARKET, BY OFFERING, 2026–2031 (USD MILLION)


TABLE 162
BRAZIL: IN-FLIGHT ENTERTAINMENT AND CONNECTIVITY MARKET, BY END USE, 2021–2025 (USD MILLION)


TABLE 163
BRAZIL: IN-FLIGHT ENTERTAINMENT AND CONNECTIVITY MARKET, BY END USE, 2026–2031 (USD MILLION)


TABLE 164
MEXICO: IN-FLIGHT ENTERTAINMENT AND CONNECTIVITY MARKET, BY OFFERING, 2021–2025 (USD MILLION)


TABLE 165
MEXICO: IN-FLIGHT ENTERTAINMENT AND CONNECTIVITY MARKET, BY OFFERING, 2026–2031 (USD MILLION)


TABLE 166
MEXICO: IN-FLIGHT ENTERTAINMENT AND CONNECTIVITY MARKET, BY END USE, 2021–2025 (USD MILLION)


TABLE 167
MEXICO: IN-FLIGHT ENTERTAINMENT AND CONNECTIVITY MARKET, BY END USE, 2026–2031 (USD MILLION)


TABLE 168
REST OF LATIN AMERICA: IN-FLIGHT ENTERTAINMENT AND CONNECTIVITY MARKET, BY OFFERING, 2021–2025 (USD MILLION)


TABLE 169
REST OF LATIN AMERICA: IN-FLIGHT ENTERTAINMENT AND CONNECTIVITY MARKET, BY OFFERING, 2026–2031 (USD MILLION)


TABLE 170
REST OF LATIN AMERICA: IN-FLIGHT ENTERTAINMENT AND CONNECTIVITY MARKET, BY END USE, 2021–2025 (USD MILLION)


TABLE 171
REST OF LATIN AMERICA: IN-FLIGHT ENTERTAINMENT AND CONNECTIVITY MARKET, BY END USE, 2026–2031 (USD MILLION)


TABLE 172
KEY PLAYER STRATEGIES, 2025


TABLE 173
IN-FLIGHT ENTERTAINMENT AND CONNECTIVITY MARKET: DEGREE OF COMPETITION


TABLE 174
IN-FLIGHT ENTERTAINMENT AND CONNECTIVITY MARKET: REGION FOOTPRINT


TABLE 175
IN-FLIGHT ENTERTAINMENT AND CONNECTIVITY MARKET: OFFERING FOOTPRINT


TABLE 176
IN-FLIGHT ENTERTAINMENT AND CONNECTIVITY MARKET: PLATFORM FOOTPRINT


TABLE 177
IN-FLIGHT ENTERTAINMENT AND CONNECTIVITY MARKET: END USE FOOTPRINT


TABLE 178
IN-FLIGHT ENTERTAINMENT AND CONNECTIVITY MARKET: LIST OF STARTUPS/SMES


TABLE 179
IN-FLIGHT ENTERTAINMENT AND CONNECTIVITY MARKET: COMPETITIVE BENCHMARKING


TABLE 180
IN-FLIGHT ENTERTAINMENT AND CONNECTIVITY MARKET: PRODUCT LAUNCHES, JANUARY 2021–SEPTEMBER 2026


TABLE 181
IN-FLIGHT ENTERTAINMENT AND CONNECTIVITY MARKET: DEALS, JANUARY 2021–SEPTEMBER 2026


TABLE 182
IN-FLIGHT ENTERTAINMENT AND CONNECTIVITY MARKET: OTHER DEVELOPMENTS, JANUARY 2021–SEPTEMBER 2026


TABLE 183
PANASONIC AVIONICS CORPORATION: COMPANY OVERVIEW


TABLE 184
PANASONIC AVIONICS CORPORATION: PRODUCTS/SOLUTIONS/ SERVICES OFFERED


TABLE 185
PANASONIC AVIONICS CORPORATION: PRODUCT LAUNCHES AND DEVELOPMENTS


TABLE 186
PANASONIC AVIONICS CORPORATION: DEALS


TABLE 187
PANASONIC AVIONICS CORPORATION: OTHER DEVELOPMENTS


TABLE 188
PANASONIC AVIONICS CORPORATION: EXPANSIONS


TABLE 189
THALES: COMPANY OVERVIEW


TABLE 190
THALES: PRODUCTS/SOLUTIONS/SERVICES OFFERED


TABLE 191
THALES : PRODUCT LAUNCHES AND DEVELOPMENTS


TABLE 192
THALES: DEALS


TABLE 193
THALES: OTHER DEVELOPMENTS


TABLE 194
ANUVU: COMPANY OVERVIEW


TABLE 195
ANUVU: PRODUCTS/SOLUTIONS/SERVICES OFFERED


TABLE 196
ANUVU: PRODUCT LAUNCHES AND DEVELOPMENTS


TABLE 197
ANUVU: DEALS


TABLE 198
ANUVU: OTHER DEVELOPMENTS


TABLE 199
COLLINS AEROSPACE: COMPANY OVERVIEW


TABLE 200
COLLINS AEROSPACE: PRODUCTS/SOLUTIONS/SERVICES OFFERED


TABLE 201
COLLINS AEROSPACE: PRODUCT LAUNCHES AND DEVELOPMENTS AND DEVELOPMENTS


TABLE 202
COLLINS AEROSPACE: DEALS


TABLE 203
COLLINS AEROSPACE : OTHER DEVELOPMENTS


TABLE 204
ASTRONICS CORPORATION: COMPANY OVERVIEW


TABLE 205
ASTRONICS CORPORATION: PRODUCTS/SOLUTIONS/SERVICES OFFERED


TABLE 206
ASTRONICS : PRODUCT LAUNCHES AND DEVELOPMENTS


TABLE 207
ASTRONICS CORPORATION: DEALS


TABLE 208
ASTRONICS CORPORATION: OTHER DEVELOPMENTS


TABLE 209
VIASAT, INC.: COMPANY OVERVIEW


TABLE 210
VIASAT, INC.: PRODUCTS/SOLUTIONS/SERVICES OFFERED


TABLE 211
VIASAT : PRODUCT LAUNCHES AND DEVELOPMENTS


TABLE 212
VIASAT, INC.: DEALS


TABLE 213
VIASAT, INC.: EXPANSIONS


TABLE 214
VIASAT, INC.: OTHER DEVELOPMENTS


TABLE 215
GOGO BUSINESS AVIATION, LLC: COMPANY OVERVIEW


TABLE 216
GOGO BUSINESS AVIATION, LLC: PRODUCTS/SOLUTIONS/SERVICES OFFERED


TABLE 217
GOGO BUSINESS AVIATION, LLC: PRODUCT LAUNCHES AND DEVELOPMENTS


TABLE 218
GOGO BUSINESS AVIATION LLC: DEALS


TABLE 219
GOGO BUSINESS AVIATION LLC: EXPANSIONS


TABLE 220
GOGO BUSINESS AVIATION LLC: OTHER DEVELOPMENTS


TABLE 221
SAFRAN: COMPANY OVERVIEW


TABLE 222
SAFRAN: PRODUCTS/SOLUTIONS/SERVICES OFFERED


TABLE 223
SAFRAN : PRODUCT LAUNCHES AND DEVELOPMENTS


TABLE 224
SAFRAN: DEALS


TABLE 225
SAFRAN: OTHER DEVELOPMENTS


TABLE 226
HONEYWELL INTERNATIONAL INC.: COMPANY OVERVIEW


TABLE 227
HONEYWELL INTERNATIONAL INC.: PRODUCTS/SOLUTIONS/SERVICES OFFERED


TABLE 228
HONEYWELL INTERNATIONAL INC.: PRODUCT LAUNCHES AND DEVELOPMENTS


TABLE 229
HONEYWELL INTERNATIONAL INC.: DEALS


TABLE 230
SITA: COMPANY OVERVIEW


TABLE 231
SITA: PRODUCTS/SOLUTIONS/SERVICES OFFERED


TABLE 232
SITA: DEALS


TABLE 233
SITA: OTHER DEVELOPMENTS


TABLE 234
ECA GROUP: COMPANY OVERVIEW


TABLE 235
ECA GROUP: PRODUCTS/SOLUTIONS/SERVICES OFFERED


TABLE 236
ECA GROUP: PRODUCT LAUNCHES AND DEVELOPMENTS


TABLE 237
ECA GROUP: DEALS


TABLE 238
IRIDIUM COMMUNICATIONS INC.: COMPANY OVERVIEW


TABLE 239
IRIDIUM COMMUNICATIONS INC.: PRODUCTS/SOLUTIONS/SERVICES OFFERED


TABLE 240
LUFTHANSA SYSTEMS: COMPANY OVERVIEW


TABLE 241
LUFTHANSA SYSTEMS: PRODUCTS/SOLUTIONS/SERVICES OFFERED


TABLE 242
LUFTHANSA SYSTEMS: DEALS


TABLE 243
LUFTHANSA SYSTEMS: OTHER DEVELOPMENTS


TABLE 244
AERQ: COMPANY OVERVIEW


TABLE 245
AERQ: PRODUCTS/SOLUTIONS/SERVICES OFFERED


TABLE 246
AERQ: DEALS


TABLE 247
AERQ: OTHER DEVELOPMENTS


TABLE 248
BLUEBOX AVIATION SYSTEMS LTD.: COMPANY OVERVIEW


TABLE 249
BLUEBOX AVIATION SYSTEMS LTD.: PRODUCTS/SOLUTIONS/SERVICES OFFERED


TABLE 250
BLUEBOX AVIATION SYSTEMS LTD: PRODUCT LAUNCHES AND DEVELOPMENTS


TABLE 251
BLUEBOX AVIATION SYSTEMS LTD.: DEALS


TABLE 252
BLUEBOX AVIATION SYSTEMS LTD.: OTHER DEVELOPMENTS


TABLE 253
EUTELSAT COMMUNICATIONS SA: COMPANY OVERVIEW


TABLE 254
IMFFLY: COMPANY OVERVIEW


TABLE 255
IDEANOVA TECHNOLOGIES, INC.: COMPANY OVERVIEW


TABLE 256
INFLIGHT VR SOFTWARE GMBH: COMPANY OVERVIEW


TABLE 257
SMARTSKY NETWORKS, LLC.: COMPANY OVERVIEW


TABLE 258
ARGONFDS: COMPANY OVERVIEW


TABLE 259
AEROPLAY ENTERTAINMENT: COMPANY OVERVIEW


TABLE 260
IMAGIK INTERNATIONAL CORP.: COMPANY OVERVIEW


TABLE 261
SPAFAX: COMPANY OVERVIEW


TABLE 262
BURRANA: COMPANY OVERVIEW


TABLE 263
PRIMARY SOURCES


LIST OF FIGURES


FIGURE 1
MARKET SCENARIO


FIGURE 2
IN-FLIGHT ENTERTAINMENT AND CONNECTIVITY MARKET, 2021–2031


FIGURE 3
MAJOR STRATEGIES ADOPTED BY KEY PLAYERS IN IN-FLIGHT ENTERTAINMENT AND CONNECTIVITY MARKET


FIGURE 4
DISRUPTIONS INFLUENCING GROWTH OF IN-FLIGHT ENTERTAINMENT AND CONNECTIVITY MARKET


FIGURE 5
HIGH-GROWTH SEGMENTS IN IN-FLIGHT ENTERTAINMENT AND CONNECTIVITY MARKET


FIGURE 6
LATIN AMERICA TO BE FASTEST-GROWING MARKET DURING FORECAST PERIOD


FIGURE 7
FLEET MODERNIZATION AND HIGH-SPEED CONNECTIVITY TO DRIVE GROWTH IN IN-FLIGHT ENTERTAINMENT AND CONNECTIVITY MARKET


FIGURE 8
IN-FLIGHT ENTERTAINMENT TO HOLD LARGER SHARE THAN IN-FLIGHT CONNECTIVITY IN 2026


FIGURE 9
NARROW-BODY AIRCRAFT TO SURPASS OTHER SEGMENTS DURING FORECAST PERIOD


FIGURE 10
OEM SEGMENT TO EXHIBIT FASTER GROWTH DURING FORECAST PERIOD


FIGURE 11
BUSINESS CLASS TO SECURE LEADING POSITION IN 2026


FIGURE 12
IN-FLIGHT ENTERTAINMENT AND CONNECTIVITY MARKET: DRIVERS, RESTRAINTS, OPPORTUNITIES, AND CHALLENGES


FIGURE 13
ECOSYSTEM ANALYSIS


FIGURE 14
VALUE CHAIN ANALYSIS


FIGURE 15
AVERAGE SELLING PRICE, BY OFFERING, 2025


FIGURE 16
IMPORT DATA FOR HS CODE 852872 -COMPLIANT PRODUCTS, BY COUNTRY, 2021–2025 (USD THOUSAND)


FIGURE 17
EXPORT DATA FOR HS CODE 852872 -COMPLIANT PRODUCTS, BY COUNTRY, 2021–2025 (USD THOUSAND)


FIGURE 18
IMPORT DATA FOR HS CODE 851762 -COMPLIANT PRODUCTS, BY COUNTRY, 2021–2025 (USD THOUSAND)


FIGURE 19
EXPORT DATA FOR HS CODE 851762 -COMPLIANT PRODUCTS, BY COUNTRY, 2021–2025 (USD THOUSAND)


FIGURE 20
INVESTMENT & FUNDING SCENARIO, 2021–2025 (USD MILLION)


FIGURE 21
TRENDS & DISRUPTIONS IMPACTING CUSTOMER BUSINESS


FIGURE 22
NEW AIRCRAFT ORDERS BY OEMS, 2023-2025 (UNITS)


FIGURE 23
NEW AIRCRAFT ORDERS, BY AIRCRAFT TYPE, 2022-2024 (UNITS)


FIGURE 24
TOTAL COST OF OWNERSHIP


FIGURE 25
TOTAL COST OF OWNERSHIP, BY PLATFORM


FIGURE 26
BILL OF MATERIALS ANALYSIS FOR DISPLAY UNITS


FIGURE 27
BILL OF MATERIALS ANALYSIS FOR CONTROL UNITS


FIGURE 28
BILL OF MATERIALS ANALYSIS FOR CONTENT SERVERS


FIGURE 29
BILL OF MATERIALS ANALYSIS FOR SATELLITE COMMUNICATION SYSTEMS


FIGURE 30
BILL OF MATERIALS ANALYSIS FOR ONBOARD NETWORK EQUIPMENT


FIGURE 31
TECHNOLOGY ROADMAP


FIGURE 32
IMPACT OF AI/GENERATIVE AI


FIGURE 33
PATENT ANALYSIS, 2016-2026


FIGURE 34
FUTURE APPLICATIONS


FIGURE 35
IN-FLIGHT ENTERTAINMENT AND CONNECTIVITY MARKET: DECISION-MAKING FACTORS


FIGURE 36
INFLUENCE OF STAKEHOLDERS ON BUYING PROCESS, BY END USE


FIGURE 37
KEY BUYING CRITERIA , BY END USE


FIGURE 38
ADOPTION BARRIERS & INTERNAL CHALLENGES


FIGURE 39
IN-FLIGHT ENTERTAINMENT AND CONNECTIVITY MARKET, BY OFFERING, 2026–2031 (USD MILLION)


FIGURE 40
IN-FLIGHT ENTERTAINMENT AND CONNECTIVITY MARKET, BY END USE, 2026–2031 (USD MILLION)


FIGURE 41
IN-FLIGHT ENTERTAINMENT AND CONNECTIVITY MARKET, BY PLATFORM, 2026–2031 (USD MILLION)


FIGURE 42
IN-FLIGHT ENTERTAINMENT AND CONNECTIVITY MARKET, BY CLASS, 2026–2031 (USD MILLION)


FIGURE 43
IN-FLIGHT ENTERTAINMENT AND CONNECTIVITY MARKET, BY REGION, 2026-2031


FIGURE 44
NORTH AMERICA: IN-FLIGHT ENTERTAINMENT AND CONNECTIVITY MARKET SNAPSHOT


FIGURE 45
EUROPE: IN-FLIGHT ENTERTAINMENT AND CONNECTIVITY MARKET SNAPSHOT


FIGURE 46
ASIA PACIFIC: IN-FLIGHT ENTERTAINMENT AND CONNECTIVITY MARKET SNAPSHOT


FIGURE 47
MIDDLE EAST & AFRICA: IN-FLIGHT ENTERTAINMENT AND CONNECTIVITY MARKET SNAPSHOT


FIGURE 48
LATIN AMERICA: IN-FLIGHT ENTERTAINMENT AND CONNECTIVITY MARKET SNAPSHOT


FIGURE 49
REVENUE ANALYSIS OF TOP 5 PLAYERS, 2021–2025


FIGURE 50
MARKET SHARE ANALYSIS OF KEY PLAYERS, 2025


FIGURE 51
IN-FLIGHT ENTERTAINMENT AND CONNECTIVITY MARKET: COMPANY EVALUATION MATRIX, 2025


FIGURE 52
IN-FLIGHT ENTERTAINMENT AND CONNECTIVITY MARKET: COMPANY FOOTPRINT


FIGURE 53
IN-FLIGHT ENTERTAINMENT AND CONNECTIVITY MARKET: STARTUP/ SME EVALUATION MATRIX, 2025


FIGURE 54
COMPANY VALUATION, 2026


FIGURE 55
FINANCIAL METRICS, 2026


FIGURE 56
BRAND COMPARISON


FIGURE 57
PANASONIC AVIONICS CORPORATION: COMPANY SNAPSHOT


FIGURE 58
THALES: COMPANY SNAPSHOT


FIGURE 59
COLLINS AEROSPACE: COMPANY SNAPSHOT


FIGURE 60
ASTRONICS CORPORATION : COMPANY SNAPSHOT


FIGURE 61
VIASAT, INC.: COMPANY SNAPSHOT


FIGURE 62
GOGO BUSINESS AVIATION, LLC: COMPANY SNAPSHOT


FIGURE 63
SAFRAN: COMPANY SNAPSHOT


FIGURE 64
HONEYWELL INTERNATIONAL INC.: COMPANY SNAPSHOT


FIGURE 65
IRIDIUM COMMUNICATIONS INC.: COMPANY SNAPSHOT


FIGURE 66
LUFTHANSA SYSTEMS: COMPANY SNAPSHOT


FIGURE 67
RESEARCH PROCESS FLOW


FIGURE 68
RESEARCH DESIGN


FIGURE 69
BREAKDOWN OF PRIMARY INTERVIEWS: BY COMPANY TYPE, DESIGNATION, AND REGION


FIGURE 70
KEY DATA FROM PRIMARY SOURCES


FIGURE 71
G7 AND BRICS SHARE IN GLOBAL GDP AT PURCHASING POWER PARITY, 1995–2025


FIGURE 72
BOTTOM-UP APPROACH


FIGURE 73
TOP-DOWN APPROACH


FIGURE 74
DATA TRIANGULATION


FIGURE 75
RESEARCH ASSUMPTIONS


Methodology

The study involved four major activities to estimate the current size of the in-flight entertainment and connectivity market. Exhaustive secondary research was conducted to gather information on the in-flight entertainment and connectivity market, its adjacent markets, and its parent market. The next step was to validate these findings, assumptions, and sizing with industry experts across the value chain through primary research. Demand-side analysis was conducted to estimate the overall market size. Thereafter, data triangulation procedures were employed to estimate the sizes of various segments and subsegments within the in-flight entertainment and connectivity market.

Secondary Research

During the secondary research process, various sources were consulted to identify and collect information for this study. The secondary sources included government sources, such as SIPRI; corporate filings, including annual reports, press releases, and investor presentations; white papers, journals, and certified publications; and articles from recognized authors, directories, and databases.

Primary Research

Extensive primary research was conducted after acquiring information on the in-flight entertainment and connectivity market through secondary research. Several primary interviews were conducted with market experts from the demand and supply sides across major countries of North America, Europe, Asia Pacific, the Middle East & Africa, and Latin America. Primary data was collected through questionnaires, emails, and telephonic interviews.

Breakdown of Primary Interviews
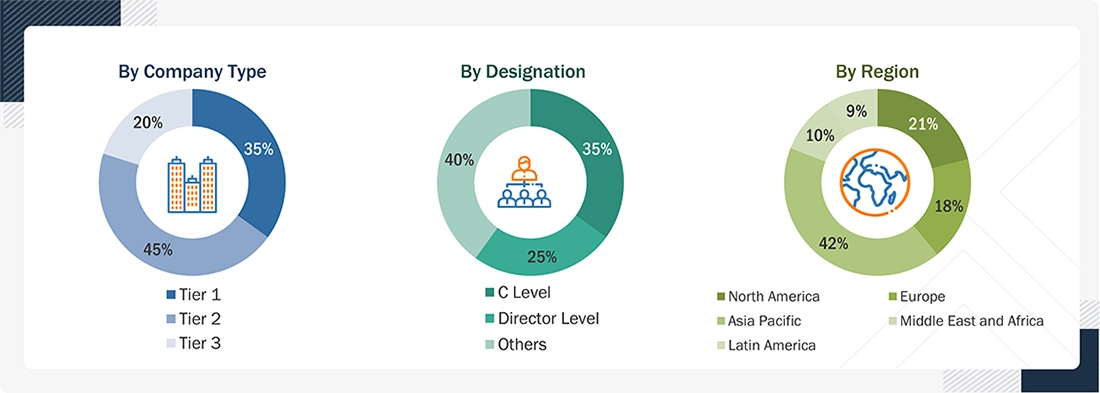
In-flight Entertainment & Connectivity Market Size, and Share

Note: The three tiers of companies are defined based on their total revenue in 2025: Tier 1 - revenue greater than or equal to USD 1 billion; Tier 2 - revenue between USD 100 million and USD 1 billion; and Tier 3 - revenue less than or equal to USD 100 million. Other designations include sales managers, marketing managers, and product managers.

To know about the assumptions considered for the study, download the pdf brochure

Market Size Estimation

Top-down and bottom-up approaches were used to estimate and validate the size of the in-flight entertainment and connectivity market. The research methodology used to estimate the size of the market included the following details:

  • Key players in the in-flight entertainment and connectivity market were identified through secondary research, and their market shares were determined through a combination of primary and secondary research. This included a study of the annual and financial reports of the top market players, as well as extensive interviews with leaders, including directors, engineers, marketing executives, and other key stakeholders of leading companies operating in the market.
  • All percentage shares, splits, and breakdowns were determined using secondary sources and verified through primary sources.
  • All possible parameters that affect the markets covered in this research study were accounted for, viewed in extensive detail, verified through primary research, and analyzed to obtain the final quantitative and qualitative data on the in-flight entertainment and connectivity market. This data was consolidated, enhanced with detailed input, analyzed by MarketsandMarkets, and presented in this report.

In-flight Entertainment & Connectivity Market  : Top-Down and Bottom-Up Approach
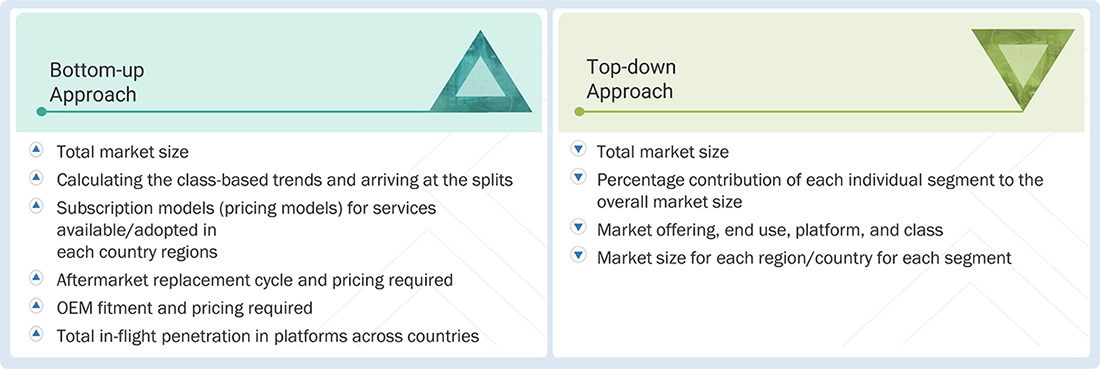
In-flight Entertainment & Connectivity Market Top Down and Bottom Up Approach

Data Triangulation

After determining the overall market size, the total market was classified into several segments and subsegments. The data triangulation and market breakdown procedures explained below were implemented, wherever applicable, to complete the overall market engineering process and arrive at the estimated market numbers for the market segments and subsegments. The data were triangulated by examining various factors and trends on both the demand and supply sides. Additionally, the market size was validated using top-down and bottom-up approaches.

Market Definition

The in-flight entertainment and connectivity (IFEC) market encompasses a range of products and services designed to enhance passenger experiences on commercial flights, including audio and video on demand, live TV, games, moving maps, digital reading materials, and various connectivity options like Wi-Fi and mobile phone services. It involves hardware such as seat-back screens and connectivity equipment, as well as software for content management and user interfaces. Service providers include content suppliers, connectivity providers, and system integrators. Driven by technological advancements and passenger demand for enhanced experiences, the market is seeing trends like personalized content, hybrid systems combining seat-back screens with personal device streaming, and improved connectivity through advancements in satellite and 5G technology.

Key Stakeholders

  • Aerostructure Manufacturers
  • In-flight Entertainment and Connectivity Solution Developers
  • In-flight Entertainment and Connectivity Service Providers
  • Subcomponent Suppliers
  • Technology Providers
  • Airlines
  • Government Agencies
  • Investors and Financial Community Professionals
  • Research Organizations

Report Objectives

  • To define, describe, and forecast the in-flight entertainment and connectivity market based on offering, end use, platform, class, and region in terms of value
  • To forecast the size of various segments of the market across North America, Europe, Asia Pacific, the Middle East & Africa, and Latin America in terms of value
  • To identify and analyze the drivers, restraints, opportunities, and challenges influencing the growth of the market
  • To identify industry trends, market trends, and technology trends currently prevailing in the market
  • To analyze micromarkets with respect to growth trends, prospects, and their contribution to the overall market
  • To analyze opportunities in the market for stakeholders by identifying key market trends
  • To profile key market players and comprehensively analyze their market share and core competencies
  • To evaluate the degree of competition in the market by analyzing recent developments, such as contracts, agreements, and acquisitions, adopted by leading market players
  • To identify detailed financial positions, key products, and unique selling points of leading companies in the market
  • To provide a detailed competitive landscape of the market, along with market share analysis and revenue analysis of key players

Available customizations:

MarketsandMarkets offers the following customizations for this market report:

  • Additional country-level analysis of the in-flight entertainment and connectivity market
  • Profiling of other market players (up to five)

Product Analysis

  • Product matrix, which provides a detailed comparison of the product portfolios of each company in the in-flight entertainment and connectivity market


Key Questions Addressed by the Report

What is the projected size of the global In Flight Entertainment and Connectivity Market by 2031?

The global In Flight Entertainment and Connectivity Market was valued at USD 9.50 billion in 2026 and is projected to reach USD 13.20 billion by 2031, growing at a CAGR of 6.8% from 2026 to 2031. Growth is driven by increasing passenger demand for digital entertainment, reliable onboard connectivity, and the deployment of satellite and hybrid connectivity solutions.

What are the major factors driving the In Flight Entertainment and Connectivity Market?

The rising use of personal devices among passengers and the shift toward cloud services are major market drivers. Increasing demand for Wi Fi, streaming, device based entertainment, and digital passenger services is encouraging airlines to expand connected onboard experiences.

Which region is expected to grow the fastest in the IFEC Market?

Latin America is expected to register the highest CAGR during the forecast period. Growth is supported by increasing passenger traffic, airline capacity, international and domestic air travel, aircraft modernization, and rising demand for reliable Wi Fi and streaming services.

Which offering segment is expected to experience the highest growth?

The in flight entertainment segment is set to experience a high growth rate of 7.1% during the forecast period. Demand is supported by airline investment in modern entertainment systems, on demand content, personal device access, and personalized digital passenger services.

Which end use segment is expected to experience the highest growth?

The OEM segment is set to experience a high growth rate of 7.4% during the forecast period. Its growth is supported by the increasing installation of IFEC systems during aircraft manufacturing and airline preference for factory installed connectivity, entertainment, cabin networking, and digital passenger systems.

Which aircraft platform segment dominates the IFEC Market?

Narrow body aircraft hold a dominant market position and are expected to register the highest CAGR. Their large and expanding fleet, use on short and medium haul routes, and increasing adoption of wireless IFE, high speed Wi Fi, and personal device connectivity are supporting growth.

Which passenger class segment is expected to grow the fastest?

The business class segment is set to register the highest CAGR in the IFEC market. Airlines are investing in premium cabin experiences with high speed connectivity, advanced entertainment, larger displays, personal device connectivity, and personalized digital services.

What are the major technology trends shaping the IFEC Market?

The market is shifting from traditional hardware focused IFE toward connected and software enabled passenger experiences. Key trends include satellite based, LEO, multi orbit, and hybrid connectivity, cloud based IFE platforms, AI based personalization, digital retail, connected cabin applications, and personal device integration.

What are the major opportunities in the In Flight Entertainment and Connectivity Market?

Growing collaborations between airlines, IFEC providers, and content platforms represent a major opportunity. Such partnerships can support streaming services, personalized entertainment, continuously updated content, and new digital passenger services across seatback systems and personal devices.

Which companies are the key players in the IFEC Market?

Key players include Panasonic Corporation of North America, Thales, Anuvu, RTX, and Astronics Corporation. Panasonic Avionics Corporation and Thales are among the major market players, while Panasonic is categorized as a Star and Safran as an Emerging Leader in the company evaluation matrix.

Personalize This Research

  • Triangulate with your Own Data
  • Get Data as per your Format and Definition
  • Gain a Deeper Dive on a Specific Application, Geography, Customer or Competitor
  • Any level of Personalization
Request A Free Customisation

Let Us Help You

  • What are the Known and Unknown Adjacencies Impacting the In-flight Entertainment & Connectivity Market

  • What will your New Revenue Sources be?
  • Who will be your Top Customer; what will make them switch?
  • Defend your Market Share or Win Competitors
  • Get a Scorecard for Target Partners
Customized Workshop Request

Custom Market Research Services

We Will Customise The Research For You, In Case The Report Listed Above Does Not Meet With Your Requirements

Get 10% Free Customisation

TESTIMONIALS

Growth opportunities and latent adjacency in In-flight Entertainment & Connectivity Market

avtar

Abhilash

Jan, 2026

I am a IFE distributer from India want more companies for business collaboration .

avtar

Anirudh

Mar, 2019

Trying to assess the value chain revenue share and profitability for the in-flight connectivity market..

avtar

spencer

Jan, 2019

I am curious to learn more about in-flight entertainment in the airline industry. How can I gain access to this report?.

DMCA.com Protection Status
popup img