Genome Editing Market

Genome Editing Market Growth by Technology (CRISPR, TALEN, ZFN, Antisense), Product & Service, Application (Cell Line Engineering, Genetic Engineering, Diagnostics), End user (Pharmaceutical, Biotechnology, Academia) - Global Forecast to 2026

Report Code: BT 3380 Nov, 2021, by marketsandmarkets.com

Instant Answers with GPT - Ask Now!

Ask real questions. Get complete answers !

The global Genome Editing Market boasts a total value of $5.1 billion in 2021 and is projected to register a growth rate of 18.2% to reach a value of $11.7 billion by 2026. Recent developments in this field have led to significant improvements in the genome editing capabilities that have enabled the modification of gene sequences of interest in a wide variety of cell types and model organisms. Genome editing has also been progressing in its application for cell-line development wherein the cell lines are improved for better expression of therapeutic proteins with desired post translational modifications. Genome engineering, earlier used by large research organizations, such as academic and government research centers, has now become a potentially transformative diagnostic tool, especially for oncology studies. This shift from academics to clinical and diagnostic laboratories is primarily driven by rapid improvements in gene editing technologies.

Genome Editing Market

To know about the assumptions considered for the study, Request for Free Sample Report

Genome Editing Market Dynamics

Drivers: Rise in government funding and growth in the number of genomics projects

In recent years, governments in various countries across the globe have made significant investments in the field of genomics, which have played a major role in the development of new technologies in genome editing. Moreover, the availability of government funding has enabled academic and government institutes to carry out in-depth research related to genome editing/engineering. For instance, in March 2020, the Ministry of Innovation, Science, and Industry (Science) announced USD 15 million to support genomic research for 11 genomic research projects in the health, agriculture, and environment sectors through Genome Canada. These research projects will be supported additionally by provincial governments, businesses, and research partners, who will invest USD 29.7 million. The projects include research on ovarian and cervical cancer. Due to the significant government investments in genomics, there has been considerable growth in the number of genomics research projects. This, in turn, is expected to support the growth of the genome editing market during the forecast period.

Restraints: Off-target effects of CRISPR technology

Off-target effects are a major concern regarding CRISPR-Cas9. Since Cas9 induces double-stranded breaks, any off-target nuclease activity can cause mutations in these genes, leading to possible oncogenesis. CRISPR-Cas9 can tolerate one to three mismatches in its target, which can lead to off-target nuclease activity. Furthermore, the high frequency of off-target activity (≥50%)—mutations at sites other than the intended on-target site—is a major concern. For example, CRISPR can hit the tumor suppresser gene or activate the cancer-causing gene. Many companies that are planning clinical trials have faced issues because of this undesired effect. Clinical trials have been put on hold, and regulatory authorities are insisting on further research to enhance the safety of this method.

Opportunities: Extensive use of genome editing in personalized medicine

Growth in the personalized medicine market is expected to offer opportunities to players in the genome editing market. Personalized medicine enables medical practitioners to identify the exact needs of a patient and then prescribe medicines and treatments accordingly. The use of personalized medicine is increasing across the globe, due to its potential for cost-savings, better patient compliance, early detection of diseases, and optimization of therapies.

Challenges: High equipment costs

Genomics instruments are equipped with advanced features and functionalities and are thus priced at a premium, ranging between ~USD 10–20 million. As pharmaceutical companies and research laboratories require many such systems, their capital expenditure on procuring multiple genomic instruments is very high. It is not feasible for small and medium-sized pharmaceutical companies and research laboratories to make such high investments in multiple genomics instruments.

Similarly, academic research laboratories find it difficult to afford such systems due to budget constraints. However, technological advancements are enabling the development of affordable instruments. Therefore, the high cost of equipment may not continue to challenge market growth in the long term.

The Reagents and consumables segment dominated Genome Editing Market

Based on product & service, the genome engineering market is segmented into reagents & consumables, software & systems, and services. The reagents & consumables segment accounted for the largest share in 2020, mainly due to the repetitive purchase of reagents and consumables as well as the rising demand for and multiple uses of editing and sequencing.

Genome Editing Market by Region

To know about the assumptions considered for the study, download the pdf brochure

North America was the largest regional market for genome editing market

The genome editing market is divided into five major regions—North America, Europe, Asia Pacific, Latin America (LATAM), and the Middle East and Africa (MEA). North America accounted for the largest share of this market, followed by Europe in 2020. The key factors driving the growth of the market in North America include the development of gene therapy, increased use of GM crops, and a rise in the availability of research grants and funding in the US. The market in Canada is expected to witness growth in the coming years owing to various government initiatives and the intensification of genomics R&D (through GAPP) in the country.

Key players in this market include Thermo Fisher Scientific Inc. (US), Merck KGaA (Germany), and GenScript (China).

Scope of the Genome Editing Market Report

Report Metrics

Details

Market Size value 2026

USD 11.7 billion

Growth Rate

18.2% CAGR

Largest Market

North America

Market Dynamics

Drivers, Opportunities, Restraints & Challenges

Largest Share Segments

The Reagents and consumables, The CRISPR, The cell line engineering

Forecasts up to

2026

Market Segmentation

By Product & Service, Technology, Application, End user and Region

Genome Editing Market Growth Drivers

  • Rise in government funding and growth in the number of genomics projects
  • Increased application areas of genomics
  • Introduction of CRISPR-Cas9

Genome Editing Market Growth Opportunities

  • Extensive use of genome editing in personalized medicine
  • High growth prospects for the market in emerging countries

Geographies covered

North America, Europe, Asia Pacific, Latin America (LATAM) and Middle East and Africa (MEA)

This report categorizes the global genome editing market into the following segments and subsegments:

By Product & Service

  • Reagents & consumables
  • Software & systems
  • Services

By Technology

  • CRISPR
  • TALEN
  • ZFN
  • Antisense
  • Other technologies

By Application

  • Cell Line Engineering
  • Genetic Engineering
  • Diagnostic applications
  • Drug discovery & development
  • Other applications

By End user

  • Biotechnology companies
  • Pharmaceutical companies
  • Academic & Government Research Institutes

By Region

  • North America
    • US
    • Canada
  • Europe
    • Germany
    • UK
    • France
    • Italy
    • Spain
    • Rest of Europe (RoE)
  • Asia Pacific (APAC)
    • China
    • Japan
    • India
    • Rest of Asia Pacific (RoAPAC)
  • Latin America (LATAM)
  • Middle East and Africa (MEA)

Recent Developments:

  • In October 2021, Merck KGaA licensed its patented CRISPR-Cas9 technology to Cellecta for the development of next-generation treatments, which has allowed researchers and scientists to advance treatments for genetic blood disorders, cancers, and ophthalmological diseases.
  • In May 2019, Thermo Fisher Scientific acquired Brammer Bio to increase its global presence in the market with the addition of the expertise of Brammer Bio in the manufacturing of vectors for genes and cell therapies.

Frequently Asked Questions (FAQ):

To speak to our analyst for a discussion on the above findings, click Speak to Analyst

TABLE OF CONTENTS

1 INTRODUCTION (Page No. - 31)
    1.1 OBJECTIVES OF THE STUDY
    1.2 MARKET DEFINITION
           1.2.1 INCLUSIONS & EXCLUSIONS
    1.3 MARKET SCOPE
           1.3.1 MARKETS COVERED
           1.3.2 YEARS CONSIDERED FOR THE STUDY
    1.4 CURRENCY
    1.5 LIMITATIONS
    1.6 STAKEHOLDERS
    1.7 SUMMARY OF CHANGES

2 RESEARCH METHODOLOGY (Page No. - 35)
    2.1 RESEARCH DATA
           FIGURE 1 RESEARCH DESIGN
           2.1.1 SECONDARY DATA
           2.1.2 PRIMARY DATA
                    FIGURE 2 BREAKDOWN OF PRIMARIES: GENOME EDITING MARKET
    2.2 MARKET ESTIMATION METHODOLOGY
           FIGURE 3 GENOME EDITING MARKET SIZE ESTIMATION (SUPPLY-SIDE ANALYSIS), 2020
           FIGURE 4 MARKET SIZE ESTIMATION: APPROACH 1 (COMPANY REVENUE ANALYSIS-BASED ESTIMATION), 2020
           2.2.1 INSIGHTS FROM PRIMARY EXPERTS
                    FIGURE 5 MARKET SIZE VALIDATION FROM PRIMARY SOURCES
    2.3 MARKET GROWTH RATE PROJECTIONS
           FIGURE 6 GENOME EDITING MARKET (SUPPLY-SIDE): CAGR PROJECTIONS
           FIGURE 7 GENOME EDITING MARKET (DEMAND-SIDE): GROWTH ANALYSIS OF DEMAND-SIDE DRIVERS
    2.4 DATA TRIANGULATION
           FIGURE 8 DATA TRIANGULATION METHODOLOGY
    2.5 RESEARCH ASSUMPTIONS
           2.5.1 COVID-19 SPECIFIC ASSUMPTIONS
    2.6 RISK ANALYSIS

3 EXECUTIVE SUMMARY (Page No. - 44)
    FIGURE 9 GENOME EDITING MARKET, BY PRODUCT & SERVICE, 2021 VS. 2026 (USD MILLION)
    FIGURE 10 GENOME EDITING MARKET, BY TECHNOLOGY  2021 VS. 2026 (USD MILLION)
    FIGURE 11 GENOME EDITING/GENOME ENGINEERING, BY APPLICATION,  2021 VS. 2026 (USD MILLION)
    FIGURE 12 GENOME EDITING MARKET, BY END USER  2021 VS. 2026 (USD MILLION)
    FIGURE 13 GEOGRAPHICAL SNAPSHOT: GENOME EDITING MARKET

4 PREMIUM INSIGHTS (Page No. - 48)
    4.1 GENOME EDITING MARKET OVERVIEW
           FIGURE 14 GROWING INVESTMENTS IN GENOMICS RESEARCH TO DRIVE MARKET GROWTH
    4.2 NORTH AMERICA: GENOME EDITING/GENOME ENGINEERING SHARE, BY PRODUCT & SERVICE AND COUNTRY (2020)
           FIGURE 15 REAGENTS & CONSUMABLES SEGMENT ACCOUNTED FOR THE LARGEST SHARE OF THE GENOME EDITING MARKET IN NORTH AMERICA IN 2020
    4.3 GENOME EDITING/GENOME ENGINEERING SHARE, BY TECHNOLOGY (2020)
           FIGURE 16 THE CRISPR SEGMENT ACCOUNTED FOR THE LARGEST SHARE IN THE GENOME EDITING MARKET IN 2020
    4.4 GENOME EDITING MARKET, BY APPLICATION, 2021 VS. 2026 (USD MILLION)
           FIGURE 17 THE CELL LINE ENGINEERING SEGMENT EXPECTED TO DOMINATE THE APPLICATIONS MARKET IN 2026
    4.5 GENOME EDITING MARKET SHARE, BY END USER, 2020
           FIGURE 18 THE PHARMACEUTICAL COMPANIES SEGMENT ACCOUNTED FOR THE LARGEST MARKET SHARE IN 2020
    4.6 GENOME EDITING MARKET: GEOGRAPHIC GROWTH OPPORTUNITIES
           FIGURE 19 ASIA PACIFIC TO REGISTER THE HIGHEST GROWTH IN THE GENOME EDITING MARKET FROM 2021 TO 2026

5 MARKET OVERVIEW (Page No. - 52)
    5.1 INTRODUCTION
    5.2 MARKET DYNAMICS
           FIGURE 20 GENOME EDITING MARKET: DRIVERS, RESTRAINTS, OPPORTUNITIES, AND CHALLENGE
           TABLE 1 GENOME EDITING MARKET: IMPACT ANALYSIS
           5.2.1 DRIVERS
                    5.2.1.1 Rise in government funding and growth in the number of genomics projects
                    5.2.1.2 Increased application areas of genomics
                    5.2.1.3 Introduction of CRISPR-Cas9
           5.2.2 RESTRAINTS
                    5.2.2.1 Off-target effects of CRISPR technology
           5.2.3 OPPORTUNITIES
                    5.2.3.1 Extensive use of genome editing in personalized medicine
                    5.2.3.2 High growth prospects for the market in emerging countries
           5.2.4 CHALLENGES
                    5.2.4.1 High equipment costs
    5.3 RANGES/SCENARIOS
           FIGURE 21 SPECTRUM OF SCENARIOS BASED ON THE IMPACT OF UNCERTAINTIES ON THE GROWTH OF THE GENOME EDITING MARKET
    5.4 IMPACT OF COVID-19 OUTBREAK ON THE GENOME EDITING MARKET
           FIGURE 22 GENOME EDITING/GENOME ENGINEERING SCENARIO WITH AND WITHOUT COVID-19 IMPACT. 2019-2021
    5.5 TRENDS/DISRUPTIONS IMPACTING BUSINESSES OF CUSTOMERS
    5.6 VALUE CHAIN ANALYSIS
           FIGURE 23 VALUE CHAIN ANALYSIS OF THE GENOME EDITING MARKET: RESEARCH AND MANUFACTURING PHASE CONTRIBUTES MAXIMUM VALUE
    5.7 TECHNOLOGICAL ANALYSIS
    5.8 PATENT ANALYSIS
           FIGURE 24 PATENT APPLICATIONS FOR GENETIC ENGINEERING MARKET, JANUARY 2011–OCTOBER 2021
           TABLE 2 INDICATIVE LIST OF PATENTS IN THE GENOME EDITING MARKET
    5.9 ECOSYSTEM ANALYSIS OF THE GENOME EDITING MARKET
           FIGURE 25 ECOSYSTEM ANALYSIS OF THE GENOME EDITING MARKET
           TABLE 3 SUPPLY CHAIN ECOSYSTEM
    5.10 PORTER’S FIVE FORCES ANALYSIS
           TABLE 4 GENOME EDITING/ GENOME ENGINEERING MARKET: PORTER’S FIVE FORCES ANALYSIS
           5.10.1 THREAT OF NEW ENTRANTS
           5.10.2 THREAT OF SUBSTITUTES
           5.10.3 BARGAINING POWER OF SUPPLIERS
           5.10.4 BARGAINING POWER OF BUYERS
           5.10.5 COMPETITIVE RIVALRY AMONG EXISTING PLAYERS
    5.11 REGULATORY ANALYSIS
           5.11.1 REGULATIONS FOR PRODUCTS DEVELOPED USING GENOME EDITING/GENOME ENGINEERING TECHNOLOGY
                    5.11.1.1 US
                                TABLE 5 REGULATIONS FOR PRODUCTS DEVELOPED USING GENOME EDITING/GENOME ENGINEERING TECHNIQUES
                    5.11.1.2 China

6 GENOME EDITING MARKET, BY PRODUCT & SERVICE (Page No. - 68)
    6.1 INTRODUCTION
           TABLE 6 GENOME EDITING MARKET, BY PRODUCT & SERVICE, 2019–2026 (USD MILLION)
    6.2 REAGENTS & CONSUMABLES
           6.2.1 REAGENTS & CONSUMABLES HOLD THE LARGEST MARKET SHARE
                    TABLE 7 GENOME EDITING/GENOME ENGINEERING REAGENTS & CONSUMABLES MARKET, BY REGION, 2019–2026 (USD MILLION)
                    TABLE 8 NORTH AMERICA: GENOME EDITING/GENOME ENGINEERING REAGENTS & CONSUMABLES MARKET, BY COUNTRY, 2019–2026 (USD MILLION)
                    TABLE 9 EUROPE: GENOME EDITING/GENOME ENGINEERING REAGENTS & CONSUMABLES MARKET, BY COUNTRY, 2019–2026 (USD MILLION)
                    TABLE 10 APAC: GENOME EDITING/GENOME ENGINEERING REAGENTS & CONSUMABLES MARKET, BY COUNTRY, 2019–2026 (USD MILLION)
                    TABLE 11 LATAM: GENOME EDITING/GENOME ENGINEERING REAGENTS & CONSUMABLES MARKET, BY REGION, 2019–2026 (USD MILLION)
    6.3 SOFTWARE & SYSTEMS
           6.3.1 RISING APPLICATION OF GENOME EDITING/SEQUENCING TO INCREASE THE DEMAND FOR SYSTEMS AND SOFTWARE
                    TABLE 12 GENOME EDITING/GENOME ENGINEERING SOFTWARE & SYSTEMS MARKET, BY REGION, 2019–2026 (USD MILLION)
                    TABLE 13 NORTH AMERICA: GENOME EDITING/GENOME ENGINEERING SOFTWARE & SYSTEMS MARKET, BY COUNTRY, 2019–2026 (USD MILLION)
                    TABLE 14 EUROPE: GENOME EDITING/GENOME ENGINEERING SOFTWARE & SYSTEMS MARKET, BY COUNTRY, 2019–2026 (USD MILLION)
                    TABLE 15 APAC: GENOME EDITING/GENOME ENGINEERING SOFTWARE & SYSTEMS MARKET, BY COUNTRY, 2019–2026 (USD MILLION)
                    TABLE 16 LATAM: GENOME EDITING/GENOME ENGINEERING SOFTWARE & SYSTEMS MARKET, BY REGION, 2019–2026 (USD MILLION)
    6.4 SERVICES
           6.4.1 WIDE APPLICATION OF EDITING/GENOME ENGINEERING SERVICES TO INCREASE MARKET GROWTH
                    TABLE 17 GENOME EDITING/GENOME ENGINEERING SERVICES MARKET, BY REGION, 2019–2026 (USD MILLION)
                    TABLE 18 NORTH AMERICA: GENOME EDITING/GENOME ENGINEERING SERVICES MARKET, BY COUNTRY, 2019–2026 (USD MILLION)
                    TABLE 19 EUROPE: GENOME EDITING/GENOME ENGINEERING SERVICES MARKET, BY COUNTRY, 2019–2026 (USD MILLION)
                    TABLE 20 APAC: GENOME EDITING/GENOME ENGINEERING SERVICES MARKET, BY COUNTRY, 2019–2026 (USD MILLION)
                    TABLE 21 LATAM: GENOME EDITING/GENOME ENGINEERING SERVICES MARKET, BY REGION, 2019–2026 (USD MILLION)

7 GENOME EDITING MARKET, BY TECHNOLOGY (Page No. - 76)
    7.1 INTRODUCTION
           TABLE 22 GENOME EDITING MARKET, BY TECHNOLOGY, 2019–2026 (USD MILLION)
    7.2 CRISPR
           7.2.1 EASE OF USE GIVES CRISPR AN ADVANTAGE OVER OTHER TECHNOLOGIES
                    TABLE 23 GENOME EDITING MARKET FOR CRISPR, BY REGION, 2019–2026 (USD MILLION)
                    TABLE 24 NORTH AMERICA: GENOME EDITING MARKET FOR CRISPR, BY COUNTRY, 2019–2026 (USD MILLION)
                    TABLE 25 EUROPE: GENOME EDITING MARKET FOR CRISPR, BY COUNTRY, 2019–2026 (USD MILLION)
                    TABLE 26 APAC: GENOME EDITING MARKET FOR CRISPR, BY COUNTRY, 2019–2026 (USD MILLION)
                    TABLE 27 LATAM: GENOME EDITING MARKET FOR CRISPR, BY REGION, 2019–2026 (USD MILLION)
    7.3 TALEN
           7.3.1 QUICK MODIFICATIONS IN THE GENOME SEQUENCE ARE POSSIBLE WITH TALEN
                    TABLE 28 GENOME EDITING MARKET FOR TALEN, BY REGION, 2019–2026 (USD MILLION)
                    TABLE 29 NORTH AMERICA: GENOME EDITING MARKET FOR TALEN, BY COUNTRY, 2019–2026 (USD MILLION)
                    TABLE 30 EUROPE: GENOME EDITING MARKET FOR TALEN, BY COUNTRY, 2019–2026 (USD MILLION)
                    TABLE 31 APAC: GENOME EDITING MARKET FOR TALEN, BY COUNTRY, 2019–2026 (USD MILLION)
                    TABLE 32 LATAM: GENOME EDITING MARKET FOR TALEN, BY REGION, 2019–2026 (USD MILLION)
    7.4 ZFN
           7.4.1 EUKARYOTE CELL STUDIES DONE BY ZFN TO DRIVE MARKET GROWTH
                    TABLE 33 GENOME EDITING MARKET FOR ZFN, BY REGION, 2019–2026 (USD MILLION)
                    TABLE 34 NORTH AMERICA: GENOME EDITING MARKET FOR ZFN, BY COUNTRY, 2018–2025 (USD MILLION)
                    TABLE 35 EUROPE: GENOME EDITING MARKET FOR ZFN, BY COUNTRY, 2019–2026 (USD MILLION)
                    TABLE 36 APAC: GENOME EDITING MARKET FOR ZFN, BY COUNTRY, 2019–2026 (USD MILLION)
                    TABLE 37 LATAM: GENOME EDITING MARKET FOR ZFN, BY REGION, 2019–2026 (USD MILLION)
    7.5 ANTISENSE
           7.5.1 INCREASED APPLICATION IN ENGINEERING HUMAN CELLS FOR DISEASE STUDY TO DRIVE MARKET GROWTH
                    TABLE 38 GENOME EDITING MARKET FOR ANTISENSE, BY REGION, 2019–2026 (USD MILLION)
                    TABLE 39 NORTH AMERICA: GENOME EDITING MARKET FOR ANTISENSE, BY COUNTRY, 2019–2026 (USD MILLION)
                    TABLE 40 EUROPE: GENOME EDITING MARKET FOR ANTISENSE, BY COUNTRY, 2019–2026 (USD MILLION)
                    TABLE 41 APAC: GENOME EDITING MARKET FOR ANTISENSE, BY COUNTRY, 2019–2026 (USD MILLION)
                    TABLE 42 LATAM: GENOME EDITING MARKET FOR ANTISENSE, BY REGION, 2019–2026 (USD MILLION)
    7.6 OTHER TECHNOLOGIES
           TABLE 43 GENOME EDITING MARKET FOR OTHER TECHNOLOGIES, BY REGION, 2019–2026 (USD MILLION)
           TABLE 44 NORTH AMERICA: GENOME EDITING MARKET FOR OTHER TECHNOLOGIES, BY COUNTRY, 2019–2026 (USD MILLION)
           TABLE 45 EUROPE: GENOME EDITING MARKET FOR OTHER TECHNOLOGIES, BY COUNTRY, 2019–2026 (USD MILLION)
           TABLE 46 APAC: GENOME EDITING MARKET FOR OTHER TECHNOLOGIES, BY COUNTRY, 2019–2026 (USD MILLION)
           TABLE 47 LATAM: GENOME EDITING MARKET FOR OTHER TECHNOLOGIES, BY REGION, 2019–2026 (USD MILLION)

8 GENOME EDITING MARKET, BY APPLICATION (Page No. - 88)
    8.1 INTRODUCTION
           TABLE 48 GENOME EDITING MARKET, BY APPLICATION, 2019–2026 (USD MILLION)
    8.2 CELL LINE ENGINEERING
           8.2.1 INCREASING RESEARCH APPLICATIONS OF CELL LINE ENGINEERING TO PROMOTE MARKET GROWTH
                    TABLE 49 GENOME EDITING MARKET FOR CELL LINE ENGINEERING, BY REGION, 2019–2026 (USD MILLION)
                    TABLE 50 NORTH AMERICA: GENOME EDITING MARKET FOR CELL LINE ENGINEERING, BY COUNTRY, 2019–2026 (USD MILLION)
                    TABLE 51 EUROPE: GENOME EDITING MARKET FOR CELL LINE ENGINEERING, BY COUNTRY, 2019–2026 (USD MILLION)
                    TABLE 52 APAC: GENOME EDITING MARKET FOR CELL LINE ENGINEERING, BY COUNTRY, 2019–2026 (USD MILLION)
                    TABLE 53 LATAM: GENOME EDITING MARKET FOR CELL LINE ENGINEERING, BY REGION, 2019–2026 (USD MILLION)
    8.3 GENETIC ENGINEERING
           8.3.1 ANIMAL GENETIC ENGINEERING
                    8.3.1.1 Use of animal simulation models in research to increase the demand for genome editing
           8.3.2 PLANT GENETIC ENGINEERING
                    8.3.2.1 Growing attention on GM crops will drive demand for genetic engineering in crops
                               TABLE 54 GENOME EDITING MARKET FOR GENETIC ENGINEERING, BY REGION, 2019–2026 (USD MILLION)
                               TABLE 55 NORTH AMERICA: GENOME EDITING MARKET FOR GENETIC ENGINEERING, BY COUNTRY, 2019–2026 (USD MILLION)
                               TABLE 56 EUROPE: GENOME EDITING MARKET FOR GENETIC ENGINEERING, BY COUNTRY, 2019–2026 (USD MILLION)
                               TABLE 57 APAC: GENOME EDITING MARKET FOR GENETIC ENGINEERING, BY COUNTRY, 2019–2026 (USD MILLION)
                               TABLE 58 LATAM: GENOME EDITING MARKET FOR GENETIC ENGINEERING, BY REGION, 2019–2026 (USD MILLION)
    8.4 DIAGNOSTIC APPLICATIONS
           8.4.1 THE GROWING NUMBER OF APPLICATIONS IN DIAGNOSTICS WILL FAVOR MARKET GROWTH
                    TABLE 59 GENOME EDITING MARKET FOR DIAGNOSTIC APPLICATIONS, BY REGION, 2019–2026 (USD MILLION)
                    TABLE 60 NORTH AMERICA: GENOME EDITING MARKET FOR DIAGNOSTIC APPLICATIONS, BY COUNTRY, 2019–2026 (USD MILLION)
                    TABLE 61 EUROPE: GENOME EDITING MARKET FOR DIAGNOSTIC APPLICATIONS, BY COUNTRY, 2019–2026 (USD MILLION)
                    TABLE 62 APAC: GENOME EDITING MARKET FOR DIAGNOSTIC APPLICATIONS, BY COUNTRY, 2019–2026 (USD MILLION)
                    TABLE 63 LATAM: GENOME EDITING MARKET FOR DIAGNOSTIC APPLICATIONS, BY REGION, 2019–2026 (USD MILLION)
    8.5 DRUG DISCOVERY & DEVELOPMENT
           8.5.1 GROWING RESEARCH AND APPLICATIONS IN DRUG DISCOVERY & DEVELOPMENT TO DRIVE MARKET GROWTH
                    TABLE 64 GENOME EDITING MARKET FOR DRUG DISCOVERY & DEVELOPMENT, BY REGION, 2019–2026 (USD MILLION)
                    TABLE 65 NORTH AMERICA: GENOME EDITING MARKET FOR DRUG DISCOVERY & DEVELOPMENT, BY COUNTRY, 2019–2026 (USD MILLION)
                    TABLE 66 EUROPE: GENOME EDITING MARKET FOR DRUG DISCOVERY & DEVELOPMENT, BY COUNTRY, 2019–2026 (USD MILLION)
                    TABLE 67 APAC: GENOME EDITING MARKET FOR DRUG DISCOVERY & DEVELOPMENT, BY COUNTRY, 2019–2026 (USD MILLION)
                    TABLE 68 LATAM: GENOME EDITING MARKET FOR DRUG DISCOVERY & DEVELOPMENT, BY REGION, 2019–2026 (USD MILLION)
    8.6 OTHER APPLICATIONS
           TABLE 69 GENOME EDITING MARKET FOR OTHER APPLICATIONS, BY REGION, 2019–2026 (USD MILLION)
           TABLE 70 NORTH AMERICA: GENOME EDITING MARKET FOR OTHER APPLICATIONS, BY COUNTRY, 2019–2026 (USD MILLION)
           TABLE 71 EUROPE: GENOME EDITING MARKET FOR OTHER APPLICATIONS, BY COUNTRY, 2019–2026 (USD MILLION)
           TABLE 72 APAC: GENOME EDITING MARKET FOR OTHER APPLICATIONS, BY COUNTRY, 2019–2026 (USD MILLION)
           TABLE 73 LATAM: GENOME EDITING MARKET FOR OTHER APPLICATIONS, BY REGION, 2019–2026 (USD MILLION)

9 GENOME EDITING/ GENOME ENGINEERING MARKET, BY END USER (Page No. - 101)
    9.1 INTRODUCTION
           TABLE 74 GENOME EDITING MARKET, BY END USER,  2019–2026 (USD MILLION)
    9.2 PHARMACEUTICAL COMPANIES
           9.2.1 CRISPR TECHNOLOGIES ARE USED BY PHARMACEUTICAL COMPANIES FOR APPLICATIONS IN GENE THERAPIES
                    TABLE 75 GENOME EDITING MARKET FOR PHARMACEUTICAL COMPANIES, BY REGION, 2019–2026 (USD MILLION)
                    TABLE 76 NORTH AMERICA: GENOME EDITING MARKET FOR PHARMACEUTICAL COMPANIES, BY COUNTRY, 2019–2026 (USD MILLION)
                    TABLE 77 EUROPE: GENOME EDITING MARKET FOR PHARMACEUTICAL COMPANIES, BY COUNTRY, 2019–2026 (USD MILLION)
                    TABLE 78 APAC: GENOME EDITING MARKET FOR PHARMACEUTICAL COMPANIES, BY COUNTRY, 2019–2026 (USD MILLION)
                    TABLE 79 LATAM: GENOME EDITING MARKET FOR PHARMACEUTICAL COMPANIES, BY REGION, 2019–2026 (USD MILLION)
    9.3 BIOTECHNOLOGY COMPANIES
           9.3.1 INCREASING IMPORTANCE OF BIOMARKERS TO DRIVE DEMAND FOR MARKET PRODUCTS IN BIOTECH COMPANIES
                    TABLE 80 GENOME EDITING MARKET FOR BIOTECHNOLOGY COMPANIES, BY REGION, 2019–2026 (USD MILLION)
                    TABLE 81 NORTH AMERICA: GENOME EDITING MARKET FOR BIOTECHNOLOGY COMPANIES, BY COUNTRY, 2019–2026 (USD MILLION)
                    TABLE 82 EUROPE: GENOME EDITING MARKET FOR BIOTECHNOLOGY COMPANIES, BY COUNTRY, 2019–2026 (USD MILLION)
                    TABLE 83 APAC: GENOME EDITING MARKET FOR BIOTECHNOLOGY COMPANIES, BY COUNTRY, 2019–2026 (USD MILLION)
                    TABLE 84 LATAM: GENOME EDITING MARKET FOR BIOTECHNOLOGY COMPANIES, BY REGION, 2019–2026 (USD MILLION)
    9.4 ACADEMIC & GOVERNMENT RESEARCH INSTITUTES
           9.4.1 TREND OF COLLABORATIVE RESEARCH WILL SUPPORT MARKET GROWTH
                    TABLE 85 GENOME EDITING MARKET FOR ACADEMIC & GOVERNMENT RESEARCH INSTITUTES, BY REGION, 2019–2026 (USD MILLION)
                    TABLE 86 NORTH AMERICA: GENOME EDITING MARKET FOR ACADEMIC & GOVERNMENT RESEARCH INSTITUTES, BY COUNTRY, 2019–2026 (USD MILLION)
                    TABLE 87 EUROPE: GENOME EDITING/GENOME ENGINEERING MARKET FOR ACADEMIC & GOVERNMENT RESEARCH INSTITUTES, BY COUNTRY, 2019–2026 (USD MILLION)
                    TABLE 88 APAC: GENOME EDITING/GENOME ENGINEERING MARKET FOR ACADEMIC & GOVERNMENT RESEARCH INSTITUTES, BY COUNTRY, 2019–2026 (USD MILLION)
                    TABLE 89 LATAM: GENOME EDITING/GENOME ENGINEERING MARKET FOR ACADEMIC & GOVERNMENT RESEARCH INSTITUTES, BY REGION, 2019–2026 (USD MILLION)

10 GENOME EDITING/GENOME ENGINEERING MARKET, BY REGION (Page No. - 109)
     10.1 INTRODUCTION
             FIGURE 26 GENOME EDITING/GENOME ENGINEERING MARKET, BY REGION
             TABLE 90 GENOME EDITING/GENOME ENGINEERING MARKET, BY REGION, 2019–2026 (USD MILLION)
     10.2 NORTH AMERICA
             FIGURE 27 NORTH AMERICA: GENOME EDITING/GENOME ENGINEERING MARKET SNAPSHOT
             TABLE 91 NORTH AMERICA: GENOME EDITING/GENOME ENGINEERING MARKET, BY COUNTRY, 2019–2026 (USD MILLION)
             TABLE 92 NORTH AMERICA: GENOME EDITING/GENOME ENGINEERING MARKET, BY PRODUCT & SERVICE, 2019–2026 (USD MILLION)
             TABLE 93 NORTH AMERICA: GENOME EDITING/GENOME ENGINEERING MARKET, BY TECHNOLOGY, 2019–2026 (USD MILLION)
             TABLE 94 NORTH AMERICA: GENOME EDITING/GENOME ENGINEERING MARKET, BY APPLICATION, 2019–2026 (USD MILLION)
             TABLE 95 NORTH AMERICA: GENOME EDITING/GENOME ENGINEERING MARKET, BY END USER, 2019–2026 (USD MILLION)
             10.2.1 US
                        10.2.1.1 The US dominates the North American market
                                     TABLE 96 US: GENOME EDITING/GENOME ENGINEERING MARKET, BY PRODUCT & SERVICE, 2019–2026 (USD MILLION)
                                     TABLE 97 US: GENOME EDITING/GENOME ENGINEERING MARKET, BY TECHNOLOGY, 2019–2026 (USD MILLION)
                                     TABLE 98 US: GENOME EDITING/GENOME ENGINEERING MARKET, BY APPLICATION, 2019–2026 (USD MILLION)
                                     TABLE 99 US: GENOME EDITING/GENOME ENGINEERING MARKET, BY END USER, 2019–2026 (USD MILLION)
             10.2.2 CANADA
                        10.2.2.1 Availability of research funding in Canada drives the market growth
                                     TABLE 100 CANADA: GENOME EDITING/GENOME ENGINEERING MARKET, BY PRODUCT & SERVICE, 2019–2026 (USD MILLION)
                                     TABLE 101 CANADA: GENOME EDITING/GENOME ENGINEERING MARKET, BY TECHNOLOGY, 2019–2026 (USD MILLION)
                                     TABLE 102 CANADA: GENOME EDITING/GENOME ENGINEERING MARKET, BY APPLICATION, 2019–2026 (USD MILLION)
                                     TABLE 103 CANADA: GENOME EDITING/GENOME ENGINEERING MARKET, BY END USER, 2019–2026 (USD MILLION)
     10.3 EUROPE
             TABLE 104 EUROPE: GENOME EDITING/GENOME ENGINEERING MARKET, BY COUNTRY, 2019–2026 (USD MILLION)
             TABLE 105 EUROPE: GENOME EDITING/GENOME ENGINEERING MARKET, BY PRODUCT & SERVICE, 2019–2026 (USD MILLION)
             TABLE 106 EUROPE: GENOME EDITING/GENOME ENGINEERING MARKET, BY TECHNOLOGY, 2019–2026 (USD MILLION)
             TABLE 107 EUROPE: GENOME EDITING/GENOME ENGINEERING MARKET, BY APPLICATION, 2019–2026 (USD MILLION)
             TABLE 108 EUROPE: GENOME EDITING/GENOME ENGINEERING MARKET, BY END USER, 2019–2026 (USD MILLION)
             10.3.1 GERMANY
                        10.3.1.1 Strong academic base and rising awareness are key growth drivers in Germany
                                     TABLE 109 GERMANY: GENOME EDITING/GENOME ENGINEERING MARKET, BY PRODUCT & SERVICE, 2019–2026 (USD MILLION)
                                     TABLE 110 GERMANY: GENOME EDITING/GENOME ENGINEERING MARKET, BY TECHNOLOGY, 2019–2026 (USD MILLION)
                                     TABLE 111 GERMANY: GENOME EDITING/GENOME ENGINEERING MARKET, BY APPLICATION, 2019–2026 (USD MILLION)
                                     TABLE 112 GERMANY: GENOME EDITING/GENOME ENGINEERING MARKET, BY END USER, 2019–2026 USD MILLION)
             10.3.2 UK
                        10.3.2.1 The UK is the largest market for genome engineering in Europe
                                     TABLE 113 UK: GENOME EDITING/GENOME ENGINEERING MARKET, BY PRODUCT & SERVICE, 2019–2026 (USD MILLION)
                                     TABLE 114 UK: GENOME EDITING/GENOME ENGINEERING MARKET, BY TECHNOLOGY, 2019–2026 (USD MILLION)
                                     TABLE 115 UK: GENOME EDITING/GENOME ENGINEERING MARKET, BY APPLICATION, 2019–2026 (USD MILLION)
                                     TABLE 116 UK: GENOME EDITING/GENOME ENGINEERING MARKET, BY END USER, 2019–2026 (USD MILLION)
             10.3.3 FRANCE
                        10.3.3.1 Government funding for genomics and rising investments into research show potential for market growth
                                     TABLE 117 FRANCE: GENOME EDITING/GENOME ENGINEERING MARKET, BY PRODUCT & SERVICE, 2019–2026 (USD MILLION)
                                     TABLE 118 FRANCE: GENOME EDITING/GENOME ENGINEERING MARKET, BY TECHNOLOGY, 2019–2026 (USD MILLION)
                                     TABLE 119 FRANCE: GENOME EDITING/GENOME ENGINEERING MARKET, BY APPLICATION, 2019–2026 (USD MILLION)
                                     TABLE 120 FRANCE: GENOME EDITING/GENOME ENGINEERING MARKET, BY END USER, 2019–2026 (USD MILLION)
             10.3.4 ITALY
                        10.3.4.1 Increasing collaborations are driving genomic medicine research, thus, boosting the gene editing market in Italy
                                     TABLE 121 ITALY: GENOME EDITING/GENOME ENGINEERING MARKET, BY PRODUCT & SERVICE, 2019–2026 (USD MILLION)
                                     TABLE 122 ITALY: GENOME EDITING/GENOME ENGINEERING MARKET, BY TECHNOLOGY, 2019–2026 (USD MILLION)
                                     TABLE 123 ITALY: GENOME EDITING/GENOME ENGINEERING MARKET, BY APPLICATION, 2019–2026 (USD MILLION)
                                     TABLE 124 ITALY: GENOME EDITING/GENOME ENGINEERING MARKET, BY END USER, 2019–2026 USD MILLION)
             10.3.5 SPAIN
                        10.3.5.1 Proactive research funding by the government to boost the market growth
                                     TABLE 125 SPAIN: GENOME EDITING/GENOME ENGINEERING MARKET, BY PRODUCT & SERVICE, 2019–2026 (USD MILLION)
                                     TABLE 126 SPAIN: GENOME EDITING/GENOME ENGINEERING MARKET, BY TECHNOLOGY, 2019–2026 (USD MILLION)
                                     TABLE 127 SPAIN: GENOME EDITING/GENOME ENGINEERING MARKET, BY APPLICATION, 2019–2026 (USD MILLION)
                                     TABLE 128 SPAIN: GENOME EDITING/GENOME ENGINEERING MARKET, BY END USER, 2019–2026 USD MILLION)
             10.3.6 REST OF EUROPE
                        TABLE 129 ROE: GENOME EDITING/GENOME ENGINEERING MARKET, BY PRODUCT & SERVICE, 2019–2026 (USD MILLION)
                        TABLE 130 ROE: GENOME EDITING/GENOME ENGINEERING MARKET, BY TECHNOLOGY, 2019–2026 (USD MILLION)
                        TABLE 131 ROE: GENOME EDITING/GENOME ENGINEERING MARKET, BY APPLICATION, 2019–2026 (USD MILLION)
                        TABLE 132 ROE: GENOME EDITING/GENOME ENGINEERING MARKET, BY END USER, 2019–2026 (USD MILLION)
     10.4 ASIA PACIFIC
             FIGURE 28 APAC: GENOME EDITING/GENOME ENGINEERING MARKET SNAPSHOT
             TABLE 133 APAC: GENOME EDITING/GENOME ENGINEERING MARKET, BY COUNTRY, 2019–2026 (USD MILLION)
             TABLE 134 APAC: GENOME EDITING/GENOME ENGINEERING MARKET, BY PRODUCT & SERVICE, 2019–2026 (USD MILLION)
             TABLE 135 APAC: GENOME EDITING/GENOME ENGINEERING MARKET, BY TECHNOLOGY, 2019–2026 (USD MILLION)
             TABLE 136 APAC: GENOME EDITING/GENOME ENGINEERING MARKET, BY APPLICATION, 2019–2026 (USD MILLION)
             TABLE 137 APAC: GENOME EDITING/GENOME ENGINEERING MARKET, BY END USER, 2019–2026 (USD MILLION)
             10.4.1 CHINA
                        10.4.1.1 China to hold the largest share of the market in the Asia Pacific
                                     TABLE 138 CHINA: GENOME EDITING/GENOME ENGINEERING MARKET, BY PRODUCT & SERVICE, 2019–2026 (USD MILLION)
                                     TABLE 139 CHINA: GENOME EDITING/GENOME ENGINEERING MARKET, BY TECHNOLOGY, 2019–2026 (USD MILLION)
                                     TABLE 140 CHINA: GENOME EDITING/GENOME ENGINEERING MARKET, BY APPLICATION, 2019–2026 (USD MILLION)
                                     TABLE 141 CHINA: GENOME EDITING/GENOME ENGINEERING MARKET, BY END USER, 2019–2026 (USD MILLION)
             10.4.2 JAPAN
                        10.4.2.1 Focus on cancer research showcases favorable scenarios for the market in Japan
                                     TABLE 142 JAPAN: GENOME EDITING/GENOME ENGINEERING MARKET, BY PRODUCT & SERVICE, 2019–2026 (USD MILLION)
                                     TABLE 143 JAPAN: GENOME EDITING/GENOME ENGINEERING MARKET, BY TECHNOLOGY, 2019–2026 (USD MILLION)
                                     TABLE 144 JAPAN: GENOME EDITING/GENOME ENGINEERING MARKET, BY APPLICATION, 2019–2026 (USD MILLION)
                                     TABLE 145 JAPAN: GENOME EDITING/GENOME ENGINEERING MARKET, BY END USER, 2019–2026 (USD MILLION)
             10.4.3 INDIA
                        10.4.3.1 A growing number of startups and government support indicates growth potential
                                     TABLE 146 INDIA: GENOME EDITING/GENOME ENGINEERING MARKET, BY PRODUCT & SERVICE, 2019–2026 (USD MILLION)
                                     TABLE 147 INDIA: GENOME EDITING/GENOME ENGINEERING MARKET, BY TECHNOLOGY, 2019–2026 (USD MILLION)
                                     TABLE 148 INDIA: GENOME EDITING/GENOME ENGINEERING MARKET, BY APPLICATION, 2019–2026 (USD MILLION)
                                     TABLE 149 INDIA: GENOME EDITING/GENOME ENGINEERING MARKET, BY END USER, 2019–2026 (USD MILLION)
             10.4.4 ROAPAC
                        10.4.4.1 The growth of the market in the RoAPAC is attributed to rising genomic Research
                                     TABLE 150 ROAPAC: GENOME EDITING/GENOME ENGINEERING MARKET, BY PRODUCT & SERVICE, 2019–2026 (USD MILLION)
                                     TABLE 151 ROAPAC: GENOME EDITING/GENOME ENGINEERING MARKET, BY TECHNOLOGY, 2019–2026 (USD MILLION)
                                     TABLE 152 ROAPAC: GENOME EDITING/GENOME ENGINEERING MARKET, BY APPLICATION, 2019–2026 (USD MILLION)
                                     TABLE 153 ROAPAC: GENOME EDITING/GENOME ENGINEERING MARKET, BY END USER, 2019–2026 (USD MILLION)
     10.5 REST OF THE WORLD
             10.5.1 LATAM
                        10.5.1.1 The growth of the market in the LATAM is attributed to rising research in genetically modified crops
                                     TABLE 154 LATAM: GENOME EDITING/GENOME ENGINEERING MARKET, BY REGION, 2019–2026 (USD MILLION)
                                     TABLE 155 LATAM: GENOME EDITING/GENOME ENGINEERING MARKET, BY PRODUCT & SERVICE, 2019–2026 (USD MILLION)
                                     TABLE 156 LATAM: GENOME EDITING/GENOME ENGINEERING MARKET, BY TECHNOLOGY, 2019–2026 (USD MILLION)
                                     TABLE 157 LATAM: GENOME EDITING/GENOME ENGINEERING MARKET, BY APPLICATION, 2019–2026 (USD MILLION)
                                     TABLE 158 LATAM: GENOME EDITING/GENOME ENGINEERING MARKET, BY END USER, 2019–2026 (USD MILLION)
                        10.5.1.2 Brazil
                               10.5.1.2.1 The rising number of workshops and conferences are increasing awareness, thus, promoting genome editing advancements
                                     TABLE 159 BRAZIL: GENOME EDITING/GENOME ENGINEERING MARKET, BY PRODUCT & SERVICE, 2019–2026 (USD MILLION)
                                     TABLE 160 BRAZIL: GENOME EDITING/GENOME ENGINEERING MARKET, BY TECHNOLOGY, 2019–2026 (USD MILLION)
                                     TABLE 161 BRAZIL: GENOME EDITING/GENOME ENGINEERING MARKET, BY APPLICATION, 2019–2026 (USD MILLION)
                                     TABLE 162 BRAZIL: GENOME EDITING/GENOME ENGINEERING MARKET, BY END USER, 2019–2026 (USD MILLION)
                        10.5.1.3 Rest of LATAM
                               10.5.1.3.1 Latin America is an attractive market for genomics
                                     TABLE 163 REST OF LATAM: GENOME EDITING/GENOME ENGINEERING MARKET, BY PRODUCT & SERVICE, 2019–2026 (USD MILLION)
                                     TABLE 164 REST OF LATAM: GENOME EDITING/GENOME ENGINEERING MARKET, BY TECHNOLOGY, 2019–2026 (USD MILLION)
                                     TABLE 165 REST OF LATAM: GENOME EDITING/GENOME ENGINEERING MARKET, BY APPLICATION, 2019–2026 (USD MILLION)
                                     TABLE 166 REST OF LATAM: GENOME EDITING/GENOME ENGINEERING MARKET, BY END USER, 2019–2026 (USD MILLION)
             10.5.2 MIDDLE EAST & AFRICA
                        10.5.2.1 The rising prevalence of genomic disorders in the Middle East and the adoption of genetic testing are driving market growth
                                     TABLE 167 MEA: GENOME EDITING/GENOME ENGINEERING MARKET, BY PRODUCT & SERVICE, 2019–2026 (USD MILLION)
                                     TABLE 168 MEA: GENOME EDITING/GENOME ENGINEERING MARKET, BY TECHNOLOGY, 2019–2026 (USD MILLION)
                                     TABLE 169 MEA: GENOME EDITING/GENOME ENGINEERING MARKET, BY APPLICATION, 2019–2026 (USD MILLION)
                                     TABLE 170 MEA: GENOME EDITING/GENOME ENGINEERING MARKET, BY END USER, 2019–2026 (USD MILLION)

11 COMPETITIVE LANDSCAPE (Page No. - 147)
     11.1 OVERVIEW
     11.2 KEY PLAYERS STRATEGIES/RIGHT TO WIN
             FIGURE 29 KEY PLAYERS STRATEGIES IN THE GENOME EDITING/GENOME ENGINEERING MARKET, 2019- 2021
     11.3 MARKET SHARE ANALYSIS
             FIGURE 30 GENOME EDITING/GENOME ENGINEERING MARKET PLAYER RANKING, 2020
     11.4 REVENUE SHARE ANALYSIS OF TOP MARKET PLAYERS
             FIGURE 31 TOP MARKET PLAYERS DOMINATED THE GENOME EDITING/GENOME ENGINEERING MARKET IN THE LAST THREE YEARS
     11.5 COMPANY EVALUATION QUADRANT
             11.5.1 STARS
             11.5.2 EMERGING LEADERS
             11.5.3 PERVASIVE
             11.5.4 EMERGING COMPANIES
                        FIGURE 32 GENOME EDITING/GENOME ENGINEERING MARKET: COMPANY EVALUATION QUADRANT, 2020
     11.6 COMPANY EVALUATION QUADRANT: START-UPS/SMES
             11.6.1 PROGRESSIVE COMPANIES
             11.6.2 STARTING BLOCKS
             11.6.3 RESPONSIVE COMPANIES
             11.6.4 DYNAMIC COMPANIES
                        FIGURE 33 GENOME EDITING/GENOME ENGINEERING MARKET: COMPANY EVALUATION QUADRANT FOR START-UPS/SMES, 2020
     11.7 COMPANY PRODUCT FOOTPRINT
             TABLE 171 PRODUCT PORTFOLIO ANALYSIS: GENOME EDITING/GENOME ENGINEERING MARKET (2020)
     11.8 COMPANY GEOGRAPHIC FOOTPRINT
             TABLE 172 GEOGRAPHIC REVENUE MIX: GENOME EDITING/GENOME ENGINEERING MARKET (2020)
     11.9 COMPETITIVE SCENARIO
             11.9.1 SERVICE/ PRODUCT LAUNCHES
             11.9.2 DEALS
             11.9.3 OTHER DEVELOPMENTS

12 COMPANY PROFILES (Page No. - 160)
     12.1 KEY COMPANIES
(Business overview, Products & Services Offered, Recent developments, MNM view, Key strengths/Right to win, Strategic choices made, and Weaknesses and competitive threats)* 
             12.1.1 THERMO FISHER SCIENTIFIC
                        TABLE 173 THERMO FISHER SCIENTIFIC: BUSINESS OVERVIEW
                        FIGURE 34 THERMO FISHER SCIENTIFIC: COMPANY SNAPSHOT (2020)
             12.1.2 MERCK KGAA
                        TABLE 174 MERCK KGAA: BUSINESS OVERVIEW
                        FIGURE 35 MERCK KGAA: COMPANY SNAPSHOT (2020)
             12.1.3 GENSCRIPT
                        TABLE 175 GENSCRIPT: BUSINESS OVERVIEW
                        FIGURE 36 GENSCRIPT: COMPANY SNAPSHOT (2020)
             12.1.4 SANGAMO THERAPEUTICS
                        TABLE 176 SANGAMO THERAPEUTICS: BUSINESS OVERVIEW
                        FIGURE 37 SANGAMO THERAPEUTICS: COMPANY SNAPSHOT (2020)
             12.1.5 LONZA
                        TABLE 177 LONZA: BUSINESS OVERVIEW
                        FIGURE 38 LONZA: COMPANY SNAPSHOT (2020)
             12.1.6 EDITAS MEDICINE
                        TABLE 178 EDITAS MEDICINE: BUSINESS OVERVIEW
                        FIGURE 39 EDITAS MEDICINE: COMPANY SNAPSHOT (2020)
             12.1.7 CRISPR THERAPEUTICS AG
                        TABLE 179 CRISPR THERAPEUTICS AG: BUSINESS OVERVIEW
                        FIGURE 40 CRISPR THERAPEUTICS AG: COMPANY SNAPSHOT (2020)
             12.1.8 TECAN LIFE SCIENCES
                        TABLE 180 TECAN LIFESCIENCES: BUSINESS OVERVIEW
                        FIGURE 41 TECAN LIFESCIENCES: COMPANY SNAPSHOT (2020)
             12.1.9 PRECISION BIOSCIENCES
                        TABLE 181 PRECISION BIOSCIENCES: BUSINESS OVERVIEW
                        FIGURE 42 PRECISION BIOSCIENCES: COMPANY SNAPSHOT (2020)
             12.1.10 AGILENT TECHNOLOGIES
                        TABLE 182 AGILENT TECHNOLOGIES: BUSINESS OVERVIEW
                        FIGURE 43 AGILENT TECHNOLOGIES: COMPANY SNAPSHOT (2020)
             12.1.11 PERKINELMER
                        TABLE 183 PERKINELMER: BUSINESS OVERVIEW
                        FIGURE 44 PERKINELMER: COMPANY SNAPSHOT (2020)
             12.1.12 CELLECTIS S.A
                        TABLE 184 CELLECTIS S.A: BUSINESS OVERVIEW
                        FIGURE 45 CELLECTIS S.A: COMPANY SNAPSHOT (2020)
             12.1.13 INTELLIA THERAPEUTICS
                        TABLE 185 INTELLIA THERAPEUTICS: BUSINESS OVERVIEW
                        FIGURE 46 INTELLIA THERAPEUTICS: COMPANY SNAPSHOT (2020)
             12.1.14 BLUEBIRD BIO INC.
                        TABLE 186 BLUEBIRD BIO: BUSINESS OVERVIEW
                        FIGURE 47 BLUEBIRD BIO: COMPANY SNAPSHOT (2020)
             12.1.15 REGENERON PHARMACEUTICALS INC.
                        TABLE 187 REGENERON PHARMACEUTICALS: BUSINESS OVERVIEW
                        FIGURE 48 REGENERON PHARMACEUTICALS: COMPANY SNAPSHOT (2020)
     12.2 OTHER PLAYERS
             12.2.1 SYNTHEGO CORPORATION
             12.2.2 VIGENE BIOSCIENCES
             12.2.3 BEAM THERAPEUTICS
             12.2.4 INTEGRATED DNA TECHNOLOGIES
             12.2.5 NEW ENGLAND BIOLABS
             12.2.6 ORIGENE TECHNOLOGIES
             12.2.7 TRANSPOSAGEN BIOPHARMACEUTICALS [HERA BIOLABS]
             12.2.8 CREATIVE BIOGENE
             12.2.9 RECOMBINETICS
             12.2.10 CARIBOU BIOSCIENCES
*Details on Business overview, Products & Services Offered, Recent developments, MNM view, Key strengths/Right to win, Strategic choices made, and Weaknesses and competitive threats might not be captured in case of unlisted companies. 

13 APPENDIX (Page No. - 202)
     13.1 DISCUSSION GUIDE
     13.2 KNOWLEDGE STORE: MARKETSANDMARKETS’ SUBSCRIPTION PORTAL
     13.3 AVAILABLE CUSTOMIZATIONS
     13.4 RELATED REPORTS
     13.5 AUTHOR DETAILS

This research study involved the extensive use of secondary sources, directories, and databases to identify and collect information useful for this technical, market-oriented, and financial study of the global genome editing/genome engineering market. In-depth interviews were conducted with various primary respondents, including key industry participants, subject-matter experts (SMEs), C-level executives of key market players, and industry consultants, to obtain and verify critical qualitative and quantitative information and assess growth prospects of the market. The global market size estimated through secondary research was then triangulated with inputs from primary research to arrive at the final market size.

Secondary Research

The secondary sources referred to for this research study include publications from government sources, such as International Chromosome and Genome Society (ICGS), National Human Genome Research Institute (NHGRI), Asia Pacific Society of Human Genetics (APSHG), Genetics Society of America (GSA), European Society of Human Genetics (ESHG), Centers for Common Disease Genomics (CDDG), Center for Cellular and Molecular Biology (CCMB) (India), and the Department of Biotechnology (DBT) (India). Secondary sources also include corporate and regulatory filings, such as annual reports, SEC filings, investor presentations, and financial statements; business magazines & research journals; press releases; and trade, business, and professional associations. Secondary data was collected and analyzed to arrive at the overall size of the global genome editing/genome engineering market, which was validated through primary research.

Primary Research

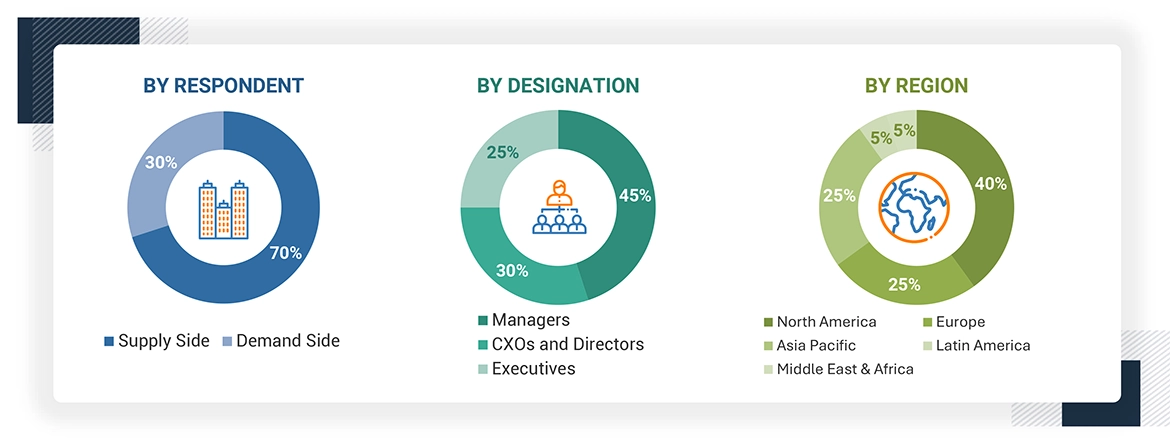
Extensive primary research was conducted after acquiring basic knowledge about the global genome editing/genome engineering market scenario through secondary research. Several primary interviews were conducted with market experts from the demand side, such as personnel from the pharmaceutical and biopharmaceutical industries and experts from the supply side, such as C-level and D-level executives, product managers, marketing & sales managers of key manufacturers, distributors, and channel partners. These interviews were conducted across four major regions, including North America, Europe, the Asia Pacific, and the Rest of the World. Approximately 70% and 30% of primary interviews were conducted with supply-side and demand-side participants, respectively. This primary data was collected through questionnaires, e-mails, online surveys, personal interviews, and telephonic interviews.

 The following is a breakdown of the primary respondents:

Genome Editing/Genome Engineering Market Size, and Share

To know about the assumptions considered for the study, download the pdf brochure

Genome Editing Market Size Estimation

The global size of the genome editing/genome engineering market was estimated through multiple approaches. A detailed market estimation approach was followed to estimate and validate the value of the genome editing/genome engineering market and other dependent submarkets. These methods were also used extensively to estimate the size of various subsegments in the market. The research methodology used to estimate the market size includes the following:

  • The key players in the industry and market have been identified through extensive secondary research
  • The revenues generated from the genome editing/genome engineering business of leading players have been determined through primary and secondary research
  • All percentage shares, splits, and breakdowns have been determined using secondary sources and verified through primary sources.  
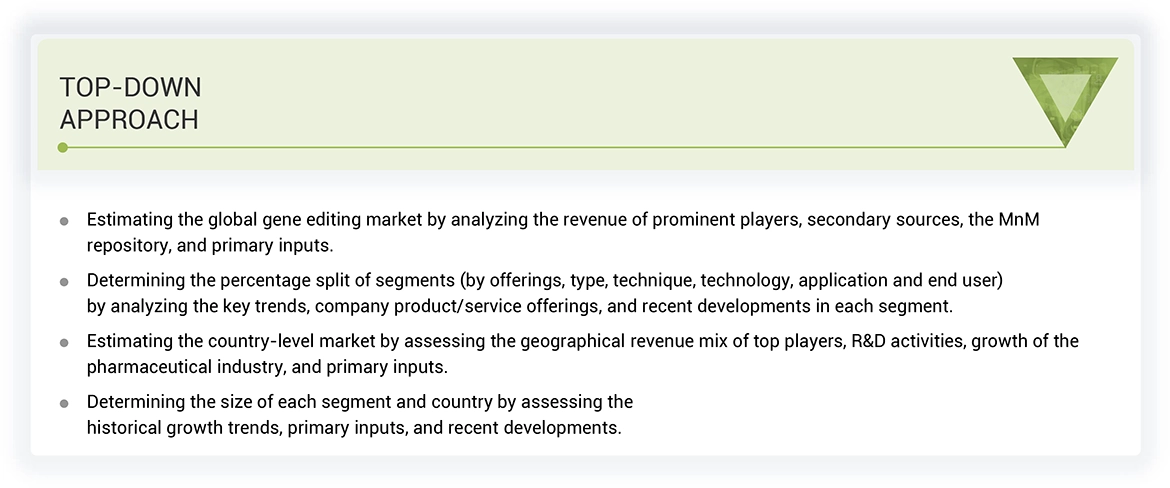
Data Tri?angulation

After arriving at the market size from the market size estimation process explained above, the total market was divided into several segments and subsegments. Data triangulation and market breakdown procedures were employed, wherever applicable, to complete the overall market engineering process and arrive at the exact statistics for all segments and subsegments.

Report Objectives

  • To define, describe, and forecast the genome editing/genome engineering market on the basis of technology, product & service, application, end user, and region
  • To provide detailed information about factors, such as drivers, restraints, opportunities, and challenges influencing the market growth
  • To strategically analyze micromarkets with respect to individual growth trends, prospects, and contributions to the overall genome editing/genome engineering market
  • To analyze market opportunities for stakeholders and provide details of the competitive landscape for key players
  • To forecast the size of market segments with respect to four main regions, namely,
  • North America, Europe, Asia Pacific (APAC), and the Rest of the World (RoW)
  • To profile the key players and comprehensively analyze their core competencies3 in terms of key developments, product portfolios, and financials
  • To track and analyze competitive developments, such as product/service launches, partnerships, collaborations, agreements, and acquisitions, in the genome editing/genome engineering market

Available Customizations

With the given market data, MarketsandMarkets offers customizations as per the company’s specific needs. The following customization options are available for this report:

Report Code
BT 3380
Published ON
Nov, 2021
Choose License Type
BUY NOW
  • SHARE
X
Request Customization
Speak to Analyst
Speak to Analyst
OR FACE-TO-FACE MEETING
PERSONALIZE THIS RESEARCH
  • Triangulate with your Own Data
  • Get Data as per your Format and Definition
  • Gain a Deeper Dive on a Specific Application, Geography, Customer or Competitor
  • Any level of Personalization
REQUEST A FREE CUSTOMIZATION
LET US HELP YOU!
  • What are the Known and Unknown Adjacencies Impacting the Genome Editing Market
  • What will your New Revenue Sources be?
  • Who will be your Top Customer; what will make them switch?
  • Defend your Market Share or Win Competitors
  • Get a Scorecard for Target Partners
CUSTOMIZED WORKSHOP REQUEST
+1-888-600-6441
  • Call Us
  • +1-888-600-6441 (Corporate office hours)
  • +1-888-600-6441 (US/Can toll free)
  • +44-800-368-9399 (UK office hours)
CONNECT WITH US
ABOUT TRUST ONLINE
©2023 MarketsandMarkets Research Private Ltd. All rights reserved
DMCA.com Protection Status Website Feedback