
Rest Of Asia Pacific Advanced Visualization Market (2024-2029)

The Rest Of Asia Pacific Advanced Visualization Market was valued at $187.2 Million in 2024 and projected to reach to $310 Million by 2029, representing a compound annual growth rate of 10.6%. Rest Of Asia Pacific represents a high-growth frontier for advanced visualization technologies, driven by expanding healthcare infrastructure investments and rising demand for diagnostic accuracy in emerging markets.


| Market Size in | USD 26.32 MN |
| Market Forecast in | |
| CAGR | |
| Forecast Period | |
| Units Considered | Value (USD MN) |
Rest Of Asia Pacific Advanced Visualization Market Trends and Insights
- Rest Of Asia Pacific represents a critical growth region for healthcare visualization technologies, driven by increasing adoption of diagnostic imaging, surgical visualization, and clinical decision-support systems across emerging economies.
- The region's healthcare infrastructure modernization and rising investment in medical technology are accelerating demand for advanced visualization solutions. Rest Of Asia Pacific's 10.6% compound annual growth rate reflects strong momentum in the healthcare sector, supported by growing patient populations and expanding hospital networks.
- Rest Of Asia Pacific is witnessing increased penetration of 3D imaging, augmented reality applications, and AI-integrated visualization platforms in clinical settings.
- The market dynamics in Rest Of Asia Pacific are shaped by regulatory improvements, cost-effective solutions tailored to regional needs, and partnerships between global vendors and local healthcare providers, positioning the region as a high-potential market for advanced visualization innovation through 2029..
Key Market Statistics
- CAGR (2024-2029) 10.6% CAGR
- Market Size, 2024 ~USD 187.2 Million
- Forecast, 2029 ~USD 310 Million
- Country Rest Of Asia Pacific
Rest Of Asia Pacific Advanced Visualization Market Overview
Strong Regional Growth Trajectory :
Rest Of Asia Pacific's advanced visualization market is expanding at 10.6% CAGR, growing from $187.2 million in 2024 to $310.0 million by 2029, reflecting accelerating healthcare digitalization across emerging economies.
Diagnostic Imaging Adoption Surge :
Increasing investment in diagnostic imaging infrastructure across Rest Of Asia Pacific countries is driving demand for advanced visualization solutions in radiology, pathology, and medical imaging centers.
Surgical Visualization Expansion :
Growing adoption of minimally invasive surgical procedures and OR visualization systems in Rest Of Asia Pacific hospitals is creating significant opportunities for advanced visualization technology providers.
Clinical Decision Support Integration :
Healthcare facilities in Rest Of Asia Pacific are increasingly implementing AI-powered clinical decision-support systems integrated with advanced visualization platforms to improve diagnostic accuracy and patient outcomes.
Rest Of Asia Pacific Advanced Visualization Market Dynamics
- The region's 10.6% CAGR reflects increasing adoption of digital health solutions, modernization of hospital facilities, and growing awareness of visualization's role in improving clinical outcomes. Key growth drivers include rising healthcare expenditures, expanding middle-class populations seeking quality care, and government initiatives promoting healthcare digitalization.
- As Rest Of Asia Pacific countries continue developing their healthcare systems, advanced visualization solutions will become increasingly critical for surgical planning, diagnostic imaging, and clinical training applications..
Market Ecosystem
Related Ecosystem
Diagnostic Imaging
- Magnetic Resonance Imaging (MRI)
- Computed Tomography (CT)
- CT Scanners
- Nuclear Imaging
- Positron Emission Tomography
- Siemens healthineers
- PHILIPS HEALTHCARE
- CANON INC.
- FUJIFILM Holdings Corporation
- UNITED IMAGING HEALTHCARE CO., LTD.
Healthcare Analytics
- Machine Learning
- Natural Language Processing (NLP)
- Blood Pressure Monitors
- Computed Tomography (CT)
- Magnetic Resonance Imaging (MRI)
- Oracle Corporation
- PHILIPS HEALTHCARE
- Siemens healthineers
- Zensar Technologies Limited
- EPIC SYSTEMS CORPORATION
Healthcare It
- Computed Tomography (CT)
- Machine Learning
- Magnetic Resonance Imaging (MRI)
- Natural Language Processing (NLP)
- Predictive Analytics
- CERNER CORPORATION
- PHILIPS HEALTHCARE
- Oracle Corporation
- GE HealthCare Technologies Inc.
- Siemens healthineers
Key Takeaways
- Rest Of Asia Pacific advanced visualization market will grow from $187.2M (2024) to $310.0M (2029) at a 10.6% CAGR.
- Rest Of Asia Pacific is experiencing accelerated adoption of 3D imaging, AR, and AI-integrated visualization in clinical workflows.
- Rest Of Asia Pacific's healthcare infrastructure modernization and rising medical technology investment are primary growth catalysts.
- Rest Of Asia Pacific represents a high-potential emerging market with strong demand for cost-effective, localized visualization solutions.
Advanced Visualization Market Report Scope
| Report Metric | Details |
|---|---|
| Base Year | 2024 |
| Fastest Growing Segment | CLOUD-BASED SOFTWARE (Deployment) |
| Forecast Period | 2024-2029 |
| Growth Rate | CAGR of 11.7% from 2024 to 2029 |
| Largest Segment | ENTERPRISE-WIDE THIN CLIENT-BASED SOLUTIONS (Solution Type) |
| Market Size Base Year (Billions) | ~USD 3.77 (2024) |
| Revenue Forecast (Billions) | ~USD 6.55 (2029) |
| Segments Covered | Offering, Type, Deployment, Solution Type, Imaging Modality, Application, End User |
Rest Of Asia Pacific Advanced Visualization Market Report Segmentation
7 segment dimensions are covered across the global market.
By Offering
- Hardware
- Services
- Software
By Type
- Cloud-Based Software
- Consulting/Optimization Services
- Implementation Services
- On-Premise Software
- Post-Sales & Maintenance Services
- Training & Education Services
By Deployment
- Cloud-Based Software
- On-Premise Software
By Solution Type
- Enterprise-Wide Thin Client-Based Solutions
- Standalone Workstation-Based Solutions
By Imaging Modality
- Computed Tomography (Ct)
- Magnetic Resonance Imaging (Mri)
- Nuclear Medicine
- Other Imaging Modalities
- Positron Emission Tomography (Pet)
- Radiotherapy (Rt)
- Ultrasound
By Application
- Cardiological Applications
- Neurological Applications
- Oncological Applications
- Orthopedic Application
- Orthopedic Applications
- Other Applications
- Radiological/Interventional Radiological Applications
- Vascular Applications
By End User
- Academic & Research Centers
- Diagnostic & Imaging Centers
- Hospitals & Ambulatory Surgical Centers
- Other End Users
Target Audience
- Healthcare Technology Vendors : Visualization software and hardware manufacturers need Rest Of Asia Pacific market data to identify expansion opportunities, localize solutions for emerging markets, and compete effectively in this high-growth region.
- Hospital & Healthcare Facility Operators : Healthcare administrators and procurement teams in Rest Of Asia Pacific require market insights to make informed technology investments, benchmark against regional peers, and plan digital transformation initiatives.
- Private Equity & Investment Firms : Investors targeting healthcare technology in emerging markets need Rest Of Asia Pacific-specific data to evaluate investment opportunities, assess market potential, and identify acquisition targets in this growing region.
- Medical Device Manufacturers : Device companies developing diagnostic and surgical visualization equipment need regional market intelligence to understand demand drivers, regulatory requirements, and distribution strategies in Rest Of Asia Pacific.
- Healthcare Consultants & Advisors : Strategy consultants advising healthcare organizations and technology providers require Rest Of Asia Pacific market data to develop regional expansion plans, competitive strategies, and technology roadmaps.
Reasons to Buy this Report
- Market-Specific Growth Intelligence : Gain detailed insights into Rest Of Asia Pacific's unique market dynamics, including country-level adoption patterns, regulatory environments, and competitive landscapes specific to emerging Asian healthcare markets.
- Emerging Market Entry Strategy : Develop targeted go-to-market strategies for Rest Of Asia Pacific with data-driven understanding of regional healthcare infrastructure gaps, investment priorities, and technology adoption readiness across diverse economies.
- Investment & Partnership Opportunities : Identify high-potential markets within Rest Of Asia Pacific for partnerships, acquisitions, and expansion, supported by granular market sizing, growth forecasts, and competitive positioning analysis.
- Segment-Specific Demand Analysis : Understand which visualization applications—diagnostic imaging, surgical visualization, or clinical decision support—are driving growth in Rest Of Asia Pacific to prioritize product development and sales efforts.
- Competitive Benchmarking : Benchmark your performance against regional competitors in Rest Of Asia Pacific with market share data, technology adoption trends, and emerging player strategies specific to this high-growth region.
Frequently asked questions
What is the market size of advanced visualization in Rest Of Asia Pacific?
Rest Of Asia Pacific's advanced visualization market was valued at $187.2 million in 2024 and is forecast to reach $310.0 million by 2029.
What is the growth rate for advanced visualization in Rest Of Asia Pacific?
Rest Of Asia Pacific's advanced visualization market is projected to grow at a compound annual growth rate (CAGR) of 10.6% from 2024 to 2029.
What are the key drivers of growth in Rest Of Asia Pacific's advanced visualization market?
Rest Of Asia Pacific's growth is driven by healthcare infrastructure modernization, increased adoption of diagnostic imaging technologies, rising investment in medical technology, and expanding hospital networks across emerging economies.
Which visualization technologies are gaining traction in Rest Of Asia Pacific?
Rest Of Asia Pacific is witnessing increased adoption of 3D imaging, augmented reality applications, and AI-integrated visualization platforms in surgical and diagnostic settings.
How is Rest Of Asia Pacific positioned compared to other Asia Pacific regions?
Rest Of Asia Pacific represents an emerging high-growth segment within Asia Pacific, characterized by strong demand for cost-effective, localized visualization solutions and increasing healthcare digitalization initiatives.
RESEARCH METHODOLOGY
The study involved significant activities to estimate the current size of the advanced visualization market. Exhaustive secondary research was done to collect information on the advanced visualization market. The next step was to validate these findings, assumptions, and sizing with industry experts across the value chain using primary research. Different approaches, such as top-down and bottom-up, were employed to estimate the total market size. After that, the market breakup and data triangulation procedures were used to estimate the market size of the segments and subsegments of the advanced visualization market.
Secondary Research
This research study involved the wide use of secondary sources, directories, and databases such as Dun & Bradstreet, Bloomberg Businessweek, and Factiva; white papers, annual reports, and companies’ house documents; investor presentations; and the SEC filings of companies. The market for the companies offering advanced visualization solutions is arrived at by secondary data available through paid and unpaid sources, analyzing the product portfolios of the major companies in the ecosystem, and rating the companies by their performance and quality. Various sources were referred to in the secondary research process to identify and collect information for this study. The secondary sources include annual reports, press releases, investor presentations of companies, white papers, journals, certified publications, and articles from recognized authors, directories, and databases.
Various secondary sources were referred to in the secondary research process to identify and collect information related to the study. These sources included annual reports, press releases, investor presentations of advanced visualization vendors, forums, certified publications, and whitepapers. The secondary research was used to obtain critical information on the industry’s value chain, the total pool of key players, market classification, and segmentation from the market and technology-oriented perspectives.
Primary Research
In the primary research process, various sources from both the supply and demand sides were interviewed to obtain qualitative and quantitative information for this report. Primary sources are mainly industry experts from the core and related industries and preferred suppliers, manufacturers, distributors, technology developers, researchers, and organizations related to all segments of this industry’s value chain. In-depth interviews were conducted with various primary respondents, including key industry participants, subject-matter experts (SMEs), C-level executives of key market players, and industry consultants, among other experts, to obtain and verify the critical qualitative and quantitative information as well as assess prospects.
Primary research was conducted to identify segmentation types; industry trends; key players; and key market dynamics such as drivers, restraints, opportunities, challenges, industry trends, and strategies adopted by key players.
After the complete market engineering (calculations for market statistics, market breakdown, market size estimations, market forecasting, and data triangulation), extensive primary research was conducted to gather information and verify and validate the critical numbers arrived at.
In the complete market engineering process, the top-down and bottom-up approaches and several data triangulation methods were extensively used to perform the market estimation and market forecasting for the overall market segments and subsegments listed in this report. Extensive qualitative and quantitative analysis was performed on the complete market engineering process to list the key information/insights throughout the report.
Breakdown of the Primary Respondents:
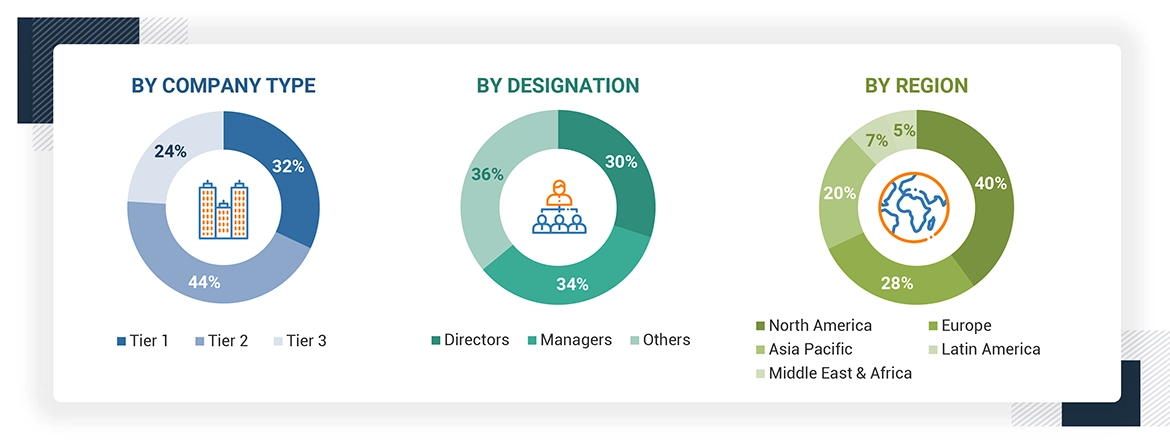
*Others include sales managers, marketing managers, and product managers.
Note: Tiers are defined based on a company’s total revenue, as of 2023: Tier 1 = >USD 1 billion, Tier 2 = USD 500 million to USD 1 billion, and Tier 3 = < USD 500 million.
To know about the assumptions considered for the study, download the pdf brochure
Market Size Estimation
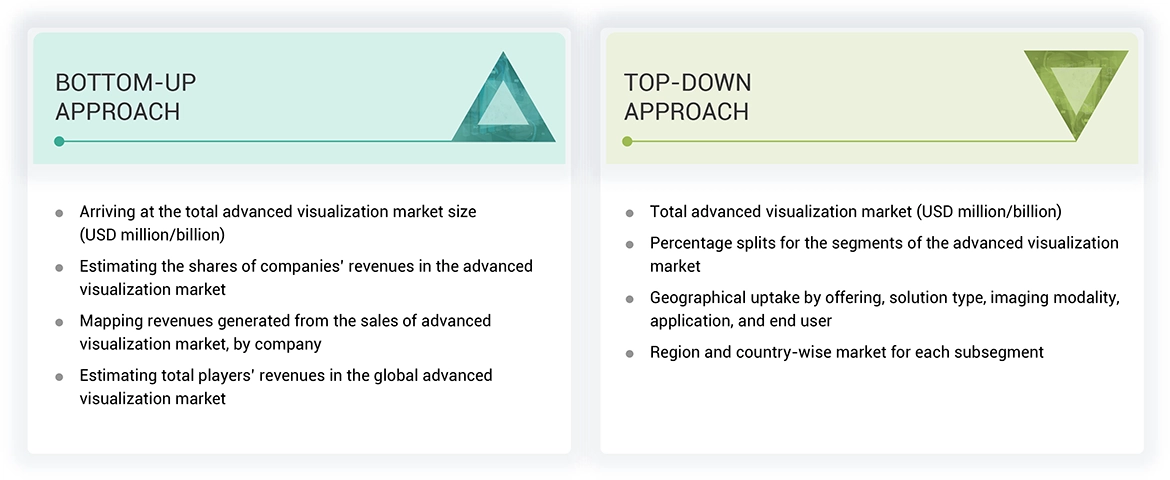
The market size estimates and forecasts provided in this study are derived through a mix of the bottom-up approach (revenue share analysis of leading players) and top-down approach (assessment of utilization/adoption/penetration trends, by offering, solution type, imaging modality, application, end user, and region).
Data Triangulation
After arriving at the overall market size—using the market size estimation processes—the market was split into several segments and subsegments. To complete the overall market engineering process and arrive at the exact statistics of each market segment and sub-segment, the data triangulation and market breakdown procedures were employed, wherever applicable. The data was triangulated by studying various factors and trends from both the demand and supply sides in the advanced visualization market.
Market Definition
Advanced visualization (AV) solutions enable physicians to access and share large data sets of images through an AV device-software interface. These solutions allow physicians or clinicians to visualize and analyze focus area of a patient’s body to accurately diagnose disease pathology for effective and timely treatment.
Stakeholders
- Advanced visualization software vendors
- Advanced visualization service providers
- Independent software vendors (ISVs)
- Original equipment manufacturers (OEMs) of imaging modalities
- Picture archiving and communication system (PACS) vendors
- Platform providers
- Technology providers
- System integrators
- Healthcare IT service providers
- Hospitals and surgical centers
- Diagnostic imaging centers
- Clinical research organizations
- Academic institutes and research laboratories
- Forums, alliances, and associations
- Government organizations
- Institutional investors and investment banks
- Investors/Shareholders
- Venture capitalists
- Research and consulting firms
Report Objectives
- To define, describe, and forecast the global Advanced visualization market based on offering, solution type, imaging modality, application, end user, and region
- To provide detailed information regarding the factors influencing the growth of the market (such as the drivers, restraints, opportunities, and challenges)
- To strategically analyze micromarkets with respect to individual growth trends, prospects, and contributions to the overall advanced visualization market
- To analyze market opportunities for stakeholders and provide details of the competitive landscape for market leaders
- To forecast the size of the advanced visualization market in five main regions (along with their respective key countries): North America, Europe, the Asia Pacific, Latin America, and the Middle East & Africa
- To profile key players and comprehensively analyze their product portfolios, market positions, and core competencies in the market
- To track and analyze competitive developments such as product & service launches; expansions; partnerships, agreements, and collaborations; and acquisitions in the advanced visualization market
- To benchmark players within the advanced visualization market using the Company Evaluation Matrix framework, which analyzes market players on various parameters within the broad categories of business strategy, market share, and product offering
Get the Full Advanced Visualization Market Report
Full forecast, segment splits, and company analysis for all Advanced Visualization Market.
- US Advanced Visualization Market
- Canada Advanced Visualization Market
- Germany Advanced Visualization Market
- UK Advanced Visualization Market
- France Advanced Visualization Market
- Spain Advanced Visualization Market
- Italy Advanced Visualization Market
- Japan Advanced Visualization Market
- China Advanced Visualization Market
- India Advanced Visualization Market
- Brazil Advanced Visualization Market
- Mexico Advanced Visualization Market
- Rest Of Europe Advanced Visualization Market
- Rest Of Latin America Advanced Visualization Market
Need a Tailored Report?
Customize this report to your needs
Get 10% FREE Customization
Customize This Report
