
Canada Agricultural Micronutrients Market (2023-2028)

The Canada Agricultural Micronutrients Market was valued at $153.5 Million in 2023 and projected to reach to $224.5 Million by 2028, representing a compound annual growth rate of CAGR 7.9%. Canada's agricultural micronutrients market is positioned for steady growth as farmers prioritize soil optimization and crop yield enhancement.


| Market Size in | USD 26.32 MN |
| Market Forecast in | |
| CAGR | |
| Forecast Period | |
| Units Considered | Value (USD MN) |
Canada Agricultural Micronutrients Market Trends and Insights
- This growth reflects Canada's increasing focus on soil health, crop productivity, and sustainable farming practices across its diverse agricultural regions.
- Canada's market expansion is driven by rising awareness among farmers regarding micronutrient deficiencies and their impact on yield quality and food security. The Canadian agricultural sector is adopting micronutrient solutions to address soil depletion and optimize fertilizer efficiency.
- Canada's market growth is supported by government agricultural initiatives, precision farming adoption, and the country's commitment to sustainable food production.
- Between 2023 and 2028, Canada is expected to see heightened demand for zinc, boron, manganese, and iron-based micronutrient products as farmers seek to enhance crop performance and meet export quality standards..
Key Market Statistics
- CAGR (2023-2028) CAGR 7.9%
- Market Size, 2023 ~USD 153.5 Million
- Forecast, 2028 ~USD 224.5 Million
- Country Canada
Canada Agricultural Micronutrients Market Overview
Market Valuation Growth :
Canada's agricultural micronutrients market reached $153.5 million in 2023 and is forecast to expand to $224.5 million by 2028, representing a robust 7.9% CAGR driven by intensified agricultural productivity demands.
Soil Health & Sustainability Focus :
Canadian farmers are increasingly adopting micronutrient solutions to enhance soil health and support sustainable farming practices, particularly across prairie provinces and specialty crop regions.
Regional Agricultural Diversity :
Canada's varied climate zones and crop types—from grains in the prairies to vegetables and fruits in Ontario and British Columbia—create distinct micronutrient application opportunities across regions.
Regulatory & Environmental Drivers :
Stricter environmental regulations and government incentives for sustainable agriculture are pushing Canadian farmers toward precision micronutrient management and certified organic farming practices.
Canada Agricultural Micronutrients Market Dynamics
- The 7.9% CAGR reflects growing adoption of micronutrient-fortified fertilizers and foliar sprays across major agricultural provinces.
- Increasing investment in precision agriculture technologies and organic farming certifications will further accelerate market expansion through 2028. The Canadian market benefits from strong government support for sustainable agriculture initiatives and rising commodity prices incentivizing higher-value crop production.
- Regional variations in soil deficiencies and crop types create tailored demand for zinc, boron, manganese, and iron products.
- Strategic partnerships between input suppliers and agricultural cooperatives will drive market penetration in underserved rural communities..
Market Ecosystem




OVERVIEW
Source: Secondary Research, Interviews with Experts, MarketsandMarkets Analysis
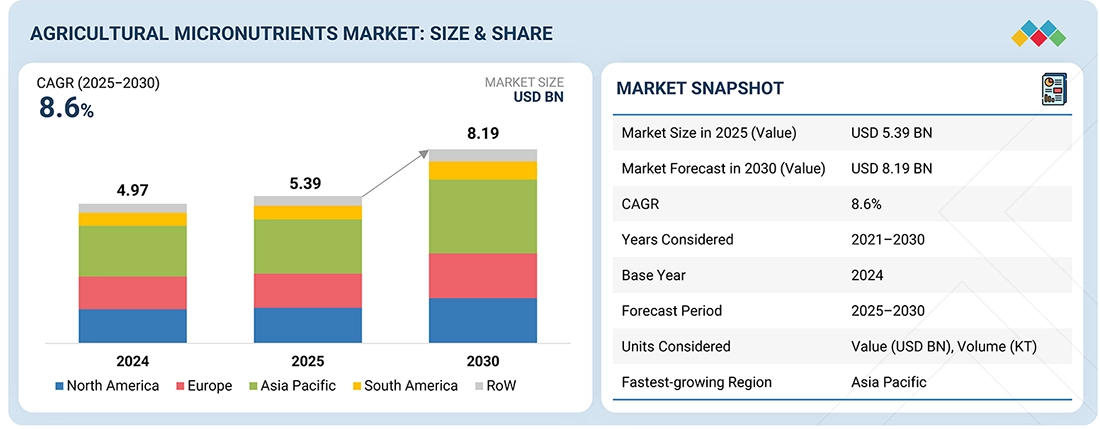
The global agricultural micronutrients market is projected to grow from USD 5.39 billion in 2025 to USD 8.19 billion by 2030, registering a CAGR of 8.6%, owing to the rising focus on providing well-rounded diets for crops and adopting science-backed agronomic practices. The rising demand for micronutrients that improve crop yield, quality, nutrient uptake efficiency, and resilience to various stresses, such as insects, diseases, and climatic extremes, across crop types, including cereals & grains, fruits & vegtables, and oils & pulses, will boost the growth of the agricultural micronutrients market.
Market Size and Forecast:
- Market Size Value in 2024: USD 4.97 Billion
- Market Size Value in 2025: USD 5.39 Billion
- Revenue Forecast in 2030: USD 8.19 Billion
- Growth Rate: CAGR of 8.6% from 2025 to 2030
- Base year: 2024
- Forecast period: 2025–2030
- Asia Pacific is expected to account for a significant share of 43% of the agricultural micronutrients market in 2025.
- The molybdeum segment is expected to dominate with a market share of 34.9% of the agricultural micronutrients market in 2025.
- The non-chelated micronutrients segment is estimated to hold a 69.1% market share in 2025.
Key Market Trends and Insights
- By Nutrient Type: Rising adoption of zinc, boron, iron, and manganese-based fertilizers is driving strong demand in the agriculture micronutrients market.
- By Form: Chelated and liquid micronutrients are witnessing increasing adoption due to their higher nutrient efficiency, faster absorption, and compatibility with precision farming techniques.
- Performance Benefits: Agricultural micronutrients enhance crop productivity, improve nutrient absorption, strengthen plant immunity, and support better yield quality across diverse crop types.
- Market Transformation Trends: Farmers are increasingly shifting toward precision farming, balanced fertilization practices, and micronutrient-enriched crop nutrition solutions to improve soil fertility and sustainable agricultural output.
- Strategic Growth Scope: Expanding demand for high-value crops, increasing soil nutrient deficiencies, and growing investments in advanced fertilizer technologies are creating significant market expansion opportunities.
KEY TAKEAWAYS
-
BY REGIONAsia Pacific is expected to account for a significant share of 43% of the agricultural micronutrients market in 2025.
-
BY TYPEBy type, the molybdeum segment is expected to dominate with a market share of 34.9% of the agricultural micronutrients market in 2025.
-
BY CROP TYPEBy crop type, the fruits & vegetables segment is projected to register a notable growth rate during the forecast period.
-
BY FORMBy form, the non-chelated micronutrients segment is estimated to hold a 69.1% market share in 2025.
-
BY MODE OF APPLICATIONBy mode of application, the foliar application segment is expected to lead by 36.9% of the agricultural micronutrients market in 2025.
-
COMPETITIVE LANDSCAPE - KEY PLAYERSBASF SE, Nouryon, Nufarm, Yara International ASA, Syngenta AG, The Mosaic Company, and Coromandel International Limited were identified as some of the key players in the agricultural micronutrients market.
-
COMPETITIVE LANDSCAPE - STARTUPSManvert, Zuari Agrochemicals, Haifa Negev Technologies, Stoller Enterprises, and ATP Nutrition, among others, have established a presence as emerging players in the agricultural micronutrients market.
The market for agricultural micronutrients is currently growing steadily with an increase in the interest of growers in ensuring that their crops receive well-balanced nutrients. Additionally, the rising awareness of micronutrient deficiencies in the soil and the adoption of modern farming technologies have increased the application of micronutrients in major crops.
TRENDS & DISRUPTIONS IMPACTING CUSTOMERS' CUSTOMERS
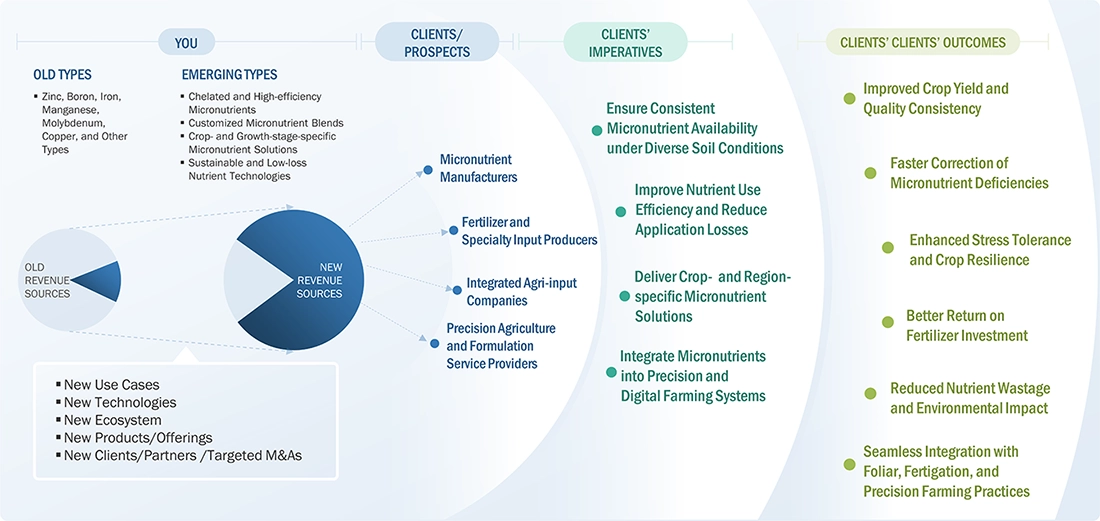
The market for micronutrients is shifting from conventional to advanced, diversified solutions. Although currently the revenue is generated from conventional micronutrients such as zinc, boron, iron, manganese, molybdenum, and copper, future revenue will be generated from emerging solutions such as chelated micronutrients, customized blends, crop-specific solutions, and sustainable low-loss nutrients being developed by various companies such as micronutrient companies, fertilizer companies, integrated ag input companies, and precision agriculture service companies. These emerging solutions are aimed at maximizing efficiency, ensuring the presence of nutrients in various soil conditions, and facilitating precision farming to increase crop yield and quality, correct nutrient deficiencies quickly, and improve return on investment from fertilizers.
Source: Secondary Research, Interviews with Experts, MarketsandMarkets Analysis
MARKET DYNAMICS

Level
-
Expansion of commercial and intensive farming systems

-
Rising focus on improving crop yield, quality, and nutrient use efficiency


Level
-
Volatility in raw material and fertilizer input prices

-
Limited awareness and adoption among smallholder farmers


Level
-
Growing demand for chelated and specialty micronutrient formulations

-
Adoption of precision agriculture and targeted nutrient application


Level
-
Price competition from conventional fertilizer products

-
Regulatory compliance and formulation standardization

Source: Secondary Research, Interviews with Experts, MarketsandMarkets Analysis
Driver: Expansion of commercial and intensive farming systems
The growing need for integrated agricultural methodologies and commercial farming is triggering a demand for well-balanced micronutrient application for overcoming soil deficiencies and enhancing produce quality and efficiency.
Restraint: Volatility in raw material and fertilizer input prices
The fluctuations with respect to fertilizer prices and raw materials increase the cost inputs, making it difficult for micronutrient products to be adopted.
Opportunity:Growing demand for chelated and specialty micronutrient formulations
The increasing use of chelated and specialized micronutrients, driven by practices such as precision agriculture, is offering various opportunities for targeted, value-added crop nutrient management.
Challenge: Price competition from conventional fertilizer products
Price competition offered by traditional fertilizers, as well as the requirement to adhere to different regulations in different regions, remain obstacles in the adoption of advanced micronutrient compounds.
AGRICULTURAL MICRONUTRIENTS MARKET: COMMERCIAL USE CASES ACROSS INDUSTRIES
| COMPANY | USE CASE DESCRIPTION | BENEFITS |
|---|---|---|
 |
Application of chelated micronutrients in cereals, fruits, and vegetables to address soil nutrient deficiencies | Improves nutrient availability | Enhances crop yield and quality | Supports sustainable soil management |
 |
Integration of micronutrient-enriched fertilizers through soil and fertigation systems | Enables balanced crop nutrition | Improves nutrient use efficiency | Supports precision agriculture practices |
 |
Use of specialty chelating agents in micronutrient formulations for broad-acre and horticultural crops | Enhances micronutrient stability |Improves uptake under challenging soil conditions | Reduces nutrient losses |
 |
Deployment of crop-specific micronutrient solutions combined with crop protection programs | Strengthens plant health | Iproves stress tolerance | Supports integrated crop management strategies |
Logos and trademarks shown above are the property of their respective owners. Their use here is for informational and illustrative purposes only.
MARKET ECOSYSTEM
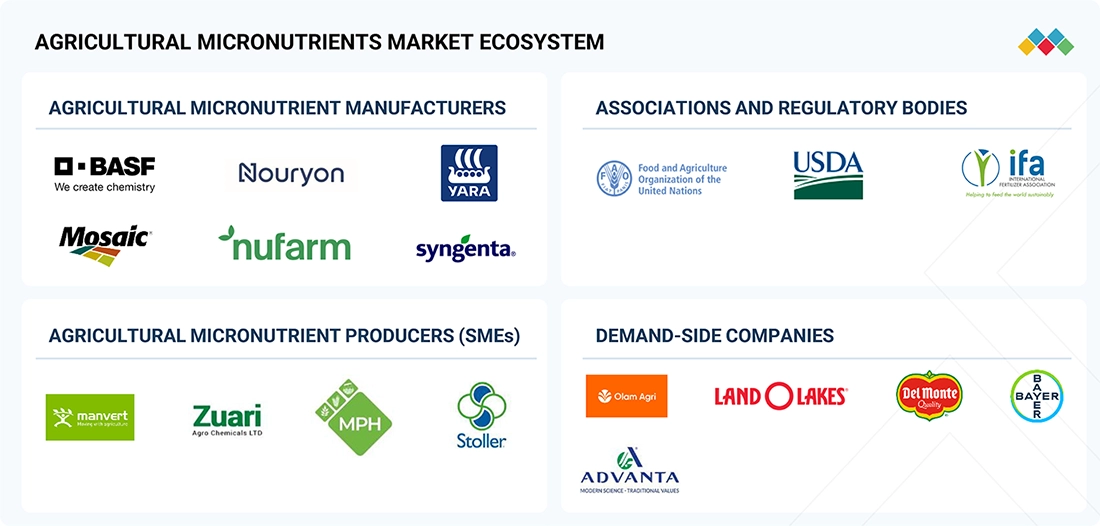
The agricultural micronutrients market is a part of a comprehensive global agricultural micronutrients ecosystem, which includes entities such as agricultural micronutrient producers; fertilizer, specialty, and agricultural input producers; agricultural micronutrient distributors; agricultural micronutrient regulatory agencies; agricultural research agencies; agricultural communities; and end users. The agricultural micronutrients market is a continuously growing, agronomy-based sector that is shaped by advancements in soil health, balanced plant nutrition, and sustainable yield growth. Multinational and local companies come together as part of this sector, resulting in the growth of innovative agricultural micronutrients.
Logos and trademarks shown above are the property of their respective owners. Their use here is for informational and illustrative purposes only.
MARKET SEGMENTS
Source: Secondary Research, Interviews with Experts, MarketsandMarkets Analysis
Agricultural Micronutrients Market, by Type
The market is anticipated to be dominated by molybdenum due to the importance of the element in the fixation of nitrogen and enzyme functions, especially in legume and cereal crops, as well as due to the increasing use of the element to counter nutrient deficiencies in the soil.
Agricultural Micronutrients Market, by Crop Type
The fruits & vegetables category is projected to register robust growth, as horticultural crops are very responsive to the treatment of micronutrients and need accurate nutrient management to enhance the quality, storage life, and appearance of produce.
Agricultural Micronutrients Market, by Form
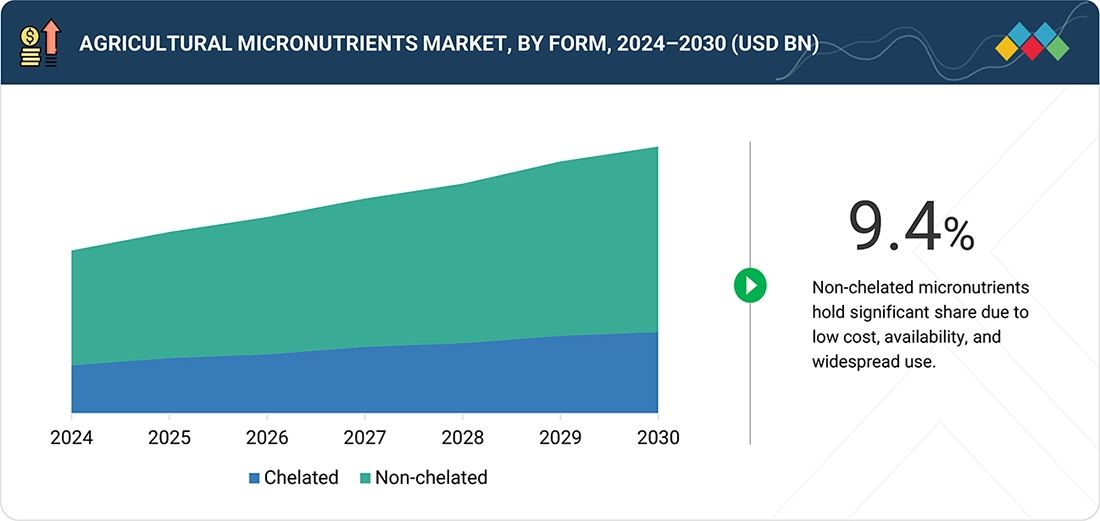
The market share of non-chelated micronutrients is expected to be significant, as these micronutrients are are cost-effective, readily available, and are used widely by many farmers as a mode of conventional or large-scale agriculture.
Agricultural Micronutrients Market, by Mode of Application
The foliar application is poised to lead due to its quick uptake of nutrients, targeted delivery, and efficiency in rapidly addressing micronutrient deficiencies in a broad spectrum of agricultural products.
REGION
Asia Pacific is expected to dominate the agricultural micronutrients market
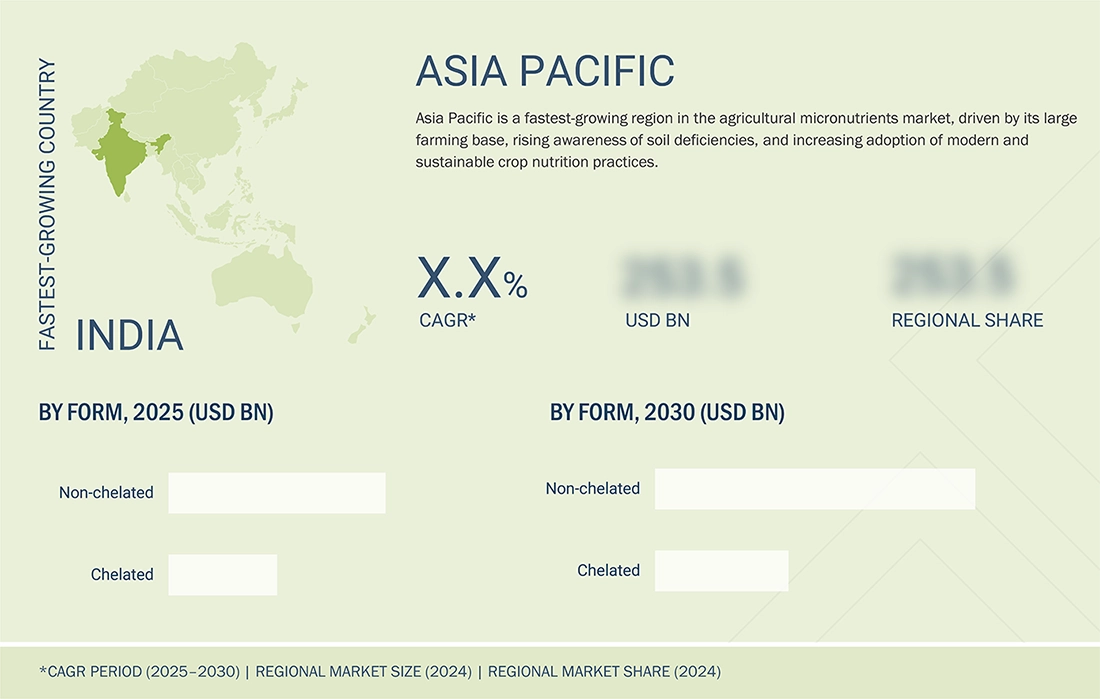
Asia Pacific is poised to lead the market for agricultural micronutrients, owing to its vast agricultural base, extremely high cropping intensity, and rising awareness regarding soil micronutrient deficiencies. The increasing acceptance of advanced agriculture practices and measures by governments to enhance crop productivity and soil health will also boost the demand for micronutrient-based crop nutritional solutions in the Asia Pacific region.
AGRICULTURAL MICRONUTRIENTS MARKET: COMPANY EVALUATION MATRIX
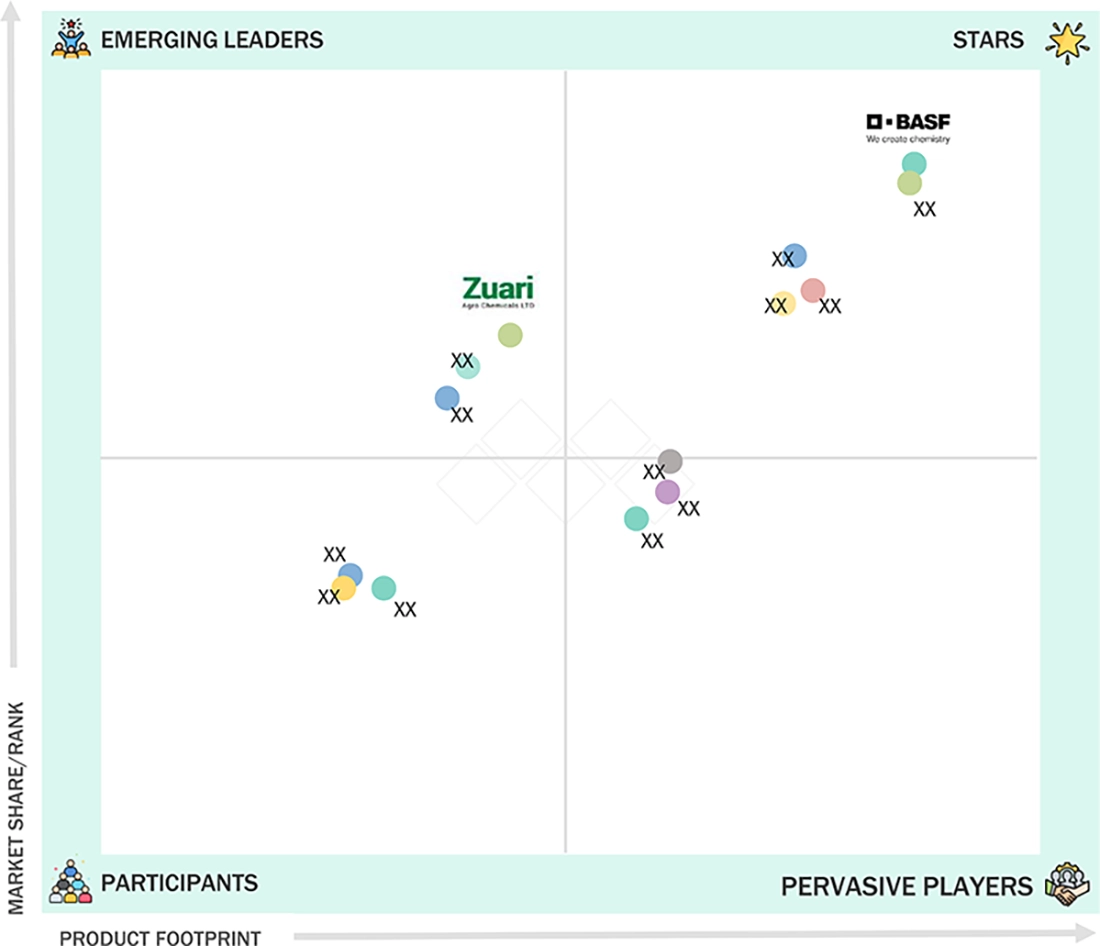
In the agricultural micronutrients market landscape, leading players such as BASF SE and Yara International ASA (Star) hold strong market positions, supported by their large-scale production capabilities, comprehensive micronutrient portfolios, and well-established global distribution networks. Their integration with fertilizer and crop nutrition programs and emphasis on consistent, science-backed micronutrient solutions reinforce their dominance. Meanwhile, Zuari Agro Chemicals Ltd (Emerging Leader) is strengthening its presence through specialized micronutrient blends and customized crop nutrition solutions, addressing region-specific soil deficiencies and evolving crop productivity and quality requirements.
Source: Secondary Research, Interviews with Experts, MarketsandMarkets Analysis
KEY MARKET PLAYERS
- BASF SE (Germany)
- Yara International ASA (Norway)
- Nouryon (Netherlands)
- Syngenta AG (Switzerland)
- The Mosaic Company (US)
- Coromandel International Limited (India)
- Nufarm Limited (Australia)
- Haifa Negev Technologies Ltd (Israel)
- Manvert (Spain)
- Zuari Agrochemicals Ltd (India)
MARKET SCOPE
| REPORT METRIC | DETAILS |
|---|---|
| Market Size in 2025 (Value) | USD 5.39 Billion |
| Market Forecast in 2030 (Value) | USD 8.19 Billion |
| Growth Rate | CAGR of 8.6% from 2025 to 2030 |
| Years Considered | 2021–2030 |
| Base Year | 2024 |
| Forecast Period | 2025–2030 |
| Units Considered | Value (USD Billion), Volume (Kiloton) |
| Report Coverage | Revenue Forecast, Company Ranking, Competitive Landscape, Growth Factors, and Trends |
| Segments Covered | By Type: Zinc, Boron, Iron, Manganese, Molybdenum, Copper, and Other Types By Form: Chelated Micronutrients (EDTA, EDDHA, DTPA, IDHA, and Other Chelates) and Non-Chelated Micronutrients By Crop Type: Cereals & Grains, Oilseeds & Pulses, Fruits & Vegetables, and Other Crop Types By Mode of Application: Foliar, Fertigation, Soil, and Other Modes of Application |
| Regions Covered | North America, Europe, Asia Pacific, South America, and RoW |
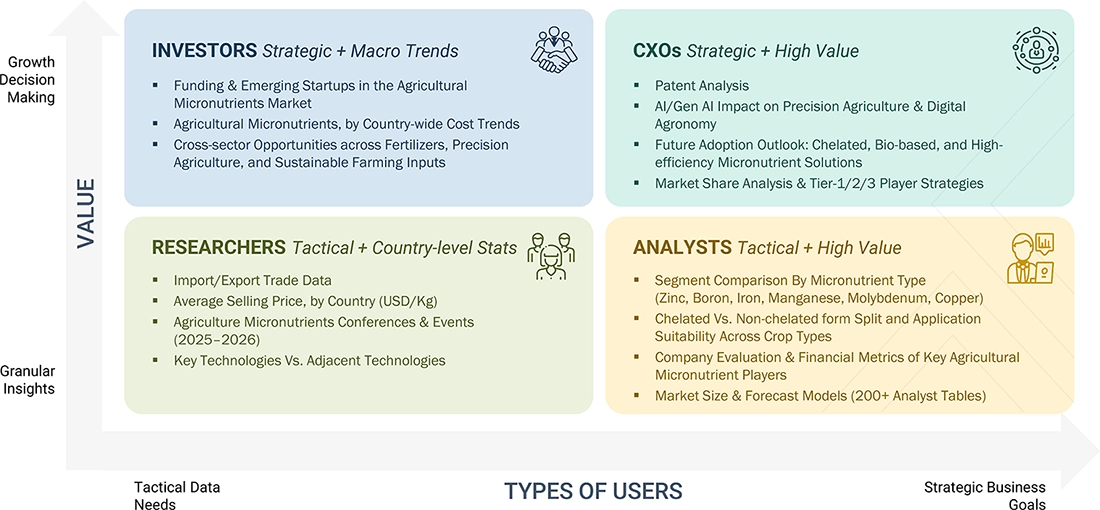
WHAT IS IN IT FOR YOU: AGRICULTURAL MICRONUTRIENTS MARKET REPORT CONTENT GUIDE
DELIVERED CUSTOMIZATIONS
We have successfully delivered the following deep-dive customizations:
| CLIENT REQUEST | CUSTOMIZATION DELIVERED | VALUE ADDS |
|---|---|---|
| US-based Agricultural Micronutrient Manufacturers | Detailed analysis of the agricultural micronutrients market, by micronutrient type (zinc, boron, iron, manganese, molybdenum, copper, and others), form (chelated and non-chelated), mode of application (soil, foliar, fertigation), and crop type (cereals & grains, fruits & vegetables, oilseeds & pulses, and others). Comprehensive competitive landscape assessment covering key micronutrient manufacturers, fertilizer companies, and specialty input suppliers, including evaluation of production capabilities, product portfolios, and distribution presence. Customer landscape evaluation across growers, agri-input distributors, and cooperatives, along with market benchmarking, pricing dynamics, and regulatory review for agricultural micronutrients in the US. | Identified and profiled 20+ agricultural micronutrient manufacturers and suppliers operating in North America, including global leaders, regional players, and specialty micronutrient providers. Tracked adoption trends for micronutrient application across major crop segments, highlighting demand driven by yield optimization, soil health improvement, and sustainable farming practices. Mapped regulatory and compliance requirements for micronutrient usage in agriculture, supporting client decision-making on product positioning, formulation strategy, and market entry. |
| Agricultural micronutrients – Type, Form & Application Segment Assessment | Segmentation of agricultural micronutrient demand by micronutrient type, crop type, form, and mode of application. Benchmarked adoption and usage patterns of micronutrients across cereals, horticultural crops, and oilseeds, with emphasis on nutrient deficiency correction, yield response, and crop quality improvement. Assessed switching barriers for farmers and distributors, including cost sensitivity, formulation effectiveness, compatibility with existing fertilization practices, and regulatory compliance. | Delivered revenue share and growth outlook for key micronutrient segments across crop categories. Identified substitution risks and opportunities between conventional micronutrient products and chelated or specialty formulations in cost-sensitive markets. Mapped regulatory frameworks and approval pathways relevant to agricultural micronutrients, enabling clearer go-to-market and product differentiation strategies. |
RECENT DEVELOPMENTS
- October 2021 : Grupa Azoty announced its 2021–2030 strategy, positioning Green Azoty as a flagship initiative focused on decarbonization and carbon-emission reduction. The strategy includes R&D projects aligned with the European Green Deal and the development of new environmentally friendly solutions, including micronutrient-enriched formulations derived from utilized waste streams.
- April 2021 : Compass Minerals entered into a definitive agreement with Koch Agronomic Service (LLP), a subsidiary of Koch Industries, to sell its North American micronutrient assets for approximately USD 60.25 million, strengthening Koch’s position in agricultural micronutrients.
- March 2021 : The Mosaic Company and Sound Agriculture announced a strategic partnership to develop nutrient-efficient fertilizer products using a proprietary blend of bio-inspired chemistry and key micronutrients, aimed at improving crop yields and enhancing soil health across major crops.
- May 2024 : Yara International ASA (Norway) and BASF SE (Germany) announced a strategic partnership to co-develop and commercialize next-generation micronutrient fertilizers, with a focus on sustainable, high-efficiency solutions for global agricultural applications.
Related Ecosystem
Agrochemicals
- Phosphatic Fertilizers
- Potassic Fertilizers
- Fungicides
- Anticoagulant Rodenticides
- Ammonium Nitrate
- AZELIS HOLDINGS SA
- Basf se
- Origin Enterprises plc
- MITSUI AGRO BUSINESS SACO
- SNF HOLDING COMPANY INC.
Key Takeaways
- Canada's agricultural micronutrients market is valued at $153.5 million in 2023 and will reach $224.5 million by 2028, growing at 7.9% CAGR.
- Canada's market growth is driven by soil health awareness, precision agriculture adoption, and sustainable farming practices across the country.
- Canada's farmers are increasingly investing in micronutrient solutions to address soil deficiencies and improve crop yield and quality.
- Canada's market expansion is supported by government agricultural policies and the nation's focus on food security and export competitiveness.
Agricultural Micronutrients Market Report Scope
| Report Metric | Details |
|---|---|
| Base Year | 2023 |
| Fastest Growing Segment | EDTA (Type) |
| Forecast Period | 2023–2028 |
| Growth Rate | CAGR of 8.6% from 2023 to 2028 |
| Largest Segment | NON-CHELATED (Form) |
| Market Size Base Year (Billions) | ~USD 4.57 (2023) |
| Revenue Forecast (Billions) | ~USD 6.9 (2028) |
| Segments Covered | Crop Type, Subtype, Form, Type, Mode Of Application |
Canada Agricultural Micronutrients Market Report Segmentation
5 segment dimensions are covered across the global market.
By Crop Type
- Cereals & Grains
- Fruits & Vegetables
- Oilseeds & Pulses
- Other Crop Types
By Subtype
- Canola
- Corn
- Dtpa
- Eddha
- Edta
- Idha
- Other Cereals & Grains
- Other Chelated Micronutrients
- Other Oilseed & Pulses
- Other Oilseeds & Pulses
- Rice
- Soybean
- Wheat
By Form
- Chelated
- Non-Chelated
By Type
- Boron
- Copper
- Dtpa
- Eddha
- Edta
- Idha
- Iron
- Manganese
- Molybdenum
- Other Chelated Micronutrients
- Other Types
- Zinc
By Mode Of Application
- Fertigation
- Foliar
- Other Modes Of Application
- Soil
Target Audience
- Agricultural Input Manufacturers : Micronutrient producers and fertilizer companies need Canada-specific market data to develop localized product portfolios, optimize pricing strategies, and identify high-growth provincial markets.
- Farm Cooperatives & Distributors : Agricultural cooperatives and input distributors require detailed market insights to forecast demand, manage inventory across regions, and negotiate supplier contracts effectively.
- Agribusiness Investors & PE Firms : Investment firms evaluating opportunities in Canadian agriculture need comprehensive market analysis to assess growth potential, competitive dynamics, and exit opportunities in the micronutrients sector.
- Government & Policy Makers : Agricultural departments and policy organizations use market data to design subsidy programs, sustainability initiatives, and regulations supporting optimal micronutrient adoption among Canadian farmers.
- Farming Operations & Agronomists : Large-scale farms and agricultural consultants need market intelligence on micronutrient product availability, pricing trends, and best practices to optimize crop yields and soil health management.
Reasons to Buy this Report
- Regional Market Sizing & Forecasts : Obtain precise valuation data specific to Canada's micronutrients market with detailed 5-year projections, enabling accurate budget allocation and investment planning for agricultural input suppliers.
- Provincial Growth Drivers Analysis : Understand region-specific factors driving adoption across prairie provinces, Ontario, and British Columbia, including soil deficiency patterns and crop-specific micronutrient requirements.
- Competitive Landscape Intelligence : Identify key players, market consolidation trends, and distribution channels unique to Canada's agricultural sector to inform go-to-market strategies and partnership opportunities.
- Regulatory & Sustainability Insights : Access detailed analysis of Canadian environmental regulations, organic certification trends, and government incentive programs shaping micronutrient product demand and formulation requirements.
- Customer Segmentation & Demand Patterns : Leverage Canada-specific farmer demographics, crop preferences, and purchasing behaviors to tailor product offerings and marketing campaigns for maximum market penetration.
Frequently asked questions
What is the current size of Canada's agricultural micronutrients market?
Canada's agricultural micronutrients market was valued at $153.5 million in 2023 and is expected to grow to $224.5 million by 2028.
What is the growth rate of Canada's agricultural micronutrients market?
Canada's agricultural micronutrients market is growing at a compound annual growth rate of 7.9% from 2023 to 2028.
What micronutrients are most in demand in Canada?
Canada's farmers are increasingly demanding zinc, boron, manganese, and iron-based micronutrient products to address soil deficiencies and enhance crop performance.
What factors are driving growth in Canada's agricultural micronutrients market?
Canada's market growth is driven by increased awareness of soil health, adoption of precision farming technologies, government agricultural initiatives, and the country's commitment to sustainable food production.
How is Canada's micronutrients market expected to evolve by 2028?
Canada's market is expected to expand significantly by 2028 as farmers increasingly adopt micronutrient solutions to improve crop quality, meet export standards, and address soil depletion challenges.
RESEARCH METHODOLOGY
Get the Full Agricultural Micronutrients Market Report
Full forecast, segment splits, and company analysis for all Agricultural Micronutrients Market.
- US Agricultural Micronutrients Market
- Mexico Agricultural Micronutrients Market
- France Agricultural Micronutrients Market
- Germany Agricultural Micronutrients Market
- Italy Agricultural Micronutrients Market
- Poland Agricultural Micronutrients Market
- Spain Agricultural Micronutrients Market
- UK Agricultural Micronutrients Market
- China Agricultural Micronutrients Market
- India Agricultural Micronutrients Market
- Japan Agricultural Micronutrients Market
- Australia Agricultural Micronutrients Market
- Vietnam Agricultural Micronutrients Market
- Brazil Agricultural Micronutrients Market
- Argentina Agricultural Micronutrients Market
- South Africa Agricultural Micronutrients Market
- Turkey Agricultural Micronutrients Market
Need a Tailored Report?
Customize this report to your needs
Get 10% FREE Customization
Customize This Report
