
Asia Pacific Al-based Image Analysis Market (2025-2030)

The Asia Pacific Al-based Image Analysis Market was valued at $4272.1 Million in 2025 and projected to reach to $13016.5 Million by 2030, representing a compound annual growth rate of 25.0%. Asia Pacific's AI-based Image Analysis Market is positioned for unprecedented growth, fueled by the region's dominance in electronics manufacturing, semiconductor production, and industrial automation.


| Market Size in | USD 26.32 MN |
| Market Forecast in | |
| CAGR | |
| Forecast Period | |
| Units Considered | Value (USD MN) |
Asia Pacific Al-based Image Analysis Market Trends and Insights
- This region's 25.0% compound annual growth rate significantly outpaces the global average, driven by rapid digital transformation, manufacturing automation, and increased adoption of computer vision technologies across Asia Pacific economies.
- The region's semiconductor and electronics industries are leveraging AI-powered image analysis for quality control, defect detection, and process optimization. Asia Pacific's growth trajectory reflects strong investments in AI infrastructure, government initiatives supporting technology adoption, and the presence of major electronics manufacturers and semiconductor producers throughout the region.
- Countries across Asia Pacific are integrating AI-based image analysis into healthcare diagnostics, retail analytics, autonomous vehicles, and industrial applications.
- The competitive intensity in Asia Pacific is intensifying as both established technology leaders and emerging startups accelerate their market presence to capture the expanding demand for intelligent image processing solutions..
Key Market Statistics
- CAGR (2025-2030) 25.0% CAGR
- Market Size, 2025 ~USD 4272.1 Million
- Forecast, 2030 ~USD 13016.5 Million
- Geography Asia Pacific
Asia Pacific Al-based Image Analysis Market Overview
Market Dominance :
Asia Pacific commands the largest share of the global AI-based Image Analysis Market, with a 2025 valuation of $4,272.1 million, reflecting the region's technological leadership and manufacturing prowess.
Exceptional Growth Trajectory :
The region's 25.0% CAGR from 2025-2030 significantly exceeds the global average of 22.7%, demonstrating Asia Pacific's accelerated adoption of computer vision and AI technologies.
Forecast Expansion :
Market size is projected to reach $13,016.5 million by 2030, representing a 205% increase over five years, driven by manufacturing automation and digital transformation initiatives across the region.
Key Growth Drivers :
Rapid industrialization, increased investment in smart manufacturing, and widespread adoption of AI-powered quality control systems are propelling Asia Pacific's market expansion ahead of other global regions.
Asia Pacific Al-based Image Analysis Market Dynamics
- Countries like China, Japan, and India are leading investments in computer vision technologies for quality assurance, defect detection, and process optimization across manufacturing sectors. The region's 25.0% CAGR reflects strong demand from automotive, electronics, pharmaceuticals, and logistics industries adopting AI-powered visual inspection systems.
- Government initiatives supporting Industry 4.0, coupled with declining AI technology costs and increasing availability of skilled talent, will sustain robust market expansion through 2030, positioning Asia Pacific as the global epicenter for AI-based image analysis innovation..
Market Ecosystem
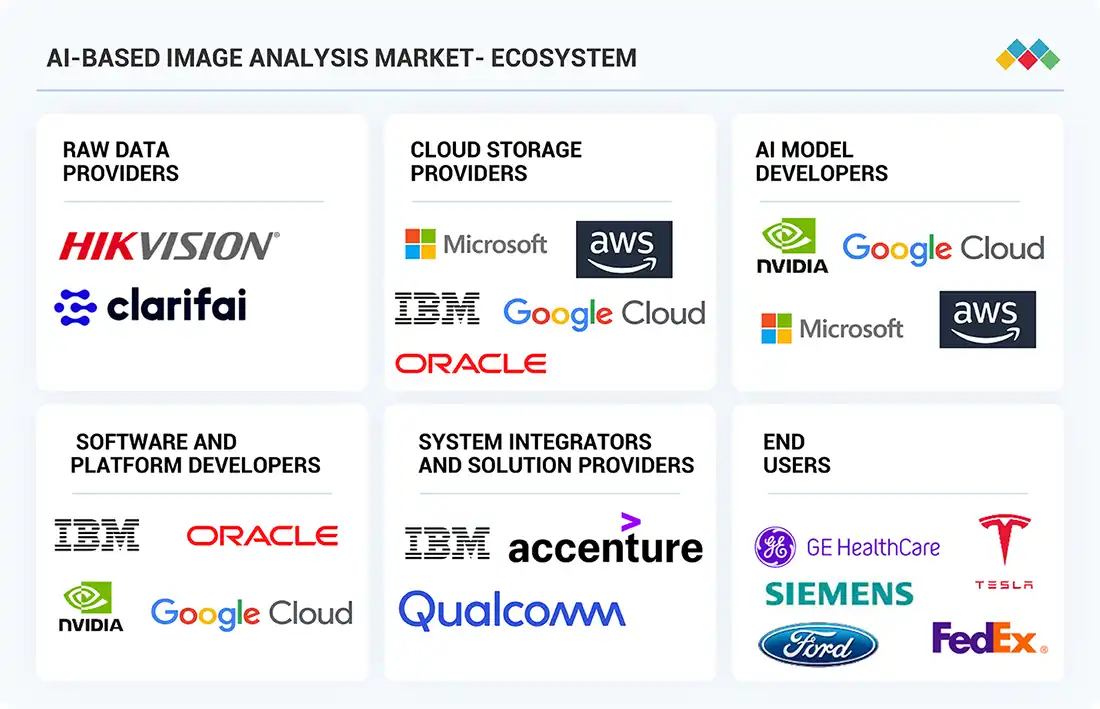
AI-based Image Analysis Market: COMMERCIAL USE CASES ACROSS INDUSTRIES
| COMPANY | USE CASE DESCRIPTION | BENEFITS |
|---|---|---|
 |
AI vision solutions and software for various industries, such as manufacturing, automotive & transportation, and telecommunication, among others | Image comparison & analysis suitable for vision AI developers, software partners, startups, and OEMs creating IVA applications and services |
 |
AI vision services for BFSI, healthcare, and manufacturing, among others | Analyze visual content in various ways, such as image analysis, spatial analysis, optical character recognition, and facial recognition based on inputs and user preferences |
 |
AI vision software for aerospace, retail, and healthcare, among others | Simplifies data labeling, model training, optimization, and speeds up data upload, model training, and inference workflows |
 |
AI vision software & services for manufacturing, retail, and healthcare, among others | Support real-time video data and store insights in vision warehouse for querying and metadata access |
 |
Amazon Rekognition for retail, healthcare, BFSI, and telecommunications, among others | Reduces costs and automates image recognition and video analysis using machine learning |
Logos and trademarks shown above are the property of their respective owners. Their use here is for informational and illustrative purposes only.
Related Ecosystem
Internet Of Things And M2M
- Sensors
- Cellular Network
- Digital Signal Processor (DSP)
- Global Positioning System (GPS)
- Image Sensors
- MITSUI ELECTRONICS INC
- MICROSOFT CORPORATION
- INTEL CORPORATION
- Amazon.com, Inc.
- Cisco Systems, Inc.
Key Takeaways
- Asia Pacific AI-based Image Analysis Market will grow from $4,272.1M (2025) to $13,016.5M (2030), representing a 25.0% CAGR.
- Asia Pacific's growth rate exceeds the global CAGR of 22.7%, positioning the region as the fastest-growing market for AI image analysis.
- Manufacturing automation and semiconductor quality control are primary drivers of AI-based image analysis adoption across Asia Pacific.
- Asia Pacific's dominance is supported by major electronics manufacturers, government AI initiatives, and expanding enterprise digital transformation investments.
Al-based Image Analysis Market Report Scope
| Report Metric | Details |
|---|---|
| Base Year | 2025 |
| Fastest Growing Segment | CLOUD-BASED (Deployment Mode) |
| Forecast Period | 2025-2030 |
| Growth Rate | CAGR of 22.7% from 2025 to 2030 |
| Largest Segment | DEEP LEARNING (Technology) |
| Market Size Base Year (Billions) | ~USD 13.07 (2025) |
| Revenue Forecast (Billions) | ~USD 36.36 (2030) |
| Segments Covered | Technology, Deployment Mode, End-Use Industry |
Asia Pacific Al-based Image Analysis Market Report Segmentation
3 segment dimensions are covered across the global market.
By Technology
- Deep Learning
- Hybrid And Other AI Technologies
- Traditional Machine Learning
By Deployment Mode
- Cloud-Based
- On-Premises
By End-Use Industry
- Automotive & Transportation
- GCC Countries
- Healthcare
- Manufacturing
- Other End-Use Industries
- Rest Of Middle East
- Retail & E-Commerce
Target Audience
- Technology Vendors & Solution Providers : Companies developing AI image analysis software and computer vision platforms need Asia Pacific market data to prioritize regional expansion, localize offerings, and capture market share in the world's fastest-growing region.
- Manufacturing & Industrial Enterprises : Manufacturers across Asia Pacific require market intelligence to evaluate AI-based visual inspection solutions, benchmark adoption rates, and make informed technology investment decisions for quality control and automation.
- Investment & Private Equity Firms : Investors targeting the semiconductor and electronics sectors need comprehensive Asia Pacific market analysis to identify acquisition targets, assess portfolio company growth potential, and evaluate regional investment opportunities.
- Government & Policy Makers : Regional government bodies and economic development agencies use market data to inform Industry 4.0 initiatives, technology adoption policies, and strategic investments in AI and automation infrastructure.
- Consultants & Business Strategists : Management consultants advising clients on digital transformation and technology adoption require detailed Asia Pacific market insights to develop region-specific strategies and competitive recommendations.
Countries within Asia Pacific - compare and drill down
| Country | 2025 size (native) |
|---|---|
| China | USD 3579.5 Million |
| Japan | USD 2434.1 Million |
| India | USD 2147.7 Million |
| South Korea | USD 1314.7 Million |
| Australia | USD 1015.3 Million |
| Taiwan | USD 715.9 Million |
| Indonesia | USD 416.5 Million |
| Rest Of Asia Pacific | USD 1392.8 Million |
Country market size visualization
Reasons to Buy this Report
- Regional Market Sizing : Obtain precise market valuations for Asia Pacific and individual country-level data, enabling accurate investment decisions and competitive positioning within the region's fastest-growing AI image analysis segment.
- Growth Opportunity Identification : Leverage detailed forecasts through 2030 to identify high-potential markets and emerging opportunities across Asia Pacific's diverse economies, from mature markets like Japan to high-growth markets like India.
- Competitive Landscape Intelligence : Understand regional market dynamics, key players, and competitive strategies specific to Asia Pacific, enabling informed go-to-market approaches and partnership opportunities.
- Industry-Specific Insights : Access sector-specific analysis for manufacturing, automotive, electronics, and logistics industries driving AI image analysis adoption across Asia Pacific economies.
- Strategic Planning Support : Utilize comprehensive regional data to support business expansion, product development, and investment strategies tailored to Asia Pacific's unique market characteristics and growth trajectory.
Frequently asked questions
What is the projected market size for AI-based Image Analysis in Asia Pacific by 2030?
Asia Pacific's AI-based Image Analysis Market is projected to reach $13,016.5 million by 2030, growing from $4,272.1 million in 2025.
What is the CAGR for AI-based Image Analysis in Asia Pacific?
Asia Pacific's AI-based Image Analysis Market is expected to grow at a compound annual growth rate of 25.0% from 2025 to 2030.
How does Asia Pacific's growth compare to the global market?
Asia Pacific's 25.0% CAGR outpaces the global CAGR of 22.7%, making it the fastest-growing region for AI-based image analysis solutions.
What industries in Asia Pacific are driving AI-based image analysis adoption?
Key industries include semiconductor manufacturing, electronics production, healthcare diagnostics, retail analytics, and autonomous vehicle development across Asia Pacific.
What factors are accelerating AI-based image analysis growth in Asia Pacific?
Growth drivers include manufacturing automation needs, government AI initiatives, digital transformation investments, and the region's concentration of electronics manufacturers.
RESEARCH METHODOLOGY
The study involved major activities in estimating the current size of the AI-based image analysis market. Exhaustive secondary research was done to collect information on the AI-based image analysis market. The next step was to validate these findings, assumptions, and sizing with industry experts across the value chain using primary research. Different approaches, such as top-down and bottom-up, were employed to estimate the total market size. After that, the market breakup and data triangulation procedures were used to estimate the market size of the segments and subsegments of the AI-based image analysis market.
Secondary Research
In the secondary research process, various secondary sources were referred to identify and collect information relevant to this study. Secondary sources included annual reports, press releases, and investor presentations of companies; white papers, certified publications, and articles from recognized authors; directories; and databases. Secondary research was mainly carried out to obtain critical information about the industry's supply chain, value chain, the total pool of key players, and market classification and segmentation according to industry trends, geographic markets, and key developments from both market- and technology-oriented perspectives. Secondary data has been gathered and analyzed to determine the overall market size, which has also been validated through primary research.
Primary Research
Extensive primary research was conducted after understanding and analyzing the current scenario of the AI-based image analysis market through secondary research. Several primary interviews were held with key opinion leaders from the demand and supply sides in four key regions: North America, Europe, Asia Pacific, and the rest of the world. Nearly 25% of the primary interviews were held with the demand side and 75% with the supply side. The primary data was gathered primarily through telephonic interviews, which were 80% of the total primary interviews. Surveys and e-mails were also utilized to gather data.
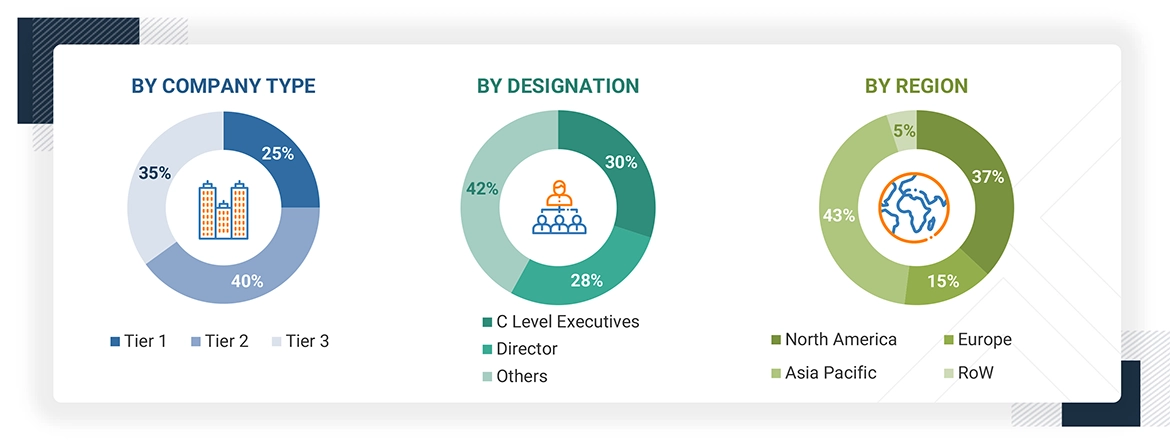
Note: The three tiers of companies are defined based on their total revenue as of 2024; tier 1: revenue more than or equal to USD 500 million, tier 2: revenue between USD 100 million and USD 500 million, and tier 3: revenue less than or equal to USD 100 million. Other designations include sales and marketing executives and researchers, as well as members of various AI-based image analysis organizations.
To know about the assumptions considered for the study, download the pdf brochure
Market Size Estimation
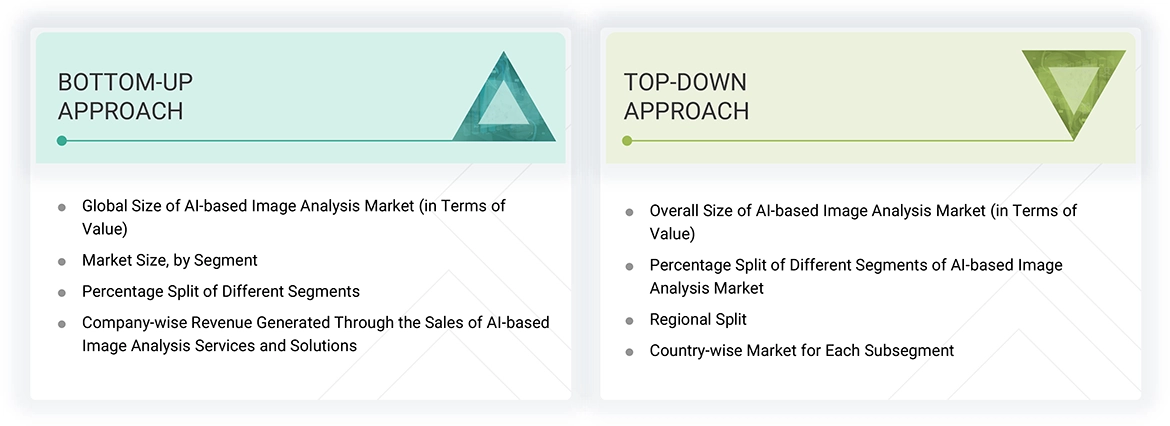
This report implemented both the top-down and bottom-up approaches to estimate and validate the size of the AI-based image analysis market and various other dependent submarkets. Secondary research identified key players in this market, and their market shares in the respective regions were determined through primary and secondary research.
This entire research methodology included the study of annual and financial reports of top companies, as well as interviews with experts (such as CEOs, VPs, directors, and marketing executives) for key insights (both quantitative and qualitative). All percentage shares, splits, and breakdowns were determined using secondary sources and verified through primary sources. All the possible parameters that affect the market covered in this research study were accounted for, viewed in detail, verified through primary research, and analyzed to obtain the final quantitative and qualitative data. This data was consolidated and supplemented with detailed inputs and analysis from MarketsandMarkets and presented in this report. The figures given below show the overall market size estimation process employed for this study.
Bottom-Up Approach
- The first step involved identifying companies that offer AI-based image analysis services and solutions, followed by mapping their products according to various parameters, such as technology, deployment mode, end-use industry, and region.
- The size of the AI-based image analysis market has been calculated based on the demand from various end-use industries and the revenue generated by companies within the AI-based image analysis ecosystem.
- To confirm the global market size, primary interviews have been conducted with a few major players in the AI-based image analysis market.
- The market size has also been cross-checked using secondary sources, which included the Institute of Electrical and Electronics Engineers (IEEE), Edge AI and Vision Alliance, International Society of Automation (ISA), Microsoft, General Data Protection Regulation (GDPR), and Partnership on AI. Other secondary sources comprised company websites, press releases, and research journals.
- To determine the compound annual growth rate (CAGR) of the AI vision market, both historical and projected market trends have been analyzed by examining the industry's penetration rate, as well as the supply and demand from various verticals.
- All estimates at each stage have been confirmed through discussions with key opinion leaders, including corporate executives (CXOs), directors, and sales heads, as well as industry experts from MarketsandMarkets.
- Several paid and unpaid information sources, such as annual reports, press releases, white papers, and databases, have also been reviewed during the research process.
Top-Down Approach
- To estimate the global size of the AI-based image analysis market, revenue information from leading manufacturers and providers of AI-based image analysis systems and solutions has been gathered and analyzed.
- The AI-based image analysis market is projected to exhibit a steady growth trend during the forecast period, reflecting its maturity and the presence of numerous well-established players across various sectors.
- The revenues, geographic footprint, key market sectors, and product offerings of all identified players in the AI-based image analysis market have been studied to estimate the percentage distribution of different market segments.
- Major players in each category in the AI-based image analysis market have been identified through secondary research, and information has been confirmed through brief discussions with industry experts.
- Several discussions with key opinion leaders from leading companies involved in developing AI-based image analysis systems have been conducted to validate the market segmentation based on technologies, deployment mode, end-use industry, and region.
- Geographic splits have been estimated using secondary sources, considering various factors, such as the number of companies offering AI-based image analysis solutions in a specific country or region and the types of AI-based image analysis services provided by these players.
AI-based Image Analysis Market : Top-Down and Bottom-Up Approach
Data Triangulation
After arriving at the overall size of the AI-based image analysis market from the estimation process explained above, the market was split into several segments and subsegments. The data triangulation and market breakdown procedures were employed (wherever applicable) to complete the overall market engineering process and arrive at the exact statistics for all segments and subsegments. The data was triangulated by studying various factors and trends from both the demand and supply sides. The size of the AI-based image analysis market was validated using both top-down and bottom-up approaches.
Market Definition
The AI-based image analysis refers to the use of machine learning (ML) and deep learning (DL), which automatically process and interpret data from visuals. It involves extracting information automatically to identify objects, recognize patterns, and make decisions based on visual data. It has a wide range of applications, including medical diagnosis, facial identification, and quality inspection, in the healthcare, manufacturing, automotive, retail, and agriculture sectors. This technique enables machines to recognize patterns, classify items, detect discrepancies, and make data-driven decisions based on visual input.
The AI-based Image Analysis Market is segmented based on sensor technology, implementation type, detection range, process stage, application, and region. The market comprises electrochemical, catalytic, metal-oxide-semiconductor (MOS), thermal conductivity, and micro-electromechanical systems (MEMS) by sensor technology. Each sensor type offers unique advantages, such as fast response time, high sensitivity, and cost-efficiency, making them suitable for various industrial requirements. In terms of implementation type, hydrogen detectors are available as fixed and portable systems, with fixed systems deployed in industrial plants and portable units used for field inspections or emergency response. The market is also categorized by detection range, including 0–1,000 ppm, 0–5,000 ppm, 0–20,000 ppm, and beyond 20,000 ppm, based on the safety threshold and detection needs of different environments. The hydrogen lifecycle is addressed across four process stages: generation, storage, transportation, and usage, each requiring real-time leak monitoring and safety assurance. Key application areas include oil & gas, automotive & transportation, chemicals, metals & mining, power & energy, and other sectors such as semiconductors, food & beverage, and medical industries. Each segment demands tailored detection technologies to meet compliance, safety, and operational efficiency standards.
Key Stakeholders
- Government and financial institutions and investment communities
- Raw data providers
- Cloud storage service providers
- AI-based image analysis system providers
- AI-based image analysis software providers
- Integrators and solution providers
- Professional service/solution providers
- Research institutions and organizations
Report Objectives
- To define, describe, segment, and forecast the AI-based image analysis market size, by technology, deployment mode, and end-use Industry, in terms of value
- To forecast the market size of four key regions, namely, North America, Europe, Asia Pacific, and the RoW, in terms of value
- To present detailed information regarding the major factors influencing the growth of the market (drivers, restraints, opportunities, and challenges)
- To provide an ecosystem analysis, investment and funding analysis, case study analysis, patent analysis, technology analysis, key conferences and events, ASP analysis, Porter's Five Forces analysis, key stakeholders and buying criteria, and regulations pertaining to the market
- To offer a comprehensive overview of the value chain of the AI-based image analysis market ecosystem
- To critically analyze micromarkets1 with respect to individual growth trends, prospects, and contributions to the total market
- To strategically profile the key players and comprehensively analyze their market shares and core competencies
- To assess the opportunities in the market for stakeholders and describe the competitive landscape of the market
- To analyze competitive developments in the market, such as collaborations, partnerships, product developments, and research and development (R&D)
Available customizations:
With the market data given, MarketsandMarkets offers customizations according to the company's specific needs. The following customization options are available for the report:
Company Information
- Detailed analysis and profiling of additional market players (up to 7)
Get the Full AI-based Image Analysis Market Report
Full forecast, segment splits, and company analysis for all AI-based Image Analysis Market.
- Rest Of GCC Al-based Image Analysis Market
- UAE Al-based Image Analysis Market
- Canada Al-based Image Analysis Market
- Mexico Al-based Image Analysis Market
- US Al-based Image Analysis Market
- Germany Al-based Image Analysis Market
- UK Al-based Image Analysis Market
- France Al-based Image Analysis Market
- Italy Al-based Image Analysis Market
- Spain Al-based Image Analysis Market
- Belgium Al-based Image Analysis Market
- Netherlands Al-based Image Analysis Market
- China Al-based Image Analysis Market
- Japan Al-based Image Analysis Market
- South Korea Al-based Image Analysis Market
- India Al-based Image Analysis Market
- Taiwan Al-based Image Analysis Market
- Australia Al-based Image Analysis Market
- Indonesia Al-based Image Analysis Market
- Rest Of Europe Al-based Image Analysis Market
- Rest Of Asia Pacific Al-based Image Analysis Market
- GCC Countries Al-based Image Analysis Market
- Rest Of Middle East Al-based Image Analysis Market
Need a Tailored Report?
Customize this report to your needs
Get 10% FREE Customization
Customize This Report
