
Brazil AI Inspection Market (2025-2030)

The Brazil AI Inspection Market was valued at $811 Million in 2025 and projected to reach to $2921 Million by 2030, representing a compound annual growth rate of 20.1%. Brazil's AI Inspection Market is poised for exceptional growth through 2030, driven by the country's commitment to modernizing its semiconductor and electronics manufacturing base.


| Market Size in | USD 26.32 MN |
| Market Forecast in | |
| CAGR | |
| Forecast Period | |
| Units Considered | Value (USD MN) |
Brazil AI Inspection Market Trends and Insights
- This 20.1% compound annual growth rate significantly outpaces global trends, reflecting Brazil's increasing adoption of automated quality control and defect detection technologies across manufacturing operations.
- Brazil's market expansion is driven by rising demand for precision inspection in electronics production and semiconductor fabrication, where AI-powered solutions enhance efficiency and reduce production costs. The Brazilian market benefits from growing investments in industrial automation and digital transformation initiatives across the country's manufacturing base.
- By 2030, Brazil is expected to capture substantial market share as local manufacturers integrate AI inspection systems to meet international quality standards and compete globally.
- Brazil's strategic position in Latin America, combined with supportive government policies toward technology adoption, positions the nation as a key growth hub for AI inspection solutions in the region..
Key Market Statistics
- CAGR (2025-2030) 20.1% CAGR
- Market Size, 2025 ~USD 811 Million
- Forecast, 2030 ~USD 2921 Million
- Country Brazil
Brazil AI Inspection Market Overview
Outpacing Global Growth :
Brazil's AI Inspection Market grows at 20.1% CAGR, significantly exceeding the global rate of 17.5%, driven by accelerating digital transformation in local semiconductor and electronics manufacturing.
Substantial Market Expansion :
Market valuation is projected to grow from $811 million in 2025 to $2,921 million by 2030, representing a 260% increase over five years as automation adoption intensifies across production facilities.
Quality Control Modernization :
Brazilian manufacturers are rapidly deploying AI-powered defect detection and automated quality control systems to enhance product reliability, reduce waste, and meet international export standards.
Manufacturing Sector Momentum :
The semiconductor and electronics sector in Brazil is experiencing increased investment in Industry 4.0 technologies, positioning AI inspection as a critical competitive advantage for local producers.
Brazil AI Inspection Market Dynamics
- Local manufacturers are increasingly recognizing the ROI potential of AI-powered quality control systems, which reduce production costs, minimize defects, and enhance competitiveness in global markets.
- Government initiatives supporting industrial digitalization and foreign investment in Brazilian tech hubs are accelerating technology adoption. The market's 20.1% CAGR reflects strong demand from both established manufacturers and emerging electronics producers seeking to upgrade legacy inspection processes.
- As supply chain resilience becomes critical, Brazil's strategic position in the Americas is attracting multinational semiconductor companies to establish or expand operations, further driving AI inspection technology deployment and creating sustained market opportunities through 2030..
Market Ecosystem
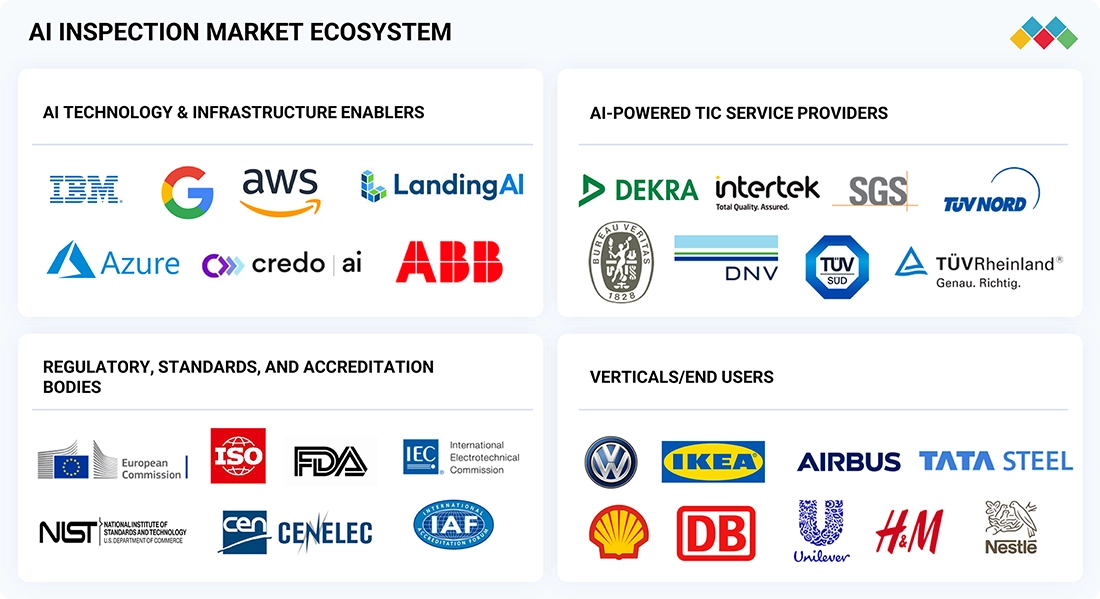
AI INSPECTION MARKET: COMMERCIAL USE CASES ACROSS INDUSTRIES
| COMPANY | USE CASE DESCRIPTION | BENEFITS |
|---|---|---|
 |
Utilizes autonomous drone-based remote inspection and AI analytics to monitor upstream and midstream facilities, capture high-frequency visual evidence, and flag anomalies across critical assets without continuous on-site presence. | Improves inspection frequency and coverage, reduces field travel and safety exposure, and accelerates identification of maintenance priorities across dispersed assets. |
 |
Engages AI-powered inspection services using drones and centralized visual data management to standardize inspection evidence, streamline reporting, and enable consistent inspection execution across multiple sites and projects. | Improves inspection consistency at scale, reduces manual documentation effort, strengthens traceability of findings, and supports faster maintenance and project decisions. |
 |
Leverages AI-assisted remote survey and inspection methods to capture 3D asset condition data, automate anomaly detection and corrosion mapping, and improve planning for targeted inspection and repair activities. | Reduces high-risk manual access, improves accuracy of condition assessment, optimizes maintenance planning, and lowers inspection-related downtime and cost. |
 |
Adopts third-party AI management system certification to verify governance controls for AI development and deployment, including lifecycle risk management, accountability, and continuous monitoring processes. | Improves enterprise and client trust, supports audit and procurement requirements, reduces regulatory and reputational risk, and standardizes AI governance across teams. |
 |
Uses AI-enabled autonomous inspection routines during plant operations and maintenance windows to collect structured visual evidence, track asset condition changes, and enable remote expert review workflows. | Reduces inspection turnaround time, improves safety by limiting manual access, increases consistency of findings, and supports better maintenance planning and uptime. |
Logos and trademarks shown above are the property of their respective owners. Their use here is for informational and illustrative purposes only.
Related Ecosystem
Testing Inspection And Certification
- Eddy Current Testing (ECT)
- Safety Testing
- Signal Generators
- Acoustic Emission Testing (AET)
- Automated Test Equipment
- Sgs s.a.
- Intertek Group plc
- TUV RHEINLAND AG
- Bureau veritas s.a.
- EUROFINS SCIENTIFIC SE
Key Takeaways
- Brazil's AI Inspection Market is valued at $811.0 million in 2025 and will reach $2,921.0 million by 2030, representing a 20.1% CAGR.
- Brazil's growth rate outpaces the global average of 17.5%, indicating accelerating adoption of AI-powered quality control in semiconductor and electronics manufacturing.
- Brazil's market expansion is fueled by industrial automation investments and the need to meet international quality standards in electronics production.
- By 2030, Brazil will emerge as a critical growth hub for AI inspection solutions within Latin America's semiconductor and electronics ecosystem.
AI Inspection Market Report Scope
| Report Metric | Details |
|---|---|
| Base Year | 2025 |
| Fastest Growing Segment | REMOTE (Service Delivery Mode) |
| Forecast Period | 2025–2030 |
| Growth Rate | CAGR of 17.5% from 2025 to 2030 |
| Largest Segment | ON-SITE (Service Delivery Mode) |
| Market Size Base Year (Billions) | ~USD 33.12 (2025) |
| Revenue Forecast (Billions) | ~USD 74.18 (2030) |
| Segments Covered | Service Type, Technology, Type, Application, Service Delivery Mode |
Brazil AI Inspection Market Report Segmentation
5 segment dimensions are covered across the global market.
By Service Type
- AI-Powered Certification Services
- AI-Powered Inspection Services
- AI-Powered Testing Services
- Other Service Types
By Technology
- Computer Vision
- Computer Vision-Based Services
- Machine Learning (ML) & Analytics
- Machine Learning (ML) & Analytics-Based Services
- Natural Language Processing (Nlp)
- Natural Language Processing (Nlp)-Based Services
- Other Technologies
By Type
- Predictive & Prescriptive Analytics
- Supervised Learning-Based Classification
- Unsupervised Learning (Anomaly Detection)
By Application
- Asset Integrity Management
- Cybersecurity & Data Assurance
- Other Applications
- Quality & Process Assurance
- Regulatory & Compliance Management
- Sustainability & Environmental, Social, And Governance (Esg) Auditing
By Service Delivery Mode
- Hybrid
- On-Site
- Remote
BRAZIL: AI INSPECTION MARKET, BY END-USE INDUSTRY, 2025–2032
| Segment | 2025 | 2026 | 2027 | 2028 | 2029 | 2030 | 2032 | CAGR (%) |
|---|---|---|---|---|---|---|---|---|
| AGRICULTURE & FOOD | 112.7 | 154.6 | 197.1 | 236.5 | 276.8 | 311.8 | 359.3 | 18 |
| CONSTRUCTION & INFRASTRUCTURE | 72.3 | 101.9 | 133.3 | 164.3 | 197.5 | 228.4 | 277.5 | 21.2 |
| CONSUMER GOODS & RETAIL | 89.6 | 125.8 | 164.1 | 201.5 | 241.5 | 278.4 | 335.9 | 20.8 |
| ENERGY & UTILITIES | 98.6 | 133.9 | 168.9 | 200.5 | 232.3 | 258.9 | 292.1 | 16.8 |
| HEALTHCARE & LIFE SCIENCES | 78.5 | 111.9 | 148.1 | 184.7 | 224.7 | 263 | 327.2 | 22.6 |
| IT & TELECOMMUNICATIONS | 90.6 | 132 | 178.8 | 227.9 | 283.4 | 339.2 | 441.1 | 25.4 |
| MANUFACTURING | 148.1 | 202.9 | 258.2 | 309.4 | 361.7 | 406.8 | 467.4 | 17.8 |
| OTHER VERTICALS | 49.6 | 68.5 | 87.2 | 103.5 | 118.7 | 129.5 | 134.4 | 15.3 |
| TRANSPORTATION & LOGISTICS | 71 | 100.7 | 132.7 | 164.7 | 199.4 | 232.3 | 286.3 | 22.1 |
| TOTAL | 811 | 1132.2 | 1468.4 | 1793.1 | 2136 | 2448.3 | 2921 | 20.1 |
Target Audience
- Semiconductor Manufacturers : Brazilian and multinational semiconductor producers need market intelligence to justify AI inspection investments, benchmark against competitors, and optimize production quality in a rapidly evolving sector.
- Electronics OEMs & Suppliers : Electronics manufacturers operating in Brazil require insights into automation trends and technology adoption to maintain competitiveness and meet international quality standards.
- Technology Solution Providers : AI inspection software and hardware vendors need Brazil-specific market data to identify customer segments, forecast demand, and develop localized solutions for the region.
- Private Equity & Investors : Investment firms evaluating opportunities in Brazilian manufacturing technology need detailed market forecasts and growth drivers to assess portfolio companies and identify acquisition targets.
- Government & Policy Makers : Brazilian industrial development agencies and policymakers require market insights to guide digitalization initiatives, incentive programs, and strategic manufacturing sector development.
Reasons to Buy this Report
- Market-Specific Growth Intelligence : Gain detailed insights into Brazil's 20.1% CAGR trajectory, understanding local drivers and competitive dynamics that differ significantly from global market trends.
- Investment Decision Support : Access comprehensive forecasts and market sizing data to evaluate expansion opportunities, partnerships, or acquisitions within Brazil's rapidly growing AI inspection sector.
- Competitive Landscape Analysis : Understand Brazil-specific vendor positioning, technology adoption rates, and customer preferences to develop targeted go-to-market strategies for the region.
- Sector-Specific Opportunity Mapping : Identify high-potential subsegments within semiconductor and electronics manufacturing where AI inspection adoption is accelerating and ROI potential is highest.
- Strategic Planning & Forecasting : Leverage five-year projections and market dynamics to inform long-term business strategy, resource allocation, and product development roadmaps for the Brazilian market.
Frequently asked questions
What is the current size of Brazil's AI Inspection Market?
Brazil's AI Inspection Market is valued at $811.0 million in 2025, with verified data from KS table sources.
What is Brazil's projected market size by 2030?
Brazil's AI Inspection Market is forecast to reach $2,921.0 million by 2030, representing significant expansion over the five-year period.
How does Brazil's growth rate compare to global trends?
Brazil's 20.1% CAGR exceeds the global average of 17.5%, demonstrating faster adoption of AI inspection technologies in the country's semiconductor and electronics sector.
What industries drive AI Inspection demand in Brazil?
Brazil's semiconductor and electronics manufacturing sectors are the primary drivers, where AI inspection systems improve quality control and reduce production defects.
Why is Brazil's market growing faster than the global average?
Brazil's accelerated growth is driven by industrial automation investments, digital transformation initiatives, and the need to meet international quality standards in manufacturing.
RESEARCH METHODOLOGY
The study involved major activities in estimating the current market size for the AI inspection market. Extensive secondary research was conducted to collect information on AI-enabled testing, inspection, and certification services, including technology adoption trends, end-use demand patterns, regulatory and accreditation frameworks, and competitive developments across key regions. The next step was to validate findings, assumptions, and market sizing through primary research with stakeholders across the value chain, including TIC service providers, technology enablers, and end users. Both top-down and bottom-up approaches were used to estimate the overall market size, supported by multiple cross-checks across segmentation views such as service type, technology, delivery mode, application, sourcing type, end-use industry, and region. After this, market breakup and data triangulation procedures were applied to derive segment and subsegment estimates and ensure consistency of totals across all cuts.
Secondary Research
Secondary research for this study involved gathering information from credible sources such as company annual reports and investor presentations, official company websites, press releases, regulatory and accreditation bodies, standards organizations, industry journals, and relevant conference and association publications. This process helped map the AI inspection value chain, identify key service providers and technology enablers, assess market segmentation and regional trends, and track major service, technology, and partnership developments. The insights and datasets compiled through secondary research were used to build the initial market size estimates and segment allocations, which were subsequently validated through primary research.
Primary Research
Extensive primary research was conducted after establishing the market context through secondary findings for the AI inspection market. Multiple interviews were carried out with stakeholders across both the supply and demand sides, including global and regional TIC service providers, AI and digital platform enablers, and end users across priority industries. Primary inputs were collected across major regions, including North America, Europe, Asia Pacific, Latin America, and the Middle East and Africa, using structured questionnaires, email interactions, and telephonic interviews. These discussions were used to validate assumptions on adoption drivers, delivery models, sourcing preferences, and growth hotspots, and to refine market sizing and segmentation outputs.
Breakdown of Primary Interviews
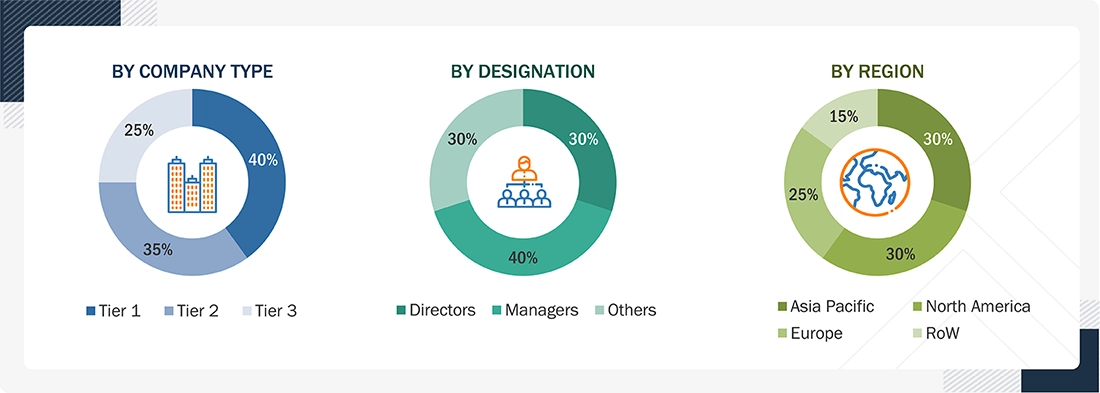
Notes: Other designations include product managers, sales managers, and marketing managers.
Tier 1 companies include market players with revenues above USD 500 million; tier 2 companies earn revenues between USD 100 million and USD 500 million; and tier 3 companies earn up to USD 100 million.
To know about the assumptions considered for the study, download the pdf brochure
Market Size Estimation
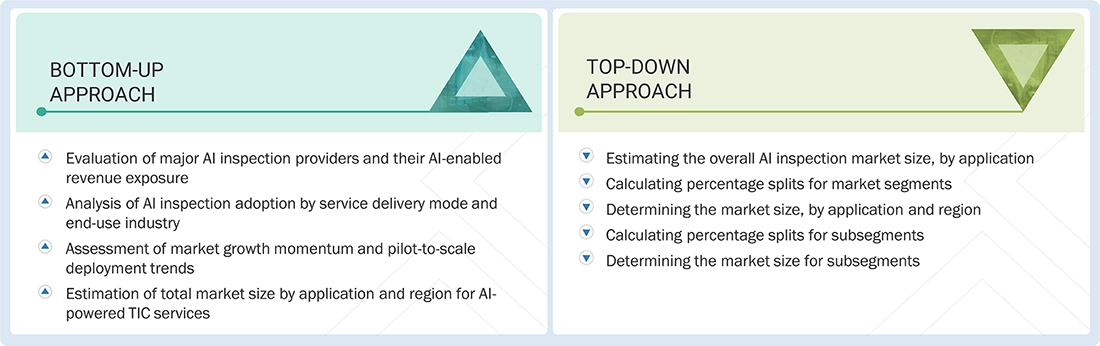
Both top-down and bottom-up approaches were used to estimate and validate the total size of the AI inspection market. These methods were also used extensively to estimate the size of various subsegments in the market. The research methodology used to estimate the market size includes the following:
The bottom-up procedure has been employed to arrive at the overall size of the AI inspection market.
- Identifying stakeholders in the AI inspection market that influences the entire market, along with participants across the value chain
- Analyzing major AI-powered TIC service providers in the ecosystem
- Analyzing trends related to the adoption of AI-powered TIC services
- Tracking the recent developments in the market that include investments, R&D activities, AI-powered solutions/services launches, collaborations, acquisitions, expansions, and partnerships, as well as forecasting the market size based on these developments and other critical parameters
- Carrying out multiple discussions with key opinion leaders to identify the adoption trends of AI-powered TIC services
- Segmenting the overall market into various other market subsegments
- Validating the estimates at every level through discussions with key opinion leaders, such as chief executives (CXOs), directors, and operations managers, and finally with the domain experts at MarketsandMarkets
The top-down approach has been used to estimate and validate the total size of the AI inspection market.
- Start with the Global AI Inspection Market total for each year as the single control number.
- Split the global total into top-level cuts by service delivery mode, organization type, and application.
- Allocate the global total by country, then roll up countries to regions, and reconcile back to the global total.
- Within each country, split further by end-use industry and sourcing type, ensuring country totals remain consistent.
- In parallel, derive the global cut by service type, then segment each service type by technology.
- Transpose the service type × technology view to obtain the technology market totals and validate all cuts through triangulation to match the global total.
AI Inspection Market : Top-Down and Bottom-Up Approach
Data Triangulation
After arriving at the overall market size for the AI inspection market using the estimation approaches described above, the market was split into key segments and subsegments. Data triangulation and market breakdown procedures were then applied to complete the market engineering process and derive consistent estimates for each segment and subsegment. The data was triangulated by comparing insights from both the demand and supply sides, including adoption patterns by end-use industries, technology penetration trends, service delivery preferences, sourcing behavior, and competitive developments across regions. This triangulation ensured that all segment totals reconcile with the overall market size and that assumptions remain consistent across multiple market views.
Market Definition
The AI inspection market, as defined in this study, refers exclusively to AI-powered testing, inspection, and certification (TIC) services, encompassing both in-house (captive) and outsourced TIC activities. It covers inspection, testing, audit, and certification services where artificial intelligence is embedded into service workflows to improve defect detection, data interpretation, inspection prioritization, and compliance accuracy. The scope encompasses AI-enabled visual, remote, and automated inspections, intelligent analysis of test and sensor data, predictive and condition-based inspection models, as well as AI-assisted audit and certification processes across regulated and industrial environments. The market excludes standalone AI software, inspection hardware sold without service delivery, factory automation systems, internal quality control activities outside TIC functions, and traditional TIC services where AI does not materially influence service outcomes.
Key Stakeholders
- Government Bodies, Venture Capitalists, and Private Equity Firms
- AI-enabled TIC Service Providers
- In-house (Captive) TIC Units
- TIC Industry Associations
- Professional Service & Solution Providers
- Research Institutions & Organizations
- Standards Organizations & Regulatory Authorities Related to the AI Inspection Market
- System Integrators
- Technology Consultants
Report Objectives
- To define, describe, and forecast the AI inspection market based on service type, technology, service delivery mode, application, sourcing type, and end-use industry in terms of value
- To forecast the market size for five main regions—Asia Pacific, North America, Europe, Latin America, and the Middle East & Africa, along with respective countries, in terms of value
- To provide detailed information regarding drivers, restraints, opportunities, and challenges influencing the market growth
- To provide a detailed overview of the AI inspection supply chain
- To strategically analyze micromarkets1 with regard to individual market trends, growth trends, prospects, and contributions to the total market
- To analyze the opportunities in the market for stakeholders
- To strategically profile key players and comprehensively analyze their market position in terms of ranking and core competencies2, along with a detailed competitive landscape for the market leaders
- To analyze competitive developments and major growth strategies, such as service launches, acquisitions, collaborations, expansions, and partnerships, in the AI inspection market
- To describe macroeconomic factors impacting market growth in each region
- To provide ecosystem analysis, case study analysis, patent analysis, technology analysis, and US tariff impact, key conferences & events, Porter’s Five Forces analysis, and regulations pertaining to the market under study
Available customizations:
Along with the market data, MarketsandMarkets offers customizations as per the specific needs of companies. The following customization options are available for the report:
Product Analysis
- Product matrix, which gives a detailed comparison of the product portfolio of each company
Regional Analysis
- Further breakdown of the market segments at the country level
Company Information
- Detailed analysis and profiling of additional market players (up to five)
Get the Full AI Inspection Market Report
Full forecast, segment splits, and company analysis for all AI Inspection Market.
- China AI Inspection Market
- Japan AI Inspection Market
- India AI Inspection Market
- South Korea AI Inspection Market
- Australia AI Inspection Market
- Thailand AI Inspection Market
- Vietnam AI Inspection Market
- Malaysia AI Inspection Market
- Indonesia AI Inspection Market
- Singapore AI Inspection Market
- US AI Inspection Market
- Canada AI Inspection Market
- Germany AI Inspection Market
- France AI Inspection Market
- UK AI Inspection Market
- Italy AI Inspection Market
- Spain AI Inspection Market
- Netherlands AI Inspection Market
- Argentina AI Inspection Market
- Mexico AI Inspection Market
- South Africa AI Inspection Market
Need a Tailored Report?
Customize this report to your needs
Get 10% FREE Customization
Customize This Report
