
Asia Pacific Artificial Intelligence(AI) Vision Market (2024-2029)

The Asia Pacific Artificial Intelligence(AI) Vision Market was valued at $4761.2 Million in 2024 and projected to reach to $16428.3 Million by 2029, representing a compound annual growth rate of 28.1%. Asia Pacific's AI Vision market is poised for transformative growth, expanding from $4,761.2 million in 2024 to $16,428.3 million by 2029.


| Market Size in | USD 26.32 MN |
| Market Forecast in | |
| CAGR | |
| Forecast Period | |
| Units Considered | Value (USD MN) |
Asia Pacific Artificial Intelligence(AI) Vision Market Trends and Insights
- This exceptional growth trajectory, driven by a 28.1% compound annual growth rate, reflects Asia Pacific's leadership in semiconductor manufacturing, robotics adoption, and smart surveillance infrastructure.
- Asia Pacific's dominance is fueled by rapid industrialization across China, Japan, South Korea, and India, where AI vision applications are revolutionizing manufacturing quality control, autonomous vehicles, and retail analytics. The Asia Pacific region benefits from substantial investments in AI infrastructure and a concentration of electronics manufacturing hubs that accelerate AI vision technology deployment.
- Asia Pacific's competitive advantage stems from lower implementation costs, abundant technical talent, and government initiatives promoting digital transformation.
- By 2029, Asia Pacific is positioned to capture a disproportionate share of global AI vision adoption, driven by increasing demand for intelligent automation in factories, smart cities, and consumer electronics..
Key Market Statistics
- CAGR (2024-2029) 28.1% CAGR
- Market Size, 2024 ~USD 4761.2 Million
- Forecast, 2029 ~USD 16428.3 Million
- Geography Asia Pacific
Asia Pacific Artificial Intelligence(AI) Vision Market Overview
Dominant Market Leadership :
Asia Pacific commands the AI Vision market with $4,761.2 million in 2024, driven by China's $6,202.9 million and Japan's $4,349.5 million contributions, establishing the region as the global epicenter for AI vision technology adoption.
Exceptional Growth Trajectory :
With a 28.1% CAGR through 2029, Asia Pacific significantly outpaces the global growth rate of 23.7%, reflecting accelerated semiconductor manufacturing, robotics integration, and smart surveillance infrastructure investments across the region.
Manufacturing & Robotics Hub :
Asia Pacific's leadership in semiconductor production and advanced robotics deployment creates unparalleled demand for AI vision solutions in manufacturing automation, quality control, and industrial inspection applications.
Smart Surveillance Expansion :
Rapid urbanization and government initiatives across Asia Pacific are driving massive adoption of AI-powered surveillance systems, creating substantial growth opportunities for vision-based security and monitoring solutions.
Asia Pacific Artificial Intelligence(AI) Vision Market Dynamics
- This remarkable 28.1% CAGR reflects the region's strategic positioning as a global manufacturing powerhouse, where semiconductor production, robotics adoption, and smart city initiatives converge to create unprecedented demand for advanced vision technologies. Key growth drivers include China and Japan's technological leadership, South Korea's semiconductor expertise, and emerging opportunities across Southeast Asia.
- Investment in autonomous systems, industrial automation, and intelligent surveillance infrastructure will continue accelerating market expansion.
- Companies targeting Asia Pacific can capitalize on early-mover advantages in this high-growth region, where digital transformation initiatives and government support create favorable conditions for AI vision solution deployment..
Market Ecosystem
Related Ecosystem
Augmented Virtual Reality
- Sensors
- Virtual Reality Devices
- Augmented Reality
- Virtual Reality
- Augmented Reality Devices
- MICROSOFT CORPORATION
- Lenovo
- VIVITEK CORPORATION
- Apple Inc.
Analytics
- Natural Language Processing (NLP)
- Machine Learning
- Supply Chain Management
- Predictive Analytics
- Image Sensors
- International Business Machines Corporation
- MICROSOFT CORPORATION
- Oracle Corporation
- SAP SE
Cloud Computing
- Software as A Service (SaaS)
- Natural Language Processing (NLP)
- Platform as A Service (PaaS)
- Machine Learning
- Supply Chain Management
- International Business Machines Corporation
- MICROSOFT CORPORATION
- Oracle Corporation
- Amazon.com, Inc.
Key Takeaways
- Asia Pacific's AI Vision Market will grow from $4,761.2M (2024) to $16,428.3M (2029), representing a 28.1% CAGR that outpaces global growth.
- Asia Pacific leads in manufacturing automation and surveillance applications, with China, Japan, and South Korea driving regional adoption.
- Lower implementation costs and abundant technical talent position Asia Pacific as the preferred hub for AI vision deployment and innovation.
- Government digital transformation initiatives across Asia Pacific are accelerating enterprise adoption of AI vision technologies through 2029.
Artificial Intelligence(AI) Vision Market Report Scope
| Report Metric | Details |
|---|---|
| Base Year | 2024 |
| Fastest Growing Segment | EDGE INFERENCING (Mode Of Operation) |
| Forecast Period | 2024-2029 |
| Growth Rate | CAGR of 23.7% from 2024 to 2029 |
| Largest Segment | CLOUD-BASED LEARNING (Mode Of Operation) |
| Market Size Base Year (Billions) | ~USD 14.85 (2024) |
| Revenue Forecast (Billions) | ~USD 43.02 (2029) |
| Segments Covered | Offering, Type, Service Type, Technology, Technology Type, Mode Of Operation, Vertical |
Asia Pacific Artificial Intelligence(AI) Vision Market Report Segmentation
7 segment dimensions are covered across the global market.
By Offering
- Custom Solutions
- Vision Platforms
- Vision Software
By Type
- Application Programming Interfaces
- Intrusion Detection
- Monitoring Surroundings
- Motion Detection
- Software Development Kits
By Service Type
- Behavioral Analysis
- Heatmap Analysis
- Image Recognition
- Optical Character Recognition
- Spatial Analysis
By Technology
- Generative AI
- Machine Learning
By Technology Type
- Convolutional Neural Networks
- Deep Learning
By Mode Of Operation
- Cloud-Based Learning
- Edge Inferencing
By Vertical
- Agriculture
- Construction
- Healthcare
- Manufacturing
- Oil & Gas
- Other Verticals
- Retail
- Transportation & Logistics
Target Audience
- Technology Manufacturers : AI vision hardware and software developers need Asia Pacific market data to understand regional demand patterns, customize solutions for local manufacturing and robotics sectors, and plan production capacity expansion.
- Semiconductor Companies : Chip designers and manufacturers require insights into Asia Pacific's vision processor demand, driven by robotics and surveillance applications, to guide R&D investments and market development strategies.
- System Integrators & Solution Providers : Integration firms targeting industrial automation and smart city projects need detailed Asia Pacific market intelligence to identify high-potential verticals, estimate project pipelines, and develop localized service offerings.
- Investment & Private Equity Firms : Investors evaluating AI vision companies require Asia Pacific market forecasts and growth metrics to assess portfolio company expansion potential, identify acquisition targets, and evaluate regional fund opportunities.
- Government & Policy Makers : Regional authorities and economic development agencies need market data to inform technology policy, infrastructure investments, and incentive programs supporting AI vision adoption in manufacturing and smart city initiatives.
Countries within Asia Pacific - compare and drill down
| Country | 2025 size (native) |
|---|---|
| China | USD 6202.9 Million |
| Japan | USD 4349.5 Million |
| South Korea | USD 3202.9 Million |
| Rest Of Asia Pacific | USD 2672.9 Million |
Country market size visualization
Reasons to Buy this Report
- Regional Market Dominance Data : Gain comprehensive insights into Asia Pacific's $4,761.2 million market with detailed breakdowns of China ($6,202.9M), Japan ($4,349.5M), and South Korea ($3,202.9M), enabling precise market positioning and competitive analysis.
- High-Growth Opportunity Identification : Leverage the 28.1% CAGR forecast through 2029 to identify emerging opportunities in manufacturing automation, robotics, and surveillance sectors where Asia Pacific leads global adoption rates.
- Strategic Investment Planning : Access country-level market sizing and growth projections to inform capital allocation decisions, partnership strategies, and market entry timelines across Asia Pacific's diverse economies.
- Competitive Intelligence : Understand regional competitive dynamics, technology adoption patterns, and market maturity levels across Asia Pacific to benchmark performance and identify differentiation opportunities.
- Demand Forecasting Accuracy : Utilize detailed 2024-2029 projections showing expansion to $16,428.3 million to optimize supply chain planning, resource allocation, and revenue forecasting for Asia Pacific operations.
Frequently asked questions
What is the projected market size of AI Vision in Asia Pacific by 2029?
Asia Pacific's AI Vision Market is projected to reach $16,428.3 million by 2029, growing from $4,761.2 million in 2024 at a 28.1% CAGR.
Which countries are driving AI Vision adoption in Asia Pacific?
China, Japan, South Korea, and India are the primary drivers of AI Vision adoption in Asia Pacific, leveraging their manufacturing capabilities and technology infrastructure.
What are the main applications of AI Vision in Asia Pacific?
Key applications in Asia Pacific include manufacturing quality control, autonomous vehicles, smart surveillance, retail analytics, and intelligent factory automation.
Why is Asia Pacific growing faster than the global average?
Asia Pacific's 28.1% CAGR exceeds the global 23.7% rate due to rapid industrialization, lower implementation costs, abundant technical talent, and government digital transformation initiatives.
What factors are supporting AI Vision market expansion in Asia Pacific?
Key factors include semiconductor manufacturing concentration, robotics adoption, smart city development, enterprise automation investments, and supportive government policies across the region.
RESEARCH METHODOLOGY
The study used four major activities to estimate the market size of the AI vision. Exhaustive secondary research was conducted to gather information on the market and its peer and parent markets. The next step was to validate these findings, assumptions, and sizing with industry experts across the value chain through primary research. Both top-down and bottom-up approaches were employed to estimate the total market size. Finally, market breakdown and data triangulation methods were utilized to estimate the market size for different segments and subsegments.
Secondary Research
The research methodology used to estimate and forecast the size of the AI vision market began with the acquisition of data related to the revenues of key vendors in the market through secondary research. Various secondary sources have been referred to in the secondary research process to identify and collect information for this study. Secondary sources include annual reports, press releases, and investor presentations of companies; white papers, journals, certified publications, and articles by recognized authors; websites; directories; and databases. Secondary research has mainly been used to obtain key information about the value chain of the AI vision market, key players, market classification, and segmentation according to the industry trends to the bottom-most level, geographic markets, and key developments from market and technology-oriented perspectives. Secondary data has been collected and analyzed to determine the overall market size, further validated through primary research. The secondary research referred to for this research study involves the Institute of Electrical and Electronics Engineers (IEEE), Edge AI and Vision Alliance, International Society of Automation (ISA), Microsoft, General Data Protection Regulation (GDPR), and Partnership on AI. Moreover, the study involved extensive secondary sources, directories, and databases, such as Hoovers, Bloomberg Businessweek, Factiva, and OneSource, to identify and collect valuable information for a technical, market-oriented, and commercial study of the AI vision market. Vendor offerings have been taken into consideration to determine market segmentation.
Primary Research
In the primary research, various stakeholders from both the supply and demand sides have been interviewed to obtain the qualitative and quantitative information relevant to this report. Primary sources from the supply side include the key industry participants, subject-matter experts (SMEs), and C-level executives and consultants from various key companies and organizations in the AI vision ecosystem. After the complete market engineering (including calculations for the market statistics, the market breakdown, the market size estimations, the market forecasting, and the data triangulation), extensive primary research has been conducted to verify and validate the critical market numbers obtained. Extensive qualitative and quantitative analyses have been performed during the market engineering process to list key information/insights throughout the report. Extensive primary research has been conducted after understanding the AI vision market scenario through secondary research. Several primary interviews have been conducted with market experts from the demand and supply-side players across key regions: North America, Europe, Asia Pacific, and the Rest of the World (Middle East, Africa, and South America). Various primary sources from the supply and demand sides of the market have been interviewed to obtain qualitative and quantitative information. Following is the breakdown of the primary respondents.
Primary data has been collected through questionnaires, emails, and telephonic interviews. In the canvassing of primaries, various departments within organizations, such as sales, operations, and administration, were covered to provide a holistic viewpoint in our report. After interacting with industry experts, brief sessions were conducted with highly experienced independent consultants to reinforce the findings from our primaries. This and the in-house subject matter experts’ opinions have led us to the findings described in the remainder of this report.
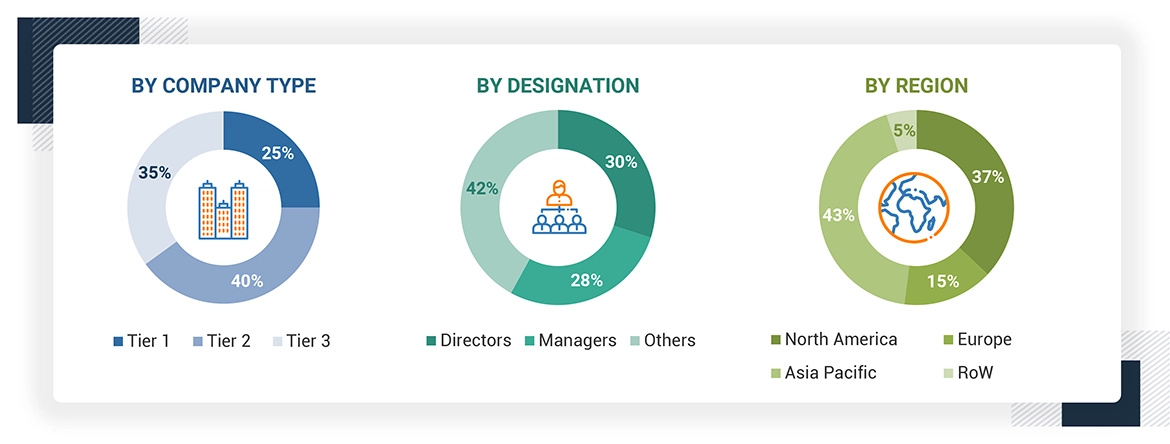
Note: The three tiers of the companies are defined based on their total revenue in 2023: Tier 1 - revenue greater than or equal to USD 1 billion; Tier 2 - revenue between USD 100 million and USD 1 billion; and Tier 3 revenue less than or equal to USD 100 million. Other designations include sales managers, marketing managers, and product managers.
About the assumptions considered for the study, To know download the pdf brochure
Market Size Estimation
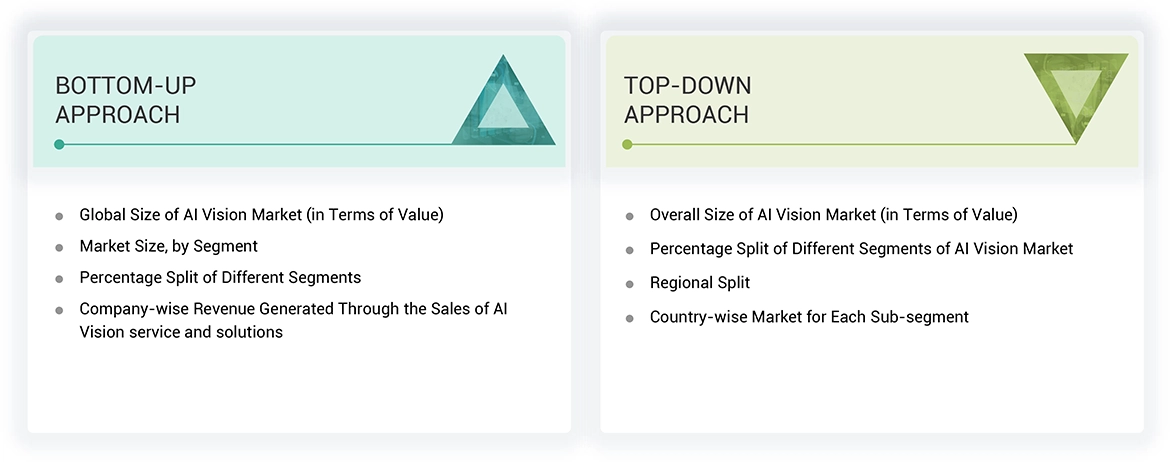
Both top-down and bottom-up approaches were utilized to estimate and validate the size of the AI vision market and its submarkets. Secondary research was conducted to identify the key players in the market, and primary and secondary research was used to determine their market share in specific regions. The entire process involved studying top players' annual and financial reports and conducting extensive interviews with industry leaders such as CEOs, VPs, directors, and marketing executives. Secondary sources were used to determine all percentage shares and breakdowns, which were verified through primary sources. All parameters that could impact the markets covered in this research study were accounted for, analyzed in detail, verified through primary research, and consolidated to obtain the final quantitative and qualitative data.
AI Vision Market Market : Top-Down and Bottom-Up Approach
Data Triangulation
Once the overall size of the AI vision market was determined using the methods described above, it was divided into multiple segments and subsegments. Market engineering was performed for each segment and subsegment using market breakdown and data triangulation methods, as applicable, to obtain accurate statistics. To triangulate the data, various factors and trends from the demand and supply sides were studied. The market was validated using both top-down and bottom-up approaches.
Market Definition
AI vision refers to integrating artificial intelligence with computer vision technologies to enable machines to interpret and analyze visual data. It is widely used across various verticals, such as healthcare, manufacturing, transport & logistics, retail, agriculture, oil & gas, construction, and other verticals. AI vision offers several advantages, such as real-time object detection, image recognition, heatmap analysis, optical character recognition, improved accuracy in visual analysis, automation of complex tasks, and enhanced decision-making processes. By leveraging machine learning and deep learning technology, AI vision systems can adapt and improve over time, providing greater efficiency and precision across these applications.
Key Stakeholders
- Raw data providers
- Cloud storage providers
- AI vision system providers
- AI vision software providers
- Integrators and solution providers
- Professional services/solution providers
- Research institutions and organizations
Report Objectives
- To estimate and forecast the size of the AI Vision Market, in terms of value, based on offering, service type, technology, mode of operation, vertical, and region
- To describe use cases of AI vision technology
- To describe and forecast the market size, in terms of value, for four major regions-North America, Europe, Asia Pacific, and Rest of the World (RoW)
- To provide detailed information regarding major factors such as drivers, restraints, opportunities, and challenges influencing the market growth
- To provide a detailed overview of the AI vision value chain
- To strategically analyze micromarkets regarding individual market trends, growth prospects, and contributions to the total market
- To strategically profile key players and comprehensively analyze their market position in terms of ranking and core competencies, along with a detailed competitive landscape for the market leaders
- To analyze major growth strategies such as product launches/developments and acquisitions adopted by the key market players to enhance their market position
- To analyze the impact of the macroeconomic factors impacting the AI vision market
Available Customizations
With the given market data, MarketsandMarkets offers customizations according to the specific requirements of companies. The following customization options are available for the report:
- Detailed analysis and profiling of additional market players (up to 5)
- Additional country-level analysis of the AI vision market
Product Analysis
- Product matrix, which provides a detailed comparison of the product portfolio of each company in the AI vision market.
Get the Full Artificial Intelligence(AI) Vision Market Report
Full forecast, segment splits, and company analysis for all Artificial Intelligence(AI) Vision Market.
- US Artificial Intelligence(AI) Vision Market
- Canada Artificial Intelligence(AI) Vision Market
- Mexico Artificial Intelligence(AI) Vision Market
- Germany Artificial Intelligence(AI) Vision Market
- UK Artificial Intelligence(AI) Vision Market
- France Artificial Intelligence(AI) Vision Market
- Italy Artificial Intelligence(AI) Vision Market
- China Artificial Intelligence(AI) Vision Market
- Japan Artificial Intelligence(AI) Vision Market
- South Korea Artificial Intelligence(AI) Vision Market
- Rest Of Europe Artificial Intelligence(AI) Vision Market
- Rest Of Asia Pacific Artificial Intelligence(AI) Vision Market
Need a Tailored Report?
Customize this report to your needs
Get 10% FREE Customization
Customize This Report
