
Japan AR Glass Market (2025-2030)

The Japan AR Glass Market was valued at $91.5 Million in 2025 and projected to reach to $1066.5 Million by 2030, representing a compound annual growth rate of CAGR 63.4%. Japan's AR glass market is positioned for transformative growth through 2030, driven by the nation's technological prowess and early adoption of immersive technologies.


| Market Size in | USD 26.32 MN |
| Market Forecast in | |
| CAGR | |
| Forecast Period | |
| Units Considered | Value (USD MN) |
Japan AR Glass Market Trends and Insights
- This represents a compound annual growth rate of 63.4%, significantly outpacing global trends and positioning Japan as a critical hub for AR glass innovation and adoption.
- Japan's advanced semiconductor ecosystem, strong consumer electronics manufacturing base, and early adoption of immersive technologies are driving this remarkable expansion. The Japanese market benefits from robust investments in enterprise AR applications, particularly in manufacturing, logistics, and healthcare sectors.
- Japan's aging workforce and labor shortages are accelerating adoption of AR glass solutions for training, remote assistance, and operational efficiency.
- By 2030, Japan is expected to capture a substantial share of the Asia Pacific AR glass market, driven by both domestic demand and export opportunities to neighboring regions. Key players in Japan are leveraging the country's optical and display technology expertise to develop next-generation AR glass products.
- The convergence of 5G infrastructure, AI integration, and miniaturization technologies is creating a favorable environment for sustained market growth through 2030..
Key Market Statistics
- CAGR (2025-2030) CAGR 63.4%
- Market Size, 2025 ~USD 91.5 Million
- Forecast, 2030 ~USD 1066.5 Million
- Country Japan
Japan AR Glass Market Overview
Exceptional Growth Trajectory :
Japan's AR glass market is projected to grow from $91.5 million in 2025 to $1,066.5 million by 2030, representing a 63.4% CAGR that significantly exceeds the global average of 59%, establishing Japan as a leading regional market.
Advanced Semiconductor Ecosystem :
Japan's world-class semiconductor manufacturing capabilities and established electronics infrastructure provide a competitive advantage for AR glass development, attracting major technology investments and fostering innovation in optical and display technologies.
Enterprise and Consumer Adoption :
Strong demand from Japanese enterprises in manufacturing, healthcare, and logistics sectors, combined with growing consumer interest in immersive technologies, is driving dual-market expansion and creating diverse revenue streams across industrial and retail segments.
Strategic Technology Partnerships :
Japan's major electronics corporations and startups are forming strategic alliances with global AR leaders, accelerating product development cycles and market penetration while establishing Japan as a critical innovation hub for next-generation AR glass solutions.
Japan AR Glass Market Dynamics
- The 63.4% CAGR reflects strong demand from enterprise sectors seeking productivity enhancements and consumer markets embracing next-generation computing interfaces.
- Japan's semiconductor leadership, combined with investments in AR infrastructure and talent development, creates a favorable ecosystem for sustained expansion. The forecast growth to $1.07 billion by 2030 underscores Japan's strategic importance in the global AR landscape.
- Government initiatives supporting digital transformation, coupled with major corporate R&D investments, will accelerate commercialization of advanced AR glass products.
- Japan's aging workforce and labor challenges further incentivize enterprise adoption of AR solutions for training, maintenance, and operational efficiency, ensuring long-term market momentum..
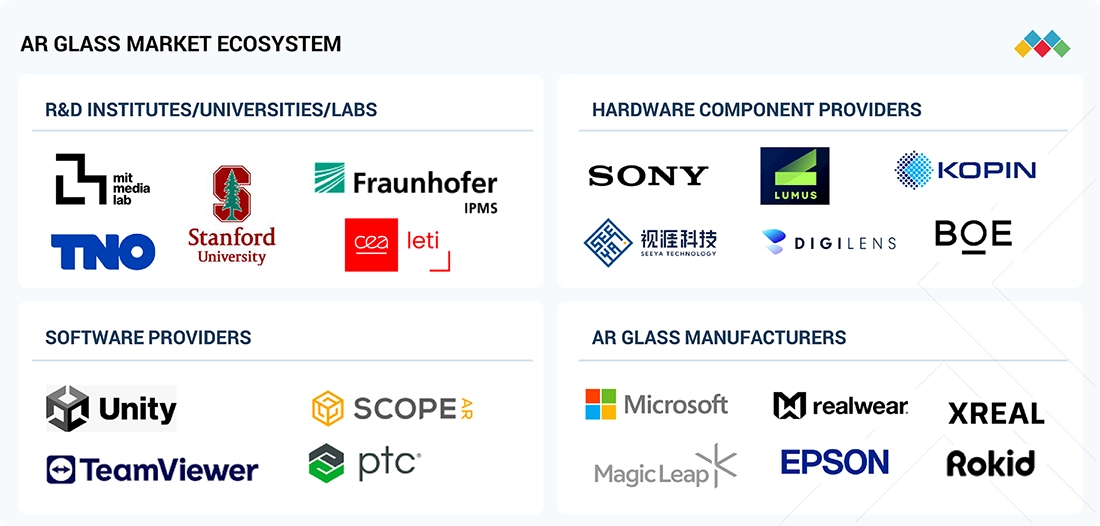
Market Ecosystem
AR Glass Market: COMMERCIAL USE CASES ACROSS INDUSTRIES
| COMPANY | USE CASE DESCRIPTION | BENEFITS |
|---|---|---|
 |
Uses AR glasses to guide technicians during complex aircraft wire assembly, displaying 3D wiring diagrams and step-by-step instructions directly in the worker’s field of view | Reduces wiring time by up to 25%, minimizes human error, and enhances worker efficiency and training accuracy |
 |
Employs AR glasses for remote maintenance and quality inspections in manufacturing plants, allowing experts to assist on-site technicians through live AR annotations | Decreases machine downtime, improves inspection precision, and reduces travel costs for technical support teams. |
 |
Integrates AR glasses for vehicle assembly and logistics operations, providing visual instructions and real-time component positioning to line workers | Improves assembly accuracy, reduces rework, and enhances production line throughput and safety |
 |
Deploys AR smartglasses in warehouses for “vision picking,” where workers receive item locations and picking lists through head-up displays | Increases order-picking speed by 15–20%, minimizes manual errors, and improves worker ergonomics |
 |
Uses AR glasses for remote client demonstrations and immersive training sessions, allowing teams to visualize digital twins and simulated environments in real-time | Boosts client engagement, reduces training costs, and enables interactive collaboration across global teams |
Logos and trademarks shown above are the property of their respective owners. Their use here is for informational and illustrative purposes only.
Related Ecosystem
Augmented Virtual Reality
- Sensors
- Virtual Reality Devices
- Augmented Reality
- Virtual Reality
- Augmented Reality Devices
- MICROSOFT CORPORATION
- Lenovo
- VIVITEK CORPORATION
- Apple Inc.
Communication And Connectivity Technology
- Sensors
- Smart Card & Readers
- Cellular Network
- Femtocell
- Image Sensors
- Cisco Systems, Inc.
- HUAWEI TECHNOLOGIES CO LTD
- Lenovo
- CommScope Holding Company, Inc.
- Nokia corporation
Display Technology
- Augmented Reality
- Liquid Crystal Display (LCD)
- Sensors
- Virtual Reality Devices
- Liquid Crystal on Silicon (LCOS)
- VIVITEK CORPORATION
- Samsung
- Lenovo
- Panasonic Holdings Corporation
- Lg corp
Key Takeaways
- Japan's AR glass market will grow from $91.5M (2025) to $1,066.5M (2030) at a 63.4% CAGR, outpacing global growth rates.
- Enterprise applications in manufacturing, logistics, and healthcare are primary growth drivers in Japan's market.
- Japan's semiconductor expertise and optical technology leadership position it as a regional innovation center for AR glass development.
- Labor shortages and an aging workforce in Japan are accelerating corporate adoption of AR glass solutions for training and remote operations.
AR Glass Market Report Scope
| Report Metric | Details |
|---|---|
| Base Year | 2025 |
| Fastest Growing Segment | TETHERED (Connectivity) |
| Forecast Period | 2025–2030 |
| Growth Rate | CAGR of 59% from 2025 to 2030 |
| Largest Segment | MARKERLESS AR (Technology) |
| Market Size Base Year (Billions) | ~USD 0.98 (2025) |
| Revenue Forecast (Billions) | ~USD 9.98 (2030) |
| Segments Covered | Connectivity, Component, Technology, Application |
Japan AR Glass Market Report Segmentation
4 segment dimensions are covered across the global market.
By Connectivity
- Standalone
- Tethered
By Component
- Cameras
- Cases & Connectors
- Controllers
- Displays
- Lenses
- Other Components
- Processors & Memory
- Sensors
By Technology
- Marker-Based Ar
- Markerless Ar
By Application
- Aerospace & Defense
- Automotive
- Commercial
- Consumer
- Energy
- Enterprise & Industrial
- Healthcare
- Other Applications
JAPAN: AR GLASS MARKET, BY APPLICATION, 2025–2030
| Segment | 2025 | 2026 | 2027 | 2028 | 2029 | 2030 | CAGR (%) |
|---|---|---|---|---|---|---|---|
| AEROSPACE & DEFENSE | 1.7 | 2.4 | 3.4 | 5.3 | 8.9 | 15.9 | 56.3 |
| AUTOMOTIVE | 7.5 | 10.9 | 16.7 | 27 | 47.1 | 88.3 | 63.6 |
| COMMERCIAL | 17.6 | 26.4 | 41.8 | 70.5 | 127.2 | 247.8 | 69.7 |
| CONSUMER | 5.3 | 7.6 | 11.6 | 18.6 | 32 | 59.5 | 62 |
| ENERGY | 1.7 | 2.2 | 3 | 4.4 | 6.9 | 11.5 | 46.4 |
| ENTERPRISE & INDUSTRIAL | 41.3 | 59.6 | 90.9 | 147.4 | 255.9 | 479.2 | 63.3 |
| HEALTHCARE | 8.5 | 12.3 | 18.8 | 30.6 | 53.3 | 100.2 | 63.8 |
| OTHER APPLICATIONS | 7.8 | 10.8 | 15.6 | 23.6 | 37.8 | 64 | 52.4 |
| TOTAL | 91.5 | 132.2 | 201.8 | 327.5 | 569.1 | 1066.5 | 63.4 |
Target Audience
- AR Glass Manufacturers & OEMs : Manufacturers need Japan-specific market data to identify growth opportunities, understand competitive dynamics, assess manufacturing partnerships with Japanese suppliers, and develop localized product strategies for this high-growth market.
- Enterprise Technology Buyers : Japanese corporations in manufacturing, healthcare, and logistics require market insights to evaluate AR glass solutions, benchmark adoption rates within their industries, and justify investment decisions based on regional market trends and ROI data.
- Semiconductor & Component Suppliers : Suppliers of optical components, displays, processors, and sensors need Japan market intelligence to identify demand drivers, forecast component requirements, and establish partnerships with AR glass manufacturers operating in this expanding market.
- Investment & Private Equity Firms : Investors targeting Japan's technology sector require detailed market forecasts, growth drivers, and competitive landscape analysis to identify promising AR glass startups and established players for funding and acquisition opportunities.
- Government & Policy Organizations : Japanese government agencies and policy bodies need market data to inform digital transformation initiatives, R&D funding decisions, and regulatory frameworks that support the nation's AR glass industry competitiveness and innovation ecosystem.
Key Companies in the Japan AR Glass Market
| Company | HQ | Ownership | Strongest segments |
|---|---|---|---|
| MICROSOFT | United States | Public Company | Azure and other cloud services,Microsoft 365 commercial (including Teams, security, compliance, Copilot),LinkedIn and Dynamics products and cloud services, |
| SEIKO EPSON CORPORATION | Japan | Public Company | Home and Office Inkjet Printers & Consumables,Commercial & Industrial Inkjet, Label, POS, and Printheads,Visual Communications (LCD Projectors, Smart Glasses), |
| VUZIX CORPORATION | United States | Public Company | M Series smart glasses,Vuzix Blade and Shield,Vuzix Ultralite Z100 and consumer-oriented devices, |
| LENOVO | China | Public Company | Small form factor PCs and embedded signage controllers,Thin clients and dedicated media players,Tablets and smart devices for kiosks/PoS, |
MICROSOFT
Microsoft is a public technology company founded in 1975 in the United States, employing 228,000 people and operating globally across software, cloud computing, and hardware sectors.
SEIKO EPSON CORPORATION
Seiko Epson Corporation is a Japanese public company founded in 1942 with 74,619 employees, specializing in imaging and printing technologies.
VUZIX CORPORATION
Vuzix Corporation is a public technology company founded in 1997 in the United States with 88 employees, specializing in augmented reality and wearable display technologies.
LENOVO
Lenovo is a public technology company founded in 1984 in China, operating as a global manufacturer of computing devices and IT solutions.
Reasons to Buy this Report
- Market-Specific Growth Intelligence : Gain detailed insights into Japan's 63.4% CAGR trajectory and understand the unique drivers propelling the market beyond global averages, enabling precise investment and expansion strategies tailored to the Japanese market.
- Competitive Landscape Analysis : Identify key Japanese and international players operating in the AR glass space, understand their market positioning, partnerships, and product strategies specific to Japan's regulatory and consumer environment.
- Enterprise Adoption Roadmap : Access detailed segmentation of enterprise demand across manufacturing, healthcare, logistics, and other sectors in Japan, with insights into implementation timelines, ROI expectations, and sector-specific use cases.
- Technology and Supply Chain Insights : Understand Japan's semiconductor supply chain advantages, optical component manufacturing capabilities, and technology partnerships that position the country as a critical hub for AR glass innovation and production.
- Strategic Market Entry Framework : Develop informed go-to-market strategies for Japan with data on consumer preferences, regulatory requirements, distribution channels, and partnership opportunities specific to the Japanese AR glass ecosystem.
Frequently asked questions
What is the projected market size of AR glass in Japan by 2030?
Japan's AR glass market is projected to reach $1,066.5 million by 2030, growing from $91.5 million in 2025.
What is the CAGR for Japan's AR glass market?
Japan's AR glass market is expected to grow at a compound annual growth rate of 63.4% between 2025 and 2030.
Which industries are driving AR glass adoption in Japan?
Manufacturing, logistics, healthcare, and enterprise training sectors are the primary drivers of AR glass adoption in Japan.
Why is Japan's AR glass market growing faster than the global average?
Japan's advanced semiconductor infrastructure, optical technology expertise, labor shortages, and early adoption of immersive technologies are driving faster-than-average growth.
What role does Japan play in the Asia Pacific AR glass market?
Japan is positioned as a critical innovation hub and manufacturing center for AR glass in Asia Pacific, with significant export potential to neighboring regions.
RESEARCH METHODOLOGY
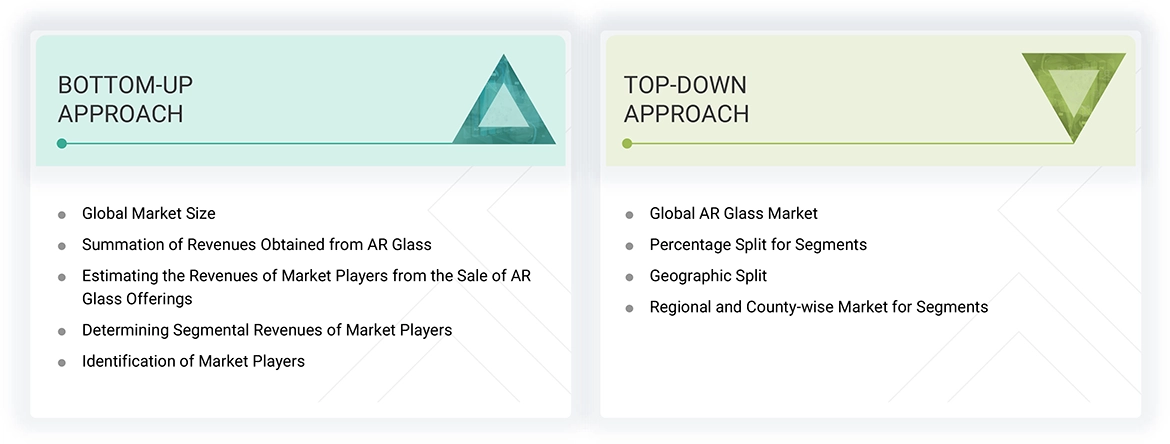
The research study involved four major activities in estimating the size of the AR glass market. Exhaustive secondary research has been done to collect important information about the market and peer markets. The validation of these findings, assumptions, and sizing with the help of primary research with industry experts across the value chain has been the next step. Both top-down and bottom-up approaches have been used to estimate the market size. Post which the market breakdown and data triangulation have been adopted to estimate the market sizes of segments and subsegments.
Secondary Research
In the secondary research process, various secondary sources were referred to to identify and collect information required for this study. The secondary sources include annual reports, press releases, investor presentations of companies, white papers, and articles from recognized authors. Secondary research has been mainly done to obtain key information about the market’s value chain, the pool of key market players, market segmentation according to industry trends, regional outlook, and developments from market and technology perspectives.
In the AR glass market report, the global market size has been estimated using the top-down and bottom-up approaches, along with several other dependent submarkets. Major players in the market were identified using extensive secondary research, and their presence in the market was determined using secondary and primary research. All the percentage shares splits, and breakdowns have been determined using secondary sources and verified through primary sources.
Primary Research
Extensive primary research has been conducted after understanding the AR glass market scenario through secondary research. Several primary interviews have been conducted with key opinion leaders from the demand- and supply-side vendors across four major regions—North America, Europe, Asia Pacific, and RoW. Approximately 25% of the primary interviews have been conducted with the demand-side vendors and 75% with the supply-side vendors. Primary data was collected mainly through telephonic interviews, which comprised 80% of the total primary interviews; questionnaires and emails were also used to collect the data.
After successful interaction with industry experts, brief sessions were conducted with highly experienced independent consultants to reinforce the primary research findings. This, along with the in-house subject matter experts’ opinions, has led us to the findings as described in the report.
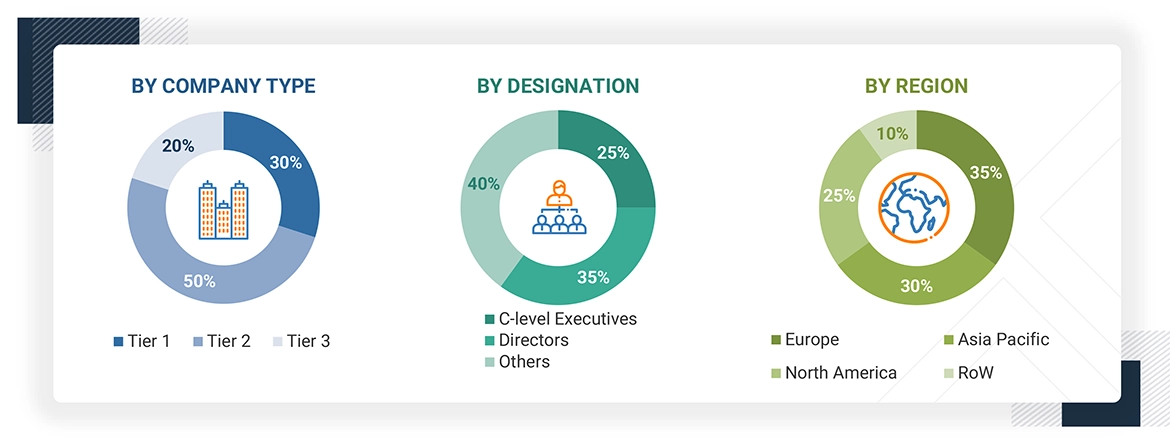
Note: “Others” includes sales, marketing, and product managers
To know about the assumptions considered for the study, download the pdf brochure
Market Size Estimation
In the market engineering process, both top-down and bottom-up approaches and data triangulation methods have been used to estimate and validate the size of the AR glass market and other dependent submarkets. The research methodology used to estimate the market sizes includes the following:
- Identifying top-line investments and spending in the ecosystem, and considering segment-level splits and major market developments
- Identifying different stakeholders in the AR glass market that influence the entire market, along with participants across the supply chain
- Analyzing major manufacturers in the AR glass market and studying their product portfolio
- Analyzing trends related to the adoption of AR glass products
- Tracking recent and upcoming market developments, including investments, R&D activities, product launches, expansions, acquisitions, partnerships, collaborations, agreements, and investments, as well as forecasting the market size based on these developments and other critical parameters
- Carrying out multiple discussions with key opinion leaders to identify the adoption trends of AR glasses.
- Segmenting the overall market into various other market segments
- Validating the estimates at every level through discussions with key opinion leaders, such as chief executives (CXOs), directors, and operation managers, and finally with the domain experts at MarketsandMarkets
AR Glass Market : Top-Down and Bottom-Up Approach
Data Triangulation
After arriving at the overall market size by the market size estimation process explained in the earlier section, the overall AR glass market has been divided into several segments and subsegments. To complete the overall market engineering process and arrive at the exact statistics for all segments, the data triangulation and market breakdown procedures have been used, wherever applicable. The data was triangulated by studying various factors and trends from the perspectives of demand and supply. Along with data triangulation and market breakdown, the market has been validated by top-down and bottom-up approaches.
Market Definition
Augmented reality (AR) glass encompasses wearable technology, such as smart eyewear or head-mounted displays (HMDs), designed to overlay digital elements onto the real-world environment. These devices offer interactive, real-time visualizations, enabling users to engage with their surroundings while seamlessly accessing digital content without using their hands.
The AR glass comprises eyewear, smart glasses, and HMDs, available as tethered or standalone systems. These solutions are deployed in diverse use cases, such as remote support, equipment maintenance, surgical procedures, warehouse operations, design validation, training environments, and defense applications. By improving operational efficiency, situational awareness, and decision-making, AR Glass is revolutionizing workflows across industries such as healthcare, manufacturing, logistics, retail, automotive, and defense. As organizations increasingly invest in digital transformation, AR glass is an essential interface bridging the physical and digital worlds.
The AR glass market is segmented based on connectivity, component, technology, application, and region. In terms of connectivity, AR glasses are categorized into tethered and standalone types. Tethered glasses rely on external devices such as smartphones or PCs, while standalone glasses have built-in processors and operate independently. The component segment includes displays, sensors, lenses, processors & memory, controllers, cameras, cases, connectors, and other related parts. For technology, the market is divided into marker-based AR and markerless AR. Marker-based AR uses visual markers to trigger digital content, whereas markerless AR operates without markers, using environmental understanding. The application segment covers various sectors, such as consumer, commercial, enterprise, healthcare, aerospace and defense, automotive, energy, and other fields. This segmentation helps understand how AR glasses are used across different industries and how their components and technologies vary based on specific needs.
Key Stakeholders
- AR Glass Manufacturers
- Component Suppliers
- Software & Platform Developers
- Application Developers & Integrators
- End-use Industries (Buyers/Users)
- Distributors & Channel Partners
- Research Institutions & Standard Bodies
- Technology Investors
- Government, Financial Institutions, and Investment Communities
Report Objectives
- To describe and forecast the overall AR glass market, by connectivity, component, technology, and application in terms of value
- To forecast the market, by connectivity, in terms of volume
- To describe different types of AR glasses, namely, head-mounted and eyewear
- To describe and forecast the market for four key regions: North America, Europe, Asia Pacific, and RoW, in terms of value
- To provide detailed information regarding drivers, restraints, opportunities, and challenges influencing the growth of the market
- To provide a detailed overview of the supply chain of the AR glass ecosystem, along with the average selling prices of the product type
- To strategically analyze the ecosystem, Porter’s five forces, key stakeholders & buying criteria, technology analysis, investment and funding scenario, key conferences & events, tariffs and regulations, patent landscape, trade landscape, and case studies pertaining to the market under study
- To strategically analyze micromarkets1 with regard to individual growth trends, prospects, and contributions to the overall market
- To analyze opportunities in the market for stakeholders and provide a competitive landscape of the market
- To analyze the impact of AI/Gen AI and the US tariff on the AR glass market
- To analyze competitive developments, such as product launches, expansions, partnerships, and collaborations, in the market
- To strategically profile the key players in the market and comprehensively analyze their market ranking and core competencies
Available customizations:
With the given market data, MarketsandMarkets offers customizations according to the specific requirements of companies. The following customization options are available for the report:
Country-wise Information:
- Country-wise breakdown for North America, Europe, Asia Pacific, and RoW
Company Information:
- Detailed analysis and profiling of additional market players (up to five)
Get the Full AR Glass Market Report
Full forecast, segment splits, and company analysis for all AR Glass Market.
- France AR Glass Market
- Germany AR Glass Market
- Italy AR Glass Market
- Poland AR Glass Market
- Spain AR Glass Market
- UK AR Glass Market
- Australia AR Glass Market
- China AR Glass Market
- India AR Glass Market
- Indonesia AR Glass Market
- Malaysia AR Glass Market
- South Korea AR Glass Market
- Thailand AR Glass Market
- Vietnam AR Glass Market
- Nordics AR Glass Market
- Rest Of Europe AR Glass Market
- Rest Of Asia Pacific AR Glass Market
- Bahrain AR Glass Market
- Kuwait AR Glass Market
- Oman AR Glass Market
- Qatar AR Glass Market
- Rest Of Middle East AR Glass Market
- Saudi Arabia AR Glass Market
- UAE AR Glass Market
- Other African Countries AR Glass Market
- South Africa AR Glass Market
- Canada AR Glass Market
- Mexico AR Glass Market
- US AR Glass Market
Need a Tailored Report?
Customize this report to your needs
Get 10% FREE Customization
Customize This Report
