
Asia Pacific Can Coatings Market (2025-2030)

The Asia Pacific Can Coatings Market was valued at $881.86 Million in 2025 and projected to reach to $1108.95 Million by 2030, representing a compound annual growth rate of 4.69%. Asia Pacific's can coatings market is positioned for sustained growth, expanding from USD 881.86 million in 2025 to USD 1,108.95 million by 2030.


| Market Size in | USD 26.32 MN |
| Market Forecast in | |
| CAGR | |
| Forecast Period | |
| Units Considered | Value (USD MN) |
Asia Pacific Can Coatings Market Trends and Insights
- Asia Pacific's growth trajectory reflects robust demand from beverage and food packaging sectors across emerging economies.
- The region's can coatings market is driven by increasing consumption patterns, rising disposable incomes, and expanding manufacturing capabilities in countries like China, India, and Southeast Asia. Asia Pacific's can coatings market is expanding at a compound annual growth rate (CAGR) of 4.69% during the 2025-2030 forecast period.
- This growth outpaces global trends, positioning Asia Pacific as a critical hub for can coating innovation and production.
- Asia Pacific's market dynamics are shaped by stringent environmental regulations, technological advancements in coating formulations, and the shift toward sustainable packaging solutions that meet both consumer and regulatory demands..
Key Market Statistics
- CAGR (2025-2030) 4.69% CAGR
- Market Size, 2025 ~USD 881.86 Million
- Forecast, 2030 ~USD 1108.95 Million
- Geography Asia Pacific
Asia Pacific Can Coatings Market Overview
China Dominates Regional Market :
China leads Asia Pacific can coatings with USD 466.57 million in 2025, driven by massive beverage production capacity and expanding food packaging demand from urbanization and rising middle-class consumption.
Japan's Premium Segment Growth :
Japan represents USD 201.64 million market size, characterized by high-quality coating specifications, advanced manufacturing standards, and strong demand from premium beverage and specialty food sectors.
Emerging Economies Acceleration :
Thailand and India combined account for USD 250.43 million, with accelerating growth fueled by increasing disposable incomes, expanding food and beverage industries, and rising consumer packaged goods consumption.
4.69% Regional CAGR Trajectory :
Asia Pacific can coatings market grows at 4.69% CAGR from 2025 to 2030, outpacing the global rate of 4.46%, reflecting region's robust economic expansion and packaging sector modernization.
Asia Pacific Can Coatings Market Dynamics
- The region benefits from accelerating urbanization, rising disposable incomes across emerging economies, and increasing consumption of packaged beverages and food products.
- China's manufacturing dominance and Japan's premium quality standards anchor the market, while India and Thailand represent high-growth opportunities. Key growth drivers include regulatory shifts toward sustainable coatings, technological advancements in coating formulations, and consolidation among beverage manufacturers.
- The region's young demographic profile and expanding retail infrastructure support continued demand expansion.
- Strategic investments in coating production capacity and R&D initiatives will be critical for market participants to capture emerging opportunities across diverse consumer segments..
Market Ecosystem
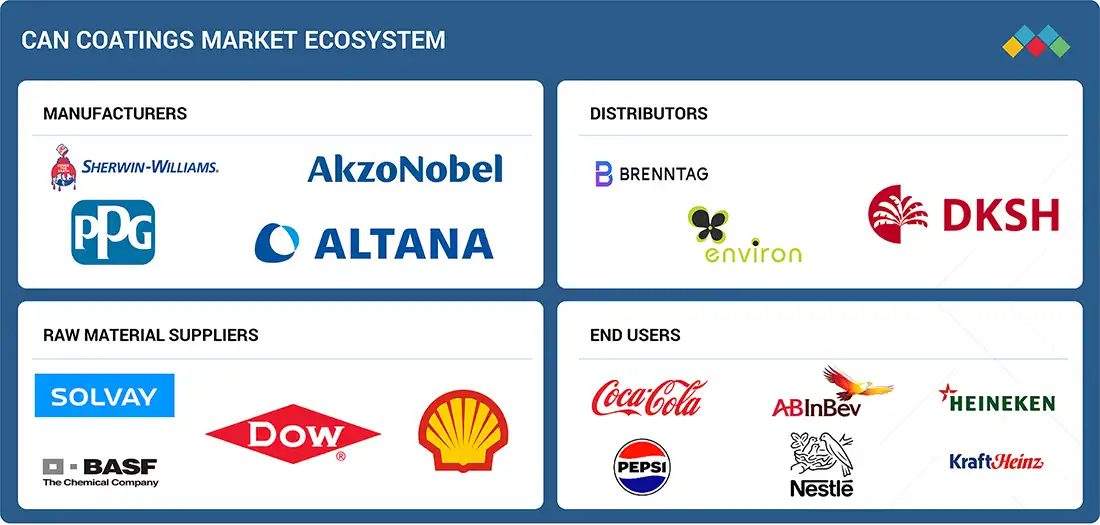
Can Coatings Market: COMMERCIAL USE CASES ACROSS INDUSTRIES
| COMPANY | USE CASE DESCRIPTION | BENEFITS |
|---|---|---|
 |
Interior polymer lining of aluminum beverage cans to separate cola from metal | Prevents corrosion and metallic taste, and preserves flavor and carbonation during shelf life |
 |
Food-grade internal can coatings for soda and juice cans to protect product integrity | Maintains taste, prevents metal migration, and extends shelf life while enabling efficient filling |
 |
Uses internally coated aluminum cans for beer and partners on low-carbon can developments | Protects beer quality, supports shelf life, and sustainability goals via recyclable coated cans |
 |
Interior coatings for beer cans and external finishes/decorations for brand differentiation | Preserves flavor and carbonation; decorative coatings improve shelf appeal and tactile brand cues |
 |
Uses polymer linings in food and beverage cans to separate product from metal | Protects nutrients and taste, reduces corrosion, and addresses regulatory/consumer safety concerns |
Logos and trademarks shown above are the property of their respective owners. Their use here is for informational and illustrative purposes only.
Related Ecosystem
Paints And Coatings
- Polyurethane Resin
- Alkyd Resins
- Epoxy Resin
- Polyester Resin
- Acrylics
- Basf se
- JOTUN
- PPG Industries, Inc.
- DOW CHEMICAL COMPANY
- Akzonobel n.v.
Key Takeaways
- Asia Pacific's can coatings market is valued at USD 881.86 million in 2025 and will grow to USD 1,108.95 million by 2030.
- Asia Pacific is growing at a 4.69% CAGR, outpacing the global average and reflecting strong regional demand.
- Asia Pacific's market is driven by beverage and food packaging expansion across emerging economies with rising consumer spending.
- Asia Pacific's regulatory environment and sustainability trends are accelerating adoption of advanced coating technologies.
Can Coatings Market Report Scope
| Report Metric | Details |
|---|---|
| Base Year | 2025 |
| Fastest Growing Segment | BEVERAGE CANS (Application) |
| Forecast Period | 2025-2030 |
| Growth Rate | CAGR of 4.46% from 2025 to 2030 |
| Largest Segment | EPOXY (Type) |
| Market Size Base Year (Billions) | ~USD 2.77 (2025) |
| Revenue Forecast (Billions) | ~USD 3.44 (2030) |
| Segments Covered | Type, Application |
Asia Pacific Can Coatings Market Report Segmentation
2 segment dimensions are covered across the global market.
By Type
- Acrylic
- Epoxy
- Other Types
- Polyester
By Application
- Aerosol Cans
- Beverage Cans
- Food Cans
- Other Applications
Target Audience
- Coating Manufacturers & Suppliers : Need regional market data to optimize production capacity, identify high-growth country markets, and develop localized product portfolios aligned with Asia Pacific demand patterns.
- Beverage & Food Packaging Companies : Require market intelligence on coating availability, supplier landscape, and regional pricing trends to secure reliable supply chains and manage packaging cost structures.
- Investment & Private Equity Firms : Seek detailed market sizing and growth forecasts to evaluate acquisition targets, assess investment returns, and identify consolidation opportunities in high-growth Asia Pacific markets.
- Strategic Business Planners : Need country-specific market data and competitive insights to develop expansion strategies, assess market entry feasibility, and prioritize geographic resource allocation.
- Regulatory & Compliance Officers : Require regional market context and demand drivers to understand coating specification requirements, sustainability trends, and regulatory compliance needs across Asia Pacific jurisdictions.
Countries within Asia Pacific - compare and drill down
| Country | 2025 size (native) |
|---|---|
| China | USD 466.57 Million |
| Japan | USD 201.64 Million |
| India | USD 86.8 Million |
| Thailand | USD 163.63 Million |
| Australia | USD 25.79 Million |
Country market size visualization
Reasons to Buy this Report
- Country-Level Market Granularity : Access detailed market sizing for China, Japan, India, Thailand, and Australia with specific 2025 valuations and growth trajectories to identify highest-potential investment and expansion markets.
- Competitive Landscape Intelligence : Understand regional competitive dynamics, market consolidation trends, and key player strategies specific to Asia Pacific's diverse regulatory and consumer environments.
- Growth Opportunity Mapping : Identify emerging sub-segments and geographic pockets within Asia Pacific experiencing accelerated growth, enabling targeted market entry and product development strategies.
- Demand Driver Analysis : Gain insights into region-specific demand catalysts including urbanization rates, disposable income growth, beverage consumption patterns, and food safety regulations driving market expansion.
- Strategic Planning & Forecasting : Leverage 5-year forecasts and CAGR projections to inform capital allocation, capacity planning, and go-to-market strategies tailored to Asia Pacific's unique growth profile.
Frequently asked questions
What is the current size of the Asia Pacific can coatings market?
The Asia Pacific can coatings market is valued at USD 881.86 million in 2025 and is projected to reach USD 1,108.95 million by 2030.
What is the growth rate of Asia Pacific's can coatings market?
Asia Pacific's can coatings market is growing at a CAGR of 4.69% from 2025 to 2030, which exceeds the global average growth rate.
Which sectors drive demand in Asia Pacific's can coatings market?
Beverage and food packaging sectors are the primary drivers of Asia Pacific's can coatings market, supported by rising consumption and disposable incomes.
What factors influence Asia Pacific's can coatings market growth?
Asia Pacific's market growth is influenced by expanding manufacturing capabilities, regulatory compliance, sustainability initiatives, and technological innovations in coating formulations.
How does Asia Pacific's growth compare to global trends?
Asia Pacific's 4.69% CAGR outpaces the global CAGR of 4.46%, positioning the region as a high-growth market for can coatings.
RESEARCH METHODOLOGY
The study involved four major activities in estimating the market size for can coatings. Exhaustive secondary research was done to collect information on the market, the peer market, and the parent market. The next step was to validate these findings, assumptions, and sizing with industry experts across the value chain through primary research. Both top-down and bottom-up approaches were employed to estimate the complete market size. After that, the market breakdown and data triangulation procedures were used to estimate the market size of the segments and subsegments.
Secondary Research
Secondary sources used in this study included annual reports, press releases, and investor presentations of companies; white papers; certified publications; articles from recognized authors; and gold standard & silver standard websites such as Factiva, ICIS, Bloomberg, and others. The findings of this study were verified through primary research by conducting extensive interviews with key officials such as CEOs, VPs, directors, and other executives.
Primary Research
The can coatings market comprises several stakeholders, such as raw material suppliers, end-product manufacturers, and regulatory organizations in the supply chain. The demand side of this market is characterized by key opinion leaders in various applications for the can coatings market. The supply side is characterized by advancements in technology and diverse application industries. Various primary sources from both the supply and demand sides of the market were interviewed to obtain qualitative and quantitative information.
The breakdown of profiles of the interviews with experts is illustrated in the figure below:
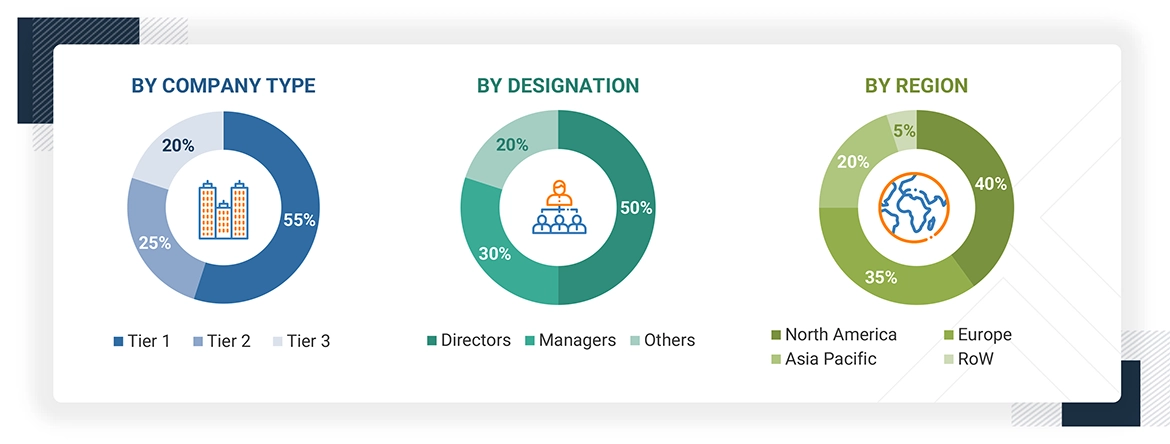
Note: Tier 1, Tier 2, and Tier 3 companies are classified based on their market revenue in 2023/2024, available in the public domain, product portfolios, and geographical presence.
Other designations include consultants and sales, marketing, and procurement managers.
To know about the assumptions considered for the study, download the pdf brochure
| COMPANY NAME | DESIGNATION | |
|---|---|---|
| The Sherwin-Williams | Senior Manager | |
| PPG Industries, Inc. | Innovation Manager | |
| Akzo Nobel N.V. | Vice President | |
| ALTANA AG | Production Supervisor | |
| Kansai Paint Co., Ltd. | Sales Manager | |
Market Size Estimation
Both top-down and bottom-up approaches were used to estimate and validate the total size of the can coatings market. These methods were also used extensively to estimate the size of various subsegments in the market. The research methodology used to estimate the market size included the following:
- The key players in the industry have been identified through extensive secondary research.
- The supply chain of the industry has been determined through primary and secondary research.
- All percentage shares, splits, and breakdowns have been determined using secondary sources and verified through interviews with experts.
- All possible parameters that affect the markets covered in this research study have been accounted for, viewed in extensive detail, verified through primary research, and analyzed to obtain the final quantitative and qualitative data.
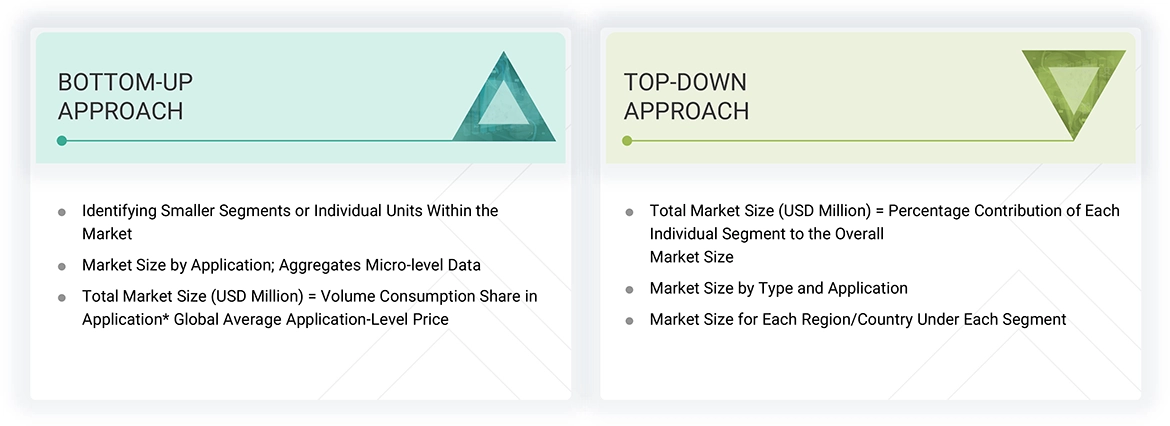
Data Triangulation
After arriving at the overall market size using the market size estimation processes as explained above, the market was split into several segments and subsegments. To complete the overall market engineering process and arrive at the exact statistics of each market segment and subsegment, data triangulation, and market breakdown procedures were employed, wherever applicable. The data was triangulated by studying various factors and trends from both the demand and supply sides in the can coatings industry.
Market Definition
According to the American Coatings Association (ACA), can coating means any protective, decorative, or functional coating applied to a can, metal sheet, or can component specifically including applications like coating two-piece or three-piece cans, sheet coating lines, side-seam sprays, and sealing compounds.
Stakeholders
- Manufacturers, Dealers, Suppliers, and Manufacturers of Can Coatings and Their Raw Materials
- Manufacturers in Various End-use Industries
- Traders, Distributors, and Suppliers of Can Coatings
- Regional Manufacturers’ Associations and Can Coatings Associations
- Government and Regional Agencies and Research Organizations
Report Objectives
- To analyze and forecast the can coatings market in terms of value
- To provide detailed information about the key factors (drivers, restraints, opportunities, and challenges) influencing market growth
- To define, segment, and project the size of the global can coatings market based on type and application
- To project the market size for five main regions: North America, Europe, Asia Pacific, the Middle East & Africa, and South America, with their key countries
- To analyze the micromarkets1 concerning individual growth trends, prospects, and their contribution to the overall market
- To analyze opportunities in the market for stakeholders and provide a competitive landscape of the market leaders
- To track and analyze R&D and competitive developments such as expansions, product launches, collaborations, investments, partnerships, agreements, developments, collaborations, and mergers & acquisitions in the can coatings market
Get the Full Can Coatings Market Report
Full forecast, segment splits, and company analysis for all Can Coatings Market.
- -Saudi Arabia Can Coatings Market
- -UAE Can Coatings Market
- Rest Of South America Can Coatings Market
- China Can Coatings Market
- Japan Can Coatings Market
- India Can Coatings Market
- Thailand Can Coatings Market
- Australia Can Coatings Market
- US Can Coatings Market
- Canada Can Coatings Market
- Mexico Can Coatings Market
- Germany Can Coatings Market
- France Can Coatings Market
- UK Can Coatings Market
- Spain Can Coatings Market
- Italy Can Coatings Market
- Brazil Can Coatings Market
- Rest Of Europe Can Coatings Market
- Rest Of Asia Pacific Can Coatings Market
- Egypt Can Coatings Market
- GCC Countries Can Coatings Market
- South Africa Can Coatings Market
- -Rest Of GCC Countries Can Coatings Market
Need a Tailored Report?
Customize this report to your needs
Get 10% FREE Customization
Customize This Report
