
Rest Of Asia Pacific Caps & Closures Market (2021-2026)

The Rest Of Asia Pacific Caps & Closures Market was valued at $2920 Million in 2021 and projected to reach to $3700 Million by 2026, representing a compound annual growth rate of 4.9%. Rest Of Asia Pacific represents a critical growth segment within the broader Asia Pacific caps and closures market, characterized by emerging economies and developing industrial infrastructure.


| Market Size in | USD 26.32 MN |
| Market Forecast in | |
| CAGR | |
| Forecast Period | |
| Units Considered | Value (USD MN) |
Rest Of Asia Pacific Caps & Closures Market Trends and Insights
- In 2021, Rest Of Asia Pacific was valued at USD 2,920 million, reflecting steady demand across beverage, pharmaceutical, and food packaging applications.
- The region is projected to expand to USD 3,700 million by 2026, growing at a compound annual growth rate (CAGR) of 4.9%, driven by increasing industrialization and rising consumer goods consumption. The caps and closures market in Rest Of Asia Pacific is characterized by growing adoption of sustainable packaging solutions and technological advancements in closure design.
- Rest Of Asia Pacific's growth trajectory is supported by expanding manufacturing capabilities and rising exports from emerging economies within the region.
- Key end-use industries in Rest Of Asia Pacific include beverages, pharmaceuticals, personal care, and food processing, all contributing to robust market expansion through 2026..
Key Market Statistics
- CAGR (2021-2026) 4.9% CAGR
- Market Size, 2021 ~USD 2920 Million
- Forecast, 2026 ~USD 3700 Million
- Country Rest Of Asia Pacific
Rest Of Asia Pacific Caps & Closures Market Overview
Market Valuation :
Rest Of Asia Pacific caps and closures market was valued at USD 2,920 million in 2021, demonstrating robust demand across multiple end-use industries including beverages, pharmaceuticals, and food packaging.
Growth Trajectory :
The region is projected to reach USD 3,700 million by 2026, representing a steady CAGR of 4.9%, outpacing several mature markets while remaining below the global average of 5.5%.
Key Application Sectors :
Beverage, pharmaceutical, and food packaging applications drive primary demand in Rest Of Asia Pacific, with emerging opportunities in personal care and industrial chemical sectors.
Regional Growth Drivers :
Rising consumer spending, expanding manufacturing capabilities, increasing regulatory compliance requirements, and growing e-commerce logistics demand are propelling market expansion across the region.
Rest Of Asia Pacific Caps & Closures Market Dynamics
- The region's 4.9% CAGR reflects steady expansion driven by rising disposable incomes, urbanization, and increased consumption of packaged goods across multiple sectors. Looking ahead to 2026, Rest Of Asia Pacific will benefit from accelerating pharmaceutical manufacturing, growing beverage consumption, and strengthening supply chain investments.
- The region's competitive cost structure and expanding middle-class population position it as an attractive market for both established manufacturers and new entrants seeking growth opportunities beyond saturated developed markets..
Market Ecosystem
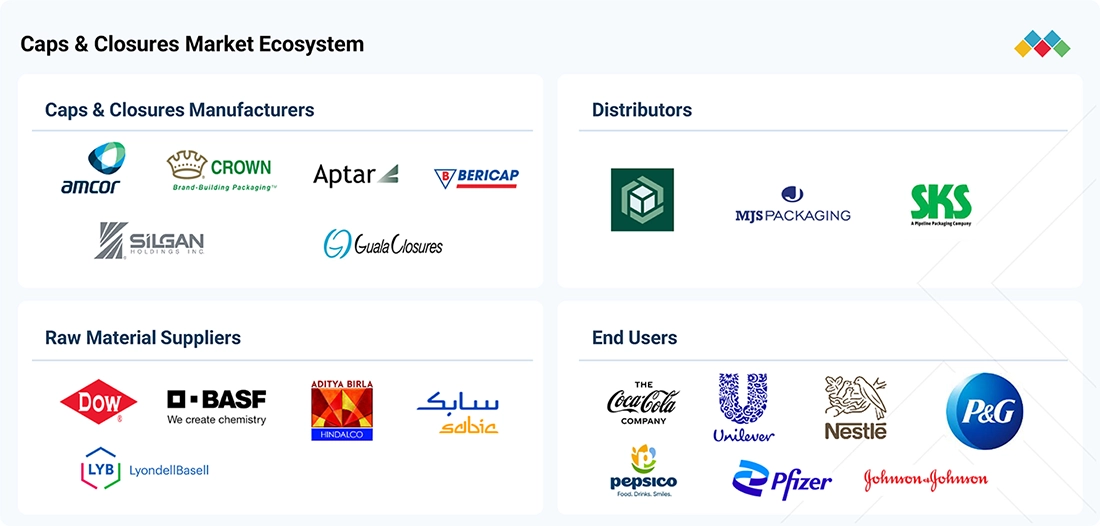
CAPS & CLOSURES MARKET: COMMERCIAL USE CASES ACROSS INDUSTRIES
| COMPANY | USE CASE DESCRIPTION | BENEFITS |
|---|---|---|
 |
Developed TetherSafe, a lightweight, mono-material polypropylene tethered closure with an integrated tether, tamper-evident band, and ergonomic grip to address regulatory and consumer demand for recyclable, lightweight, and accessible packaging | The design supported PCR and bio-renewable materials and was compatible with kerbside recycling systems in Australia and New Zealand and EU Directive 2019/904 requirements | Reduced material use and packaging weight | Minimized litter from detached caps and plastic fragments | Supported recyclability |Improved opening and resealing convenience | Enabled recyclability communication through the Australasian Recycling Label (ARL) system |
 |
Collaborated with Califia Farms to develop a customized dispensing closure for its 750-ml creamer bottle, using a four-phase process covering planning, development, testing, and commercialization | The closure was designed to integrate with the bottle shape while addressing dispensing precision, consumer usability, cost, and production requirements | Improved dispensing control and consumer usability, achieved targeted budget and launch requirements, provided shelf differentiation, and enhanced the overall consumer experience. |
 |
Collaborated with Militec Inc. to develop customized packaging solutions for specialty lubricants and greases used across sportsmen, military, law enforcement, automotive, and marine applications | Bernard used a standard cap with a ½-oz plastic bottle for liquid lubricants and sourced a specialty needle-tip applicator paired with a ½-oz grease tube to enable precise dispensing of thicker formulations | Enabled accurate product application | Reduced packaging costs | Supported handling of both liquid and semi-solid formulations | Provided tailored dispensing solutions | Packaging and turnkey filling, packaging, and distribution capabilities supported Militec’s international market expansion and business growth |
Logos and trademarks shown above are the property of their respective owners. Their use here is for informational and illustrative purposes only.
Related Ecosystem
Key Takeaways
- Rest Of Asia Pacific caps & closures market valued at USD 2,920 million in 2021, expanding to USD 3,700 million by 2026
- Rest Of Asia Pacific demonstrates a 4.9% CAGR, reflecting steady regional demand across multiple end-use industries
- Rest Of Asia Pacific is experiencing increased adoption of sustainable and innovative closure solutions driven by regulatory pressures
- Rest Of Asia Pacific's growth is supported by expanding manufacturing infrastructure and rising consumer goods consumption in emerging economies
Caps & Closures Market Report Scope
| Report Metric | Details |
|---|---|
| Base Year | 2021 |
| Fastest Growing Segment | PLASTICS (Raw Material) |
| Forecast Period | 2021-2026 |
| Growth Rate | CAGR of 5.5% from 2021 to 2026 |
| Largest Segment | PLASTIC CAPS & CLOSURES (Type) |
| Market Size Base Year (Billions) | ~USD 65.04 (2021) |
| Revenue Forecast (Billions) | ~USD 85 (2026) |
| Segments Covered | Raw Material, Type, End-Use Industry, End-Use Industry 2015-2018, End-Use Industry 2019-2026 |
Rest Of Asia Pacific Caps & Closures Market Report Segmentation
5 segment dimensions are covered across the global market.
By Raw Material
- Metal
- Metals
- Plastics
By Type
- Aluminum
- Can Ends
- Corks
- Crown Caps
- Dispensing Caps
- Glass
- Glass Stopper
- Liquid Carton Closures
- Metal Caps & Closures
- Other Caps & Closures
- Other Metal Closures
- Other Plastic Closures
- Paperboard
- Pe
- Pet
- Plastic Aerosol Sprays
- Plastic Caps & Closures
- Plastic Lotion Pumps
- Pp
- Pvc
- Rubber & Elastomer Stopper
- Rubber & Elastomers
- Screw & Lug
- Screw Caps
- Steel
- Wood
By End-Use Industry
- Beverage Packaging
- Cosmetics & Toiletries
- Food Packaging
- Healthcare Packaging
By End-Use Industry 2015-2018
- Beverage Packaging
- Cosmetics & Toiletries
- Food Packaging
- Healthcare Packaging
By End-Use Industry 2019-2026
- Beverage Packaging
- Cosmetics & Toiletries
- Food Packaging
- Healthcare Packaging
Target Audience
- Packaging Manufacturers : Caps and closures producers need Rest Of Asia Pacific-specific data to identify expansion opportunities, assess regional demand trends, and benchmark performance against regional competitors in this 4.9% CAGR market.
- Beverage & Pharma Companies : Beverage and pharmaceutical manufacturers sourcing closures require detailed Rest Of Asia Pacific market intelligence to optimize supply chain decisions, negotiate supplier contracts, and plan regional production investments.
- Private Equity & Investors : Investment firms evaluating acquisition targets or market entry strategies in Rest Of Asia Pacific need comprehensive market sizing, growth forecasts, and competitive analysis to support investment theses and valuation models.
- Supply Chain Strategists : Procurement and logistics professionals need Rest Of Asia Pacific market data to identify emerging suppliers, assess regional capacity, evaluate cost structures, and optimize sourcing strategies for this growing region.
- Market Consultants & Analysts : Business consultants and research analysts require granular Rest Of Asia Pacific market insights to support client advisory work, competitive benchmarking, and strategic planning initiatives in the packaging sector.
Reasons to Buy this Report
- Regional Market Sizing : Obtain precise valuation data for Rest Of Asia Pacific (USD 2,920M in 2021) with detailed forecasts through 2026, enabling accurate budget allocation and investment decisions specific to this high-growth region.
- Competitive Landscape Intelligence : Understand regional market dynamics, competitive positioning, and emerging players unique to Rest Of Asia Pacific, distinct from broader Asia Pacific trends and global market patterns.
- Sector-Specific Insights : Access detailed analysis of beverage, pharmaceutical, and food packaging applications within Rest Of Asia Pacific, identifying which segments offer highest growth potential and profitability.
- Growth Driver Analysis : Identify region-specific growth catalysts including regulatory changes, manufacturing expansion, and consumer behavior shifts driving the 4.9% CAGR in Rest Of Asia Pacific through 2026.
- Strategic Market Entry : Develop targeted go-to-market strategies for Rest Of Asia Pacific with localized insights on market maturity, customer preferences, distribution channels, and competitive positioning opportunities.
Frequently asked questions
What is the market size of caps and closures in Rest Of Asia Pacific?
Rest Of Asia Pacific's caps and closures market was valued at USD 2,920 million in 2021 and is projected to reach USD 3,700 million by 2026.
What is the growth rate for caps and closures in Rest Of Asia Pacific?
Rest Of Asia Pacific's caps and closures market is expected to grow at a CAGR of 4.9% from 2021 to 2026.
Which industries drive demand for caps and closures in Rest Of Asia Pacific?
Rest Of Asia Pacific's demand is primarily driven by beverages, pharmaceuticals, personal care, and food processing industries.
What trends are shaping the caps and closures market in Rest Of Asia Pacific?
Rest Of Asia Pacific is experiencing increased adoption of sustainable packaging, technological advancements in closure design, and expansion of manufacturing capabilities.
How does Rest Of Asia Pacific compare to the broader Asia Pacific region?
Rest Of Asia Pacific represents a key segment of the Asia Pacific market, contributing significantly to regional growth with its 4.9% CAGR through 2026.
RESEARCH METHODOLOGY
The study involved four major activities to estimate the current size of the global caps & closures market. Exhaustive secondary research was carried out to collect information on the market, the peer product market, and the parent product group market. The next step was to validate these findings, assumptions, and sizes with industry experts across the caps & closures value chain through primary research. The top-down and bottom-up approaches were employed to estimate the overall size of the caps & closures market. After that, market breakdown and data triangulation procedures were used to determine the size of different segments and sub-segments of the market.
Secondary Research
The market for companies offering caps & closures was determined using secondary data available through paid and unpaid sources, analyzing the product portfolios of the major companies in the ecosystem, and rating the companies by their performance and quality. Various secondary sources, such as Business Standard, Bloomberg, World Bank, and Factiva, were referred to identify and collect information for this study on the caps & closures market. In the secondary research process, various secondary sources were referred to identify and collect information related to the study. Secondary sources included annual reports, press releases, and investor presentations of door vendors, forums, certified publications, and whitepapers. The secondary research was used to obtain critical information on the industry’s value chain, the total pool of key players, market classification, and segmentation from market- and technology-oriented perspectives.
Primary Research
In the primary research process, various primary sources from both the supply and demand sides were interviewed to obtain qualitative and quantitative information for this report. The primary sources from the supply side included industry experts, such as Chief Executive Officers (CEOs), Vice Presidents (VPs), marketing directors, technology and innovation directors, and related key executives from several key companies and organizations operating in the caps & closures market. After the complete market engineering (calculations for market statistics, market breakdown, market size estimations, market forecasting, and data triangulation), extensive primary research was conducted to gather information and verify and validate the critical numbers arrived at. Primary research was also conducted to identify the segmentation types, industry trends, competitive landscape of caps & closures offered by various market players, and key market dynamics, such as drivers, restraints, opportunities, challenges, industry trends, and key player strategies. In the complete market engineering process, the top-down and bottom-up approaches and several data triangulation methods were extensively used to perform the market estimation and market forecasting for the overall market segments and subsegments listed in this report. Extensive qualitative and quantitative analysis was performed on the complete market engineering process to list the key information/insights throughout the report.
The following is the breakdown of primary respondents:
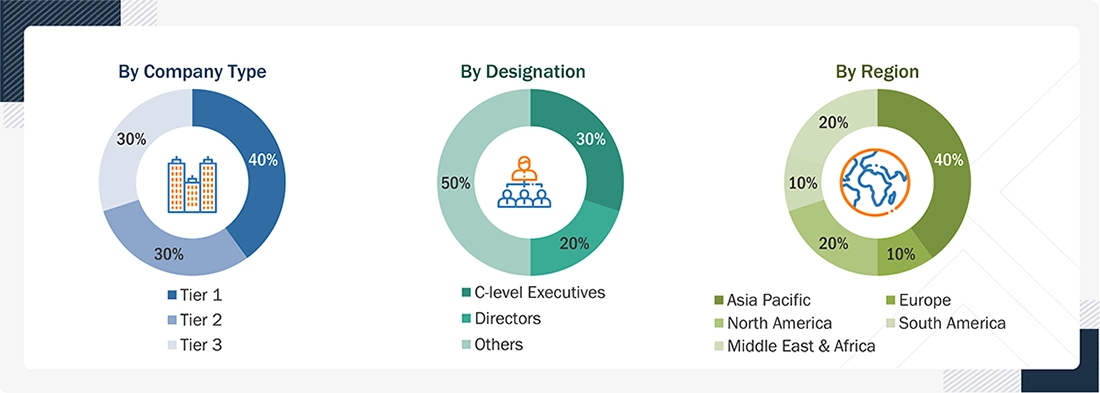
Notes: Other designations include sales, marketing, and product managers.
Tier 1: >USD 1 Billion; Tier 2: USD 500 Million–1 Billion; and Tier 3: <USD 500 Million.
To know about the assumptions considered for the study, download the pdf brochure
Market Size Estimation
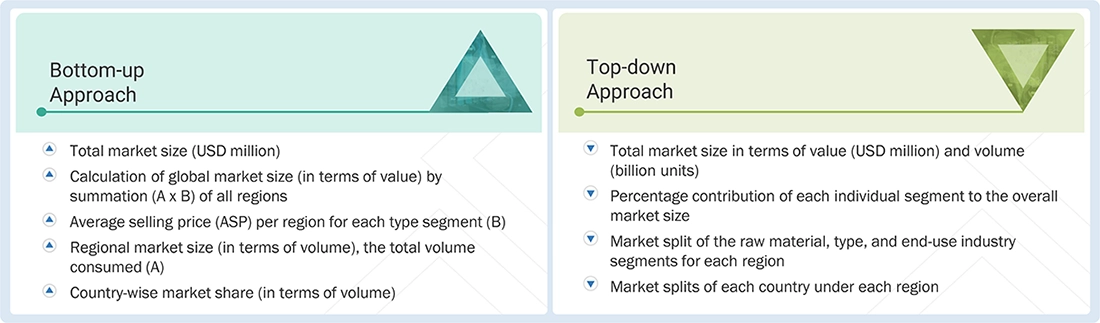
The top-down and bottom-up approaches were used to estimate and validate the size of the global caps & closures market. These approaches were also used extensively to estimate the size of various dependent market segments. The research methodology used to estimate the market size included the following:
Caps & Closures Market: Top-Down and Bottom-Up Approach
Data Triangulation
After arriving at the overall market size using the market size estimation processes, the market was split into several segments and subsegments. The data triangulation and market breakup procedures were employed, wherever applicable, to complete the overall market engineering process and arrive at the exact statistics of each market segment and subsegment. The data was triangulated by studying various factors and trends from both the demand and supply sides.
Market Definition
Caps & closures are components used to seal and secure containers, protecting packaged products from contamination, leakage, moisture, oxygen, and other external factors. They are widely used across bottles, jars, jugs, tubes, and other packaging formats to preserve product quality and enable controlled dispensing. Caps and closures include screw caps, snap-on caps, flip-top closures, dispensing closures, tamper-evident closures, child-resistant closures, sports closures, and overcaps. Depending on the application, they are manufactured from materials such as plastic, metal, and rubber or elastomers. Caps and closures play an important role in extending product shelf life, ensuring package integrity, improving convenience, and supporting product differentiation through design, functionality, and printability.
Key Stakeholders
- Caps & closures manufacturers
- Raw material suppliers
- Converters & processors
- Distributors and traders
- Industry associations and regulatory bodies
- End users
Report Objectives
- To define, describe, and forecast the size of the global caps & closures market, based on raw material, type, end-use industry, and region in terms of value
- To provide detailed information on the significant drivers, restraints, opportunities, and challenges influencing the market
- To strategically analyze micromarkets concerning individual growth trends, prospects, and their contribution to the market
- To assess the growth opportunities in the market for stakeholders and provide details on the competitive landscape for market leaders
- To forecast the market size of segments and subsegments for North America, Europe, Asia Pacific, South America, and Middle East & Africa.
- To strategically profile key players and comprehensively analyze their market shares and core competencies
- To analyze competitive developments such as product launches, acquisitions, expansions, partnerships, and agreements in the caps & closures market
- To provide the impact of AI/Gen AI on the market
Available customizations:
With the given market data, MarketsandMarkets offers customizations according to client-specific needs.
The following customization options are available for the caps & closures market report:
Product Analysis
-
A product matrix that gives a detailed comparison of the product portfolio of each company
Regional Analysis
-
A further breakdown of the caps & closures market for additional countries
Company Information
-
Detailed analysis and profiling of additional market players (up to five)
Get the Full Caps & Closures Market Report
Full forecast, segment splits, and company analysis for all Caps & Closures Market.
- France Caps & Closures Market
- Spain Caps & Closures Market
- Canada Caps & Closures Market
- Mexico Caps & Closures Market
- US Caps & Closures Market
- Saudi Arabia Caps & Closures Market
- UAE Caps & Closures Market
- South Africa Caps & Closures Market
- Brazil Caps & Closures Market
- Argentina Caps & Closures Market
- Rest Of Europe Caps & Closures Market
- Rest Of South America Caps & Closures Market
- China Caps & Closures Market
- Japan Caps & Closures Market
- India Caps & Closures Market
- Australia Caps & Closures Market
- Germany Caps & Closures Market
- UK Caps & Closures Market
Need a Tailored Report?
Customize this report to your needs
Get 10% FREE Customization
Customize This Report