
Indonesia Clean Power VFD Market (2025-2030)

The Indonesia Clean Power VFD Market was valued at $20.6 Million in 2025 and projected to reach to $27.5 Million by 2030, representing a compound annual growth rate of 6.0%. Indonesia's Clean Power VFD market is positioned for sustained growth as the nation prioritizes energy efficiency and renewable energy adoption.


| Market Size in | USD 26.32 MN |
| Market Forecast in | |
| CAGR | |
| Forecast Period | |
| Units Considered | Value (USD MN) |
Indonesia Clean Power VFD Market Trends and Insights
- This represents a compound annual growth rate (CAGR) of 6.0%, reflecting Indonesia's increasing adoption of energy-efficient technologies across industrial and renewable energy sectors.
- Indonesia's strategic focus on clean energy transition and infrastructure modernization is driving demand for variable frequency drives in power generation and distribution applications. The growth trajectory in Indonesia is supported by rising electricity demand, government renewable energy targets, and industrial efficiency initiatives.
- Indonesia's manufacturing and mining sectors are increasingly deploying VFD technology to optimize operational costs and reduce carbon footprints.
- Between 2025 and 2030, Indonesia is expected to see accelerated investment in smart grid infrastructure and distributed renewable energy systems, further propelling Clean Power VFD adoption across the archipelago..
Key Market Statistics
- CAGR (2025-2030) 6.0% CAGR
- Market Size, 2025 ~USD 20.6 Million
- Forecast, 2030 ~USD 27.5 Million
- Country Indonesia
Indonesia Clean Power VFD Market Overview
Market Valuation Growth :
Indonesia's Clean Power VFD market is valued at USD 20.6 million in 2025, with projections reaching USD 27.5 million by 2030, demonstrating robust market expansion driven by industrial modernization and renewable energy integration.
Strong CAGR Performance :
The Indonesian market is growing at a 6.0% CAGR, outpacing the global average of 5.6%, indicating accelerated adoption of variable frequency drives in the country's energy-efficient technology landscape.
Industrial Sector Adoption :
Indonesia's manufacturing and industrial sectors are increasingly deploying VFDs to reduce energy consumption and operational costs, supported by government incentives for energy efficiency and sustainability initiatives.
Renewable Energy Integration :
Growing investments in solar and wind power projects across Indonesia are driving demand for advanced VFD technologies to optimize power distribution and grid stability in clean energy applications.
Indonesia Clean Power VFD Market Dynamics
- Industrial facilities across manufacturing, mining, and processing sectors are increasingly investing in VFD technologies to reduce operational costs and meet environmental regulations.
- Government policies promoting clean energy transition and energy-efficient industrial practices are creating favorable conditions for market expansion. The forecast period through 2030 will see accelerated VFD deployment driven by rising electricity costs, growing environmental awareness, and infrastructure modernization initiatives.
- Strategic partnerships between local distributors and international VFD manufacturers will enhance market accessibility, while technological advancements in IoT-enabled and smart VFD systems will unlock new applications across Indonesia's diverse industrial landscape..
Market Ecosystem
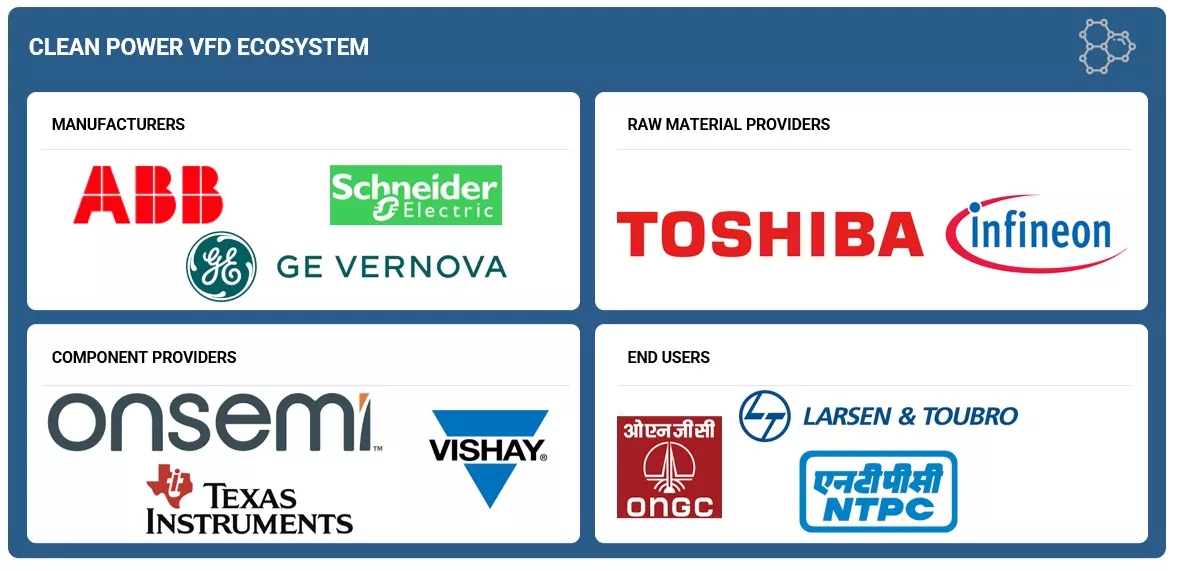
Clean Power VFD Market: COMMERCIAL USE CASES ACROSS INDUSTRIES
| COMPANY | USE CASE DESCRIPTION | BENEFITS |
|---|---|---|
 |
SmartD's Clean Power VFD retrofitted a Saint-Sauveur city pump station, replacing a contactor system with a 600V SiC-based solution featuring pure sine wave output, 4-wire plug-and-play installation in under an hour, and seamless Modbus TCP integration for demand-responsive water pumping | It delivered 35% energy savings, 15 dBA noise reduction, <5% THD, extended pump life via harmonic-free operation, and enabled remote control all while eliminating extra filters and reducing long-term maintenance costs |
 |
SmartD's Clean Power VFD was installed as a direct replacement, featuring active front-end (AFE) for harmonic reduction, pure sine wave output, 480V/600V compatibility, and mobile app-based integration for seamless control system connectivity and quick recovery from interruptions | It achieved <5% harmonic distortion for grid stability, extended motor life via bearing protection and smooth operations, enabled 24/7 uptime with minimal downtime installation, cut costs by eliminating external filters, and provided French-language support for easier maintenance in extreme conditions. |
 |
Silicon carbide (SiC)-based clean power VFDs are deployed in pump systems for variable-speed motor control in industrial and commercial settings, such as a 30 kW (40 hp) pump running 8,000 hours annually at varying speed, where motors are located hundreds of meters from the power room and must comply with IEEE519 harmonic limits to prevent grid issues | They deliver 16% lower power losses and 16,080 kWh annual energy savings ($1,608/year at $0.10/kWh) with a 1.9-year ROI on the $3,000 premium, alongside <3% THDi to avoid utility fines, overheating, and equipment failures |
Logos and trademarks shown above are the property of their respective owners. Their use here is for informational and illustrative purposes only.
Related Ecosystem
Power Infrastructure
- Geographical Information System (GIS)
- Cogeneration
- Battery Electric Vehicle (BEV)
- Cellular Network
- Fuel Cell
- Siemens ag
- ABB India Limited
- SCHNEIDER ELECTRIC SE
- General Electric Company
- Eaton Corporation plc
Key Takeaways
- Indonesia's Clean Power VFD market is valued at USD 20.6 million in 2025 and is forecast to reach USD 27.5 million by 2030, growing at a 6.0% CAGR.
- Indonesia's industrial sector, particularly manufacturing and mining, is driving VFD adoption to enhance energy efficiency and reduce operational costs.
- Government renewable energy policies and smart grid infrastructure investments are accelerating Clean Power VFD deployment across Indonesia.
- Indonesia's growing electricity demand and commitment to carbon reduction targets are creating sustained market opportunities through 2030.
Clean Power VFD Market Report Scope
| Report Metric | Details |
|---|---|
| Base Year | 2025 |
| Fastest Growing Segment | EV CHARGING INFRASTRUCTURE (End User) |
| Forecast Period | 2025–2030 |
| Growth Rate | CAGR of 5.6% from 2025 to 2030 |
| Largest Segment | LOW (Voltage) |
| Market Size Base Year (Billions) | ~USD 1.16 (2025) |
| Revenue Forecast (Billions) | ~USD 1.52 (2030) |
| Segments Covered | Voltage, Application, End User |
Indonesia Clean Power VFD Market Report Segmentation
3 segment dimensions are covered across the global market.
By Voltage
- Low
- Medium
By Application
- Chillers And Cooling Systems
- Cleanrooms And Precision Environmental Controls
- Compressors
- Conveyors
- Cranes And Hoisting Equipment
- Elevators And Escalators
- Fans And Blowers
- Marine And Space-Limited Equipment
- Medical Devices And Imaging Systems
- Other Specialty Equipment
- Pumps
By End User
- Commercial Construction
- Data Centers
- Defense
- EV Charging Infrastructure
- Industrial Facilities
- Infrastructure
- Mining
- Oil & Gas
- Renewable Energy
- Transportation
- Utilities
INDONESIA: CLEAN POWER VFD MARKET, BY END USER, 2025–2030
| Segment | 2025 | 2026 | 2027 | 2028 | 2029 | 2030 | CAGR (%) |
|---|---|---|---|---|---|---|---|
| COMMERCIAL CONSTRUCTION | 3.1 | 3.3 | 3.4 | 3.6 | 3.8 | 4.1 | 5.4 |
| DATA CENTERS | 2.3 | 2.5 | 2.7 | 3 | 3.2 | 3.5 | 8.9 |
| DEFENSE | 0.5 | 0.5 | 0.5 | 0.6 | 0.6 | 0.6 | 2.5 |
| EV CHARGING INFRASTRUCTURE | 0.2 | 0.2 | 0.3 | 0.3 | 0.3 | 0.3 | 9.2 |
| INDUSTRIAL FACILITIES | 7.4 | 7.7 | 8.1 | 8.5 | 8.9 | 9.4 | 5.1 |
| INFRASTRUCTURE | 1.8 | 1.9 | 2 | 2.1 | 2.2 | 2.4 | 5.9 |
| MINING | 0.5 | 0.5 | 0.5 | 0.6 | 0.6 | 0.6 | 4.6 |
| OIL & GAS | 1.5 | 1.6 | 1.6 | 1.7 | 1.7 | 1.8 | 3 |
| RENEWABLE ENERGY | 0.7 | 0.8 | 0.9 | 1 | 1.1 | 1.2 | 9.4 |
| TRANSPORTATION | 1.1 | 1.1 | 1.2 | 1.3 | 1.4 | 1.5 | 6.5 |
| UTILITIES | 1.5 | 1.6 | 1.7 | 1.8 | 2 | 2.2 | 8.4 |
| TOTAL | 20.6 | 21.7 | 22.9 | 24.3 | 25.8 | 27.5 | 6 |
Target Audience
- VFD Manufacturers & Suppliers : Identify market entry opportunities and expansion potential in Indonesia's growing industrial VFD sector, with data on demand trends, customer segments, and competitive positioning to guide product strategy.
- Industrial Equipment Distributors : Understand Indonesia's VFD distribution landscape, customer preferences, and sector-specific demand to optimize inventory, pricing strategies, and channel partnerships for maximum market penetration.
- Energy & Utilities Companies : Assess VFD adoption trends across Indonesia's power generation and distribution networks to optimize grid efficiency, reduce losses, and support renewable energy integration initiatives.
- Industrial Facility Operators : Evaluate VFD investment opportunities to reduce energy consumption, lower operational costs, and meet Indonesia's environmental compliance requirements while improving production efficiency.
- Investment & Consulting Firms : Access comprehensive Indonesia market data for due diligence, portfolio analysis, and strategic recommendations on clean energy technology investments and industrial modernization opportunities.
Key Companies in the Indonesia Clean Power VFD Market
| Company | HQ | Ownership | Strongest segments |
|---|---|---|---|
| ABB | India | Public Company | Low-voltage VFDs,Medium-voltage VFDs,Micro and low-power drives, |
| SCHNEIDER ELECTRIC | Canada | Public Company | Low-voltage VFDs for buildings and light industry,Low-voltage VFDs for industrial facilities and OEMs,Medium-voltage VFDs for utilities, oil & gas, and mining, |
| DANFOSS | Denmark | Private Company | Low-voltage drives (incl. decentral, enclosed, filters/braking),Medium-voltage drives,Motion control and servo drives, |
| NIDEC CORPORATION | Japan | Public Company | Low-voltage VFDs,Medium-voltage VFDs,Micro power drives, |
| EATON | Ireland | Public Company | Low-voltage clean power VFDs,Medium-voltage clean power VFDs,Micro and low power drives (sub-kW to small HP), |
| ROCKWELL AUTOMATION | United States | Public Company | Low-voltage clean power VFDs,Medium-voltage clean power VFDs,Micro and low-power drives, |
| GE VERNOVA | United States | Public Company | Low Voltage VFDs,Medium Voltage VFDs,Micro Power Drives, |
| PARKER HANNIFIN CORP | United States | Public Company | Low Voltage VFDs,Medium Voltage VFDs,Micro Power Drives, |
| FUJI ELECTRIC CO., LTD. | Japan | Public Company | Low-voltage VFDs (all power ratings),Medium-voltage VFDs,Micro and low-power drives, |
| CG POWER & INDUSTRIAL SOLUTIONS LTD. | India | Public Company | Low-voltage VFDs (low power and micro power drives),Medium-voltage VFDs (medium and high power drives),Drives for transportation and rail applications, |
| WEG | Brazil | Public Company | Low Voltage VFDs,Medium Voltage VFDs,Micro Power Drives, |
| YASKAWA ELECTRIC CORPORATION | Japan | Public Company | Low-voltage VFDs (all power ratings),Medium-voltage VFDs,Regenerative / energy-saving units and systems, |
| LS ELECTRIC CO., LTD. | South Korea | Public Company | Low Voltage VFDs,Medium Voltage VFDs,Micro Power Drives, |
| DELTA ELECTRONICS, INC. | Taiwan | Public Company | Low Voltage VFDs,Medium Voltage VFDs,Micro Power Drives, |
ABB
ABB is a public company founded in 1883 and headquartered in India, employing 111,900 people. The company operates as a global industrial technology leader.
SCHNEIDER ELECTRIC
Schneider Electric is a public company founded in 1836 and based in Canada, with 158,122 employees. The company is a major player in energy management and automation solutions.
DANFOSS
Danfoss is a private company founded in 1933 and headquartered in Denmark, employing 39,360 people. The company specializes in engineering solutions for heating, cooling, and motor control.
NIDEC CORPORATION
Nidec Corporation is a public company founded in 1973 and based in Japan, with 104,285 employees. The company is a leading manufacturer of electric motors and related components.
EATON
Eaton is a public company founded in 1911 and based in Ireland, employing 97,303 people. The company provides diversified industrial manufacturing and electrical solutions.
ROCKWELL AUTOMATION
Rockwell Automation is a public company founded in 1903 and headquartered in the United States, with 26,000 employees. The company specializes in industrial automation and digital transformation.
GE VERNOVA
GE Vernova is a public company founded in 2023 and based in the United States, employing 78,000 people. The company focuses on energy and industrial solutions.
PARKER HANNIFIN CORP
Parker Hannifin Corp is a public company founded in 1917 and headquartered in the United States, with 57,950 employees. The company manufactures motion and control technologies for industrial applications.
FUJI ELECTRIC CO., LTD.
Fuji Electric Co., Ltd. is a public company founded in 1923 and based in Japan, employing 26,955 people. The company provides electrical equipment and industrial solutions.
CG POWER & INDUSTRIAL SOLUTIONS LTD.
CG Power & Industrial Solutions Ltd. is a public company founded in 1878 and headquartered in India, with 3,113 employees. The company manufactures electrical equipment and power solutions.
WEG
WEG is a public company founded in 1961 and based in Brazil, employing 49,258 people. The company is a leading manufacturer of electric motors and related equipment.
YASKAWA ELECTRIC CORPORATION
Yaskawa Electric Corporation is a public company founded in 1915 and headquartered in Japan, with 12,483 employees. The company specializes in robotics, motion control, and industrial automation.
LS ELECTRIC CO., LTD.
LS Electric Co., Ltd. is a public company founded in 1974 and based in South Korea, with 3,267 employees. The company manufactures electrical equipment and industrial solutions.
DELTA ELECTRONICS, INC.
Delta Electronics, Inc. is a public company founded in 1971 and headquartered in Taiwan, employing 85,684 people. The company is a leading provider of power management and thermal management solutions.
Reasons to Buy this Report
- Market-Specific Growth Data : Access detailed Indonesia market valuation (USD 20.6M in 2025) and 5-year forecasts with country-specific CAGR analysis to inform investment and expansion strategies in Southeast Asia's largest economy.
- Competitive Landscape Intelligence : Understand Indonesia's unique VFD market dynamics, local competitor positioning, and market share distribution to identify partnership opportunities and competitive advantages in this high-growth emerging market.
- Sector-Specific Demand Drivers : Gain insights into Indonesia's industrial sectors driving VFD adoption—manufacturing, mining, renewable energy—with actionable data on sector-specific growth rates and investment priorities.
- Regulatory & Policy Framework : Analyze Indonesia's clean energy policies, energy efficiency mandates, and government incentives shaping VFD market demand, enabling compliant and strategic market entry planning.
- Investment & Expansion Strategy : Leverage Indonesia-focused market forecasts and growth projections to develop targeted go-to-market strategies, resource allocation plans, and ROI assessments for regional operations.
Frequently asked questions
What is the current market size of Clean Power VFD in Indonesia?
Indonesia's Clean Power VFD market is valued at USD 20.6 million in 2025 and is expected to grow to USD 27.5 million by 2030.
What is the projected growth rate for Indonesia's Clean Power VFD market?
Indonesia's Clean Power VFD market is projected to grow at a compound annual growth rate (CAGR) of 6.0% from 2025 to 2030.
Which industries in Indonesia are driving Clean Power VFD adoption?
Indonesia's manufacturing, mining, and renewable energy sectors are primary drivers of Clean Power VFD adoption, seeking to improve energy efficiency and reduce operational costs.
What factors are supporting market growth in Indonesia?
Indonesia's market growth is supported by rising electricity demand, government renewable energy targets, smart grid infrastructure investments, and industrial efficiency initiatives.
How much will Indonesia's Clean Power VFD market grow by 2030?
Indonesia's Clean Power VFD market is expected to grow by USD 6.9 million from 2025 to 2030, representing a 33.5% increase over the five-year forecast period.
RESEARCH METHODOLOGY
The study involved major activities in estimating the current size of the clean power VFD market. Exhaustive secondary research was done to collect information on the peer and parent markets. The next step was to validate these findings, assumptions, and sizing with industry experts across the value chain through primary research. Both top-down and bottom-up approaches were employed to estimate the complete market size. Thereafter, market breakdown and data triangulation were used to estimate the market size of the segments and subsegments.
Secondary Research
This research study on the clean power VFD market involved the use of extensive secondary sources, directories, and databases, such as Hoovers, Bloomberg, Businessweek, Factiva, International Energy Agency, and BP Statistical Review of World Energy, to identify and collect valuable information for a technical, market-oriented, and commercial study of the global clean power VFD market. The other secondary sources included annual reports, press releases, and investor presentations of companies, white papers, certified publications, articles by recognized authors, manufacturer associations, trade directories, and databases.
Primary Research
The clean power VFD market comprises stakeholders such as clean power VFD manufacturers, technology providers, and support providers in the supply chain. On the demand side, the market is driven by growing adoption of clean power VFD in various sectors, including data centers, renewable energy, industrial, and commercial applications, due to their high energy efficiency, compact design, and superior performance compared to conventional motor control systems. Rising infrastructure development and urbanization in emerging economies further fuel demand for advanced drive solutions. On the supply side, manufacturers are witnessing increasing opportunities through contracts from utility and industrial distribution networks, as well as strategic initiatives such as mergers, acquisitions, and partnerships among major players to expand their market presence and technological capabilities. Various primary sources from both the supply and demand sides of the market were interviewed to obtain qualitative and quantitative information. The following is the breakdown of primary respondents:
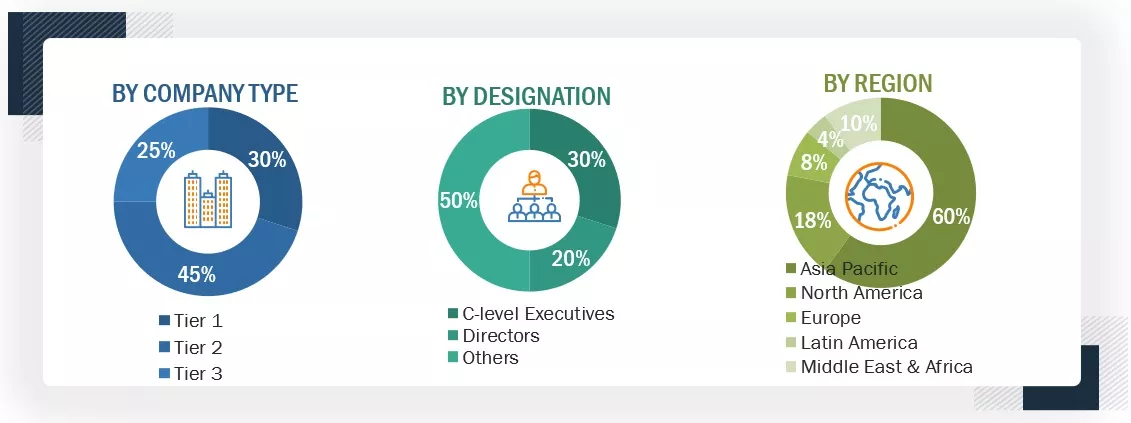
Note: "Others" include sales managers, engineers, and regional managers
The tiers of the companies are defined based on their total revenue as of 2024: Tier 1: >USD 1 billion, Tier 2: USD 500 million–1 billion, and Tier 3:
To know about the assumptions considered for the study, download the pdf brochure
Market Size Estimation
Both the top-down and bottom-up approaches were employed to estimate and validate the size of the clean power VFD market, as well as its dependent submarkets. The key players in the market were identified through secondary research, and their market share in the respective regions was determined through a combination of primary and secondary research. The research methodology involves analyzing the annual and financial reports of top market players and conducting interviews with industry experts, including chief executive officers, vice presidents, directors, sales managers, and marketing executives, to gather key quantitative and qualitative insights related to the clean power VFD market.
Clean Power VFD Market : Top-Down and Bottom-Up Approach

Data Triangulation
After determining the overall market size through the estimation process explained above, the total market has been divided into several segments and subsegments. To complete the overall market engineering process and obtain the exact statistics for all segments and subsegments, data triangulation and market breakdown processes have been employed, where applicable. The data has been triangulated by studying various factors and trends from both the demand and supply sides. Additionally, the market has been validated using both top-down and bottom-up approaches.
Market Definition
A clean power variable frequency drive (VFD) is an advanced electronic component that simplifies complex motor control systems, making them more affordable and efficient. It is a sophisticated controller, typically housed within compact enclosures, designed for precise high-performance power distribution to AC motors. The clean power VFD system utilizes wide-bandgap semiconductor technology, such as silicon carbide (SiC) or gallium nitride (GaN), and integrated circuitry to ensure a low-distortion output. It allows for seamless speed and torque adjustments throughout the motor's operating range, rather than relying on fixed-speed settings. A clean power VFD is an electrical junction that collects power from the supply and distributes it to the motor with minimal harmonic distortion. The main purpose of a clean power VFD is to regulate motor performance and enhance energy efficiency. It is used to make the systems more reliable and sustainable. They can be an excellent solution for complicated industrial applications.
Stakeholders
- Government & research organizations
- Institutional investors
- Investors/Shareholders
- Environmental research institutes
- Manufacturers' associations
- Clean power VFD manufacturers, dealers, and suppliers
- Organizations, forums, alliances, and associations
- Renewable power generation and equipment manufacturing companies
- Process industries and power and energy associations
- Public and private operators of power plants
- State and national regulatory authorities
- Venture capital firms
Report Objectives
- To describe and forecast the clean power VFD market, by voltage, power rating, application, end user, and region, in terms of value.
- To describe and forecast the clean power VFD market for various segments with respect to five main regions: North America, Europe, Asia Pacific, Latin America, and the Middle East & Africa, in terms of value
- To describe and forecast the clean power VFD market, by region, in terms of volume
- To provide detailed information regarding drivers, restraints, opportunities, and challenges influencing the growth of the market
- To provide a detailed overview of the clean power VFD supply chain analysis, use case analysis, key stakeholders and buying criteria, patent analysis, trade analysis, tariff analysis, regulations, macroeconomic outlook, pricing analysis, Porter's five forces analysis, impact of gen AI/AI, and the 2024 US tariff impact
- To strategically analyze micromarkets1 with respect to individual growth trends, prospects, and contributions to the total market
- To analyze opportunities in the market for various stakeholders by identifying high-growth segments
- To strategically profile key players and comprehensively analyze their market position in terms of ranking and core competencies2, along with detailing the market's competitive landscape.
- To analyze growth strategies, such as acquisitions, investments, expansions, and product launches, adopted by market players in the clean power VFD market
1 Micromarkets are defined as the segments and subsegments of the clean power VFD market included in the report.
2 Core competencies of companies are defined in terms of key developments and strategies adopted to sustain their positions in the clean power VFD market.
Available Customizations
MarketsandMarkets offers customizations according to the specific needs of the companies with the given market data.
The following customization options are available for the report:
Product Analysis
- Product matrix, which gives a detailed comparison of the product portfolio of each company
Geographic Analysis as per Feasibility
- Further breakdown of the clean power VFD, by country
Company Information
- Detailed analysis and profiling of additional market players (up to five)
Get the Full Clean Power VFD Market Report
Full forecast, segment splits, and company analysis for all Clean Power VFD Market.
- China Clean Power VFD Market
- India Clean Power VFD Market
- Japan Clean Power VFD Market
- South Korea Clean Power VFD Market
- Australia Clean Power VFD Market
- US Clean Power VFD Market
- Canada Clean Power VFD Market
- Germany Clean Power VFD Market
- UK Clean Power VFD Market
- Italy Clean Power VFD Market
- France Clean Power VFD Market
- Russia Clean Power VFD Market
- Spain Clean Power VFD Market
- Brazil Clean Power VFD Market
- Argentina Clean Power VFD Market
- Mexico Clean Power VFD Market
- Chile Clean Power VFD Market
- Saudi Arabia Clean Power VFD Market
- UAE Clean Power VFD Market
- South Africa Clean Power VFD Market
- Nigeria Clean Power VFD Market
- Rest Of GCC Clean Power VFD Market
Need a Tailored Report?
Customize this report to your needs
Get 10% FREE Customization
Customize This Report
