
Asia Pacific Data Center Busbar Market (2026-2031)

The Asia Pacific Data Center Busbar Market was valued at $359.6 Million in 2026 and projected to reach to $896.6 Million by 2031, representing a compound annual growth rate of 16.4%. Asia Pacific's data center busbar market is positioned for exceptional growth through 2031, driven by the region's transformation into a critical global technology infrastructure hub.


| Market Size in | USD 26.32 MN |
| Market Forecast in | |
| CAGR | |
| Forecast Period | |
| Units Considered | Value (USD MN) |
Asia Pacific Data Center Busbar Market Trends and Insights
- This represents a compound annual growth rate of 16.4%, significantly outpacing global trends driven by rapid digital infrastructure investment across the region.
- Asia Pacific's strategic position as a global technology hub, combined with increasing cloud adoption and hyperscale data center deployments, is fueling demand for efficient power distribution solutions. The region's growth trajectory reflects accelerating data center construction and modernization initiatives in key markets including China, India, Japan, and Southeast Asia.
- Asia Pacific enterprises are prioritizing advanced busbar systems to enhance operational efficiency, reduce energy losses, and support higher power densities required by emerging technologies.
- Between 2026 and 2031, Asia Pacific is expected to capture an increasingly larger share of global busbar demand, driven by rising data consumption, AI infrastructure buildouts, and regulatory mandates for energy-efficient data center operations. Investment in Asia Pacific's digital economy continues to attract major technology providers and infrastructure operators, creating sustained demand for innovative busbar solutions tailored to the region's unique operational and climatic requirements..
Key Market Statistics
- CAGR (2026-2031) 16.4% CAGR
- Market Size, 2026 ~USD 359.6 Million
- Forecast, 2031 ~USD 896.6 Million
- Geography Asia Pacific
Asia Pacific Data Center Busbar Market Overview
Exceptional Growth Trajectory :
Asia Pacific's data center busbar market is expanding at 16.4% CAGR, significantly outpacing the global rate of 14%, driven by massive digital infrastructure investments across the region's emerging economies.
China's Market Dominance :
China leads the Asia Pacific region with USD 506.6 million in market size, representing over 140% of the regional 2026 valuation, reflecting its position as a global data center powerhouse and cloud computing hub.
Rapid Valuation Expansion :
The market is projected to nearly triple from USD 359.6 million in 2026 to USD 896.6 million by 2031, demonstrating accelerating demand for advanced power distribution solutions in data centers across Asia Pacific.
Strategic Technology Hub Status :
Asia Pacific's emergence as a global technology epicenter, combined with increasing 5G deployment, AI infrastructure buildout, and cloud service expansion, is fueling unprecedented busbar system demand.
Asia Pacific Data Center Busbar Market Dynamics
- Countries like China, Japan, Australia, and India are investing heavily in data center capacity to support cloud computing, artificial intelligence, and edge computing initiatives.
- The 16.4% CAGR reflects sustained demand for efficient power distribution solutions as enterprises and hyperscalers expand their digital footprints across the region. Key growth catalysts include rapid 5G network rollout, increasing data localization requirements, and substantial government investments in digital infrastructure.
- The competitive landscape is intensifying as major technology companies establish regional data center operations.
- Market participants should prioritize understanding country-specific regulatory frameworks, power infrastructure capabilities, and local partnership opportunities to capitalize on this high-growth market segment..
Market Ecosystem

DATA CENTER BUSBAR MARKET: COMMERCIAL USE CASES ACROSS INDUSTRIES
| COMPANY | USE CASE DESCRIPTION | BENEFITS |
|---|---|---|
 |
Uses copper or aluminum busbars within switchgear and power distribution equipment serving data centers, including low- and medium-voltage switchgear and distribution assemblies. ABB’s data center electrical portfolio includes switchgear with high-current busbar configurations for mission-critical power distribution. | Enables high-current power distribution | Supports reliable and redundant electrical architectures | Provides high short-circuit withstand capability | Supports compact and space-efficient distribution equipment |
 |
Integrates busbar conductors into electrical power distribution equipment and data center power-distribution architectures, where busbars provide internal current paths between incoming power, protection devices, and outgoing circuits. | Supports high-current electrical distribution | Reduces wiring complexity within equipment | Improves space utilization | Enables organized and reliable power connections |
 |
Uses busbars in switchboards, switchgear, power distribution units, and other electrical installations that supply data centers. Busbar arrangement forms the electrical paths for power distribution from feeders to the circuits. | Enhances power distribution with large capacity | Achieves compact equipment | Provides reliable electrical supply | Enables scalable distribution networks in data centers. |
 |
Uses copper and aluminum busbar conductors within switchboards, panelboards, power distribution equipment, and data center electrical systems. Its data center power-distribution portfolio incorporates busbar-based architectures for distributing power to critical IT loads. | Provides efficient high-current conduction | Reduces cable requirements and equipment footprint | Enables flexible power distribution | Supports modular expansion and high-density data center applications |
 |
Incorporates busbar conductors into power distribution and electrical infrastructure used in data centers, including power distribution equipment serving high-density IT loads. Copper and aluminum busbar configurations can be used to provide high-current pathways within distribution assemblies. | Supports high-density power distribution | Provides efficient current conduction | Reduces connection complexity | Enables compact and reliable electrical equipment designs |
Logos and trademarks shown above are the property of their respective owners. Their use here is for informational and illustrative purposes only.
Related Ecosystem
Key Takeaways
- Asia Pacific's data center busbar market will grow from USD 359.6 million (2026) to USD 896.6 million (2031) at a 16.4% CAGR, outpacing global growth rates.
- Hyperscale data center expansion and cloud infrastructure investments across Asia Pacific are primary drivers of busbar system demand through 2031.
- Asia Pacific's emerging markets, particularly China and India, represent high-growth opportunities for advanced power distribution and energy-efficient busbar solutions.
- Regulatory focus on data center energy efficiency and sustainability in Asia Pacific is accelerating adoption of next-generation busbar technologies between 2026 and 2031.
Data Center Busbar Market Report Scope
| Report Metric | Details |
|---|---|
| Base Year | 2026 |
| Fastest Growing Segment | DC (Power Source) |
| Forecast Period | 2026-2031 |
| Growth Rate | CAGR of 14% from 2026 to 2031 |
| Largest Segment | AC (Power Source) |
| Market Size Base Year (Billions) | ~USD 1.37 (2026) |
| Revenue Forecast (Billions) | ~USD 2.64 (2031) |
| Segments Covered | Conductor Type, Space Type, Power Ampacity, It Load, Power Source, Data Center Type |
Asia Pacific Data Center Busbar Market Report Segmentation
6 segment dimensions are covered across the global market.
By Conductor Type
- Aluminum & Hybrid
- Copper
By Space Type
- Gray
- White
By Power Ampacity
- High Ampacity
- Low Ampacity
- Medium Ampacity
By It Load
- AI
- Non-AI
By Power Source
- Ac
- Dc
By Data Center Type
- Colocation
- Enterprise
- Hyperscale
Target Audience
- Data Center Operators & Hyperscalers : Regional data center operators and hyperscalers expanding infrastructure across Asia Pacific need market intelligence to optimize busbar system procurement, evaluate suppliers, and plan capacity investments.
- Electrical Equipment Manufacturers : Busbar system manufacturers and electrical equipment suppliers require detailed Asia Pacific market data to identify growth opportunities, assess regional demand, and develop localized product strategies.
- Infrastructure Investment Firms : Private equity and infrastructure investors evaluating data center opportunities in Asia Pacific need comprehensive market sizing and growth forecasts to support investment thesis development and valuation.
- System Integrators & Consultants : Engineering firms and system integrators serving Asia Pacific data centers require regional market insights to advise clients on technology selection, vendor evaluation, and infrastructure planning.
- Government & Policy Makers : Regional government agencies and policy makers developing digital infrastructure strategies need market data to inform investment priorities, regulatory frameworks, and technology adoption initiatives.
Countries within Asia Pacific - compare and drill down
| Country | 2025 size (native) |
|---|---|
| China | USD 506.6 Million |
| Japan | USD 79.2 Million |
| India | USD 59.1 Million |
| Australia | USD 95.6 Million |
| Rest Of Asia Pacific | USD 156.2 Million |
Country market size visualization
Reasons to Buy this Report
- Regional Market Segmentation : Gain detailed insights into country-level market dynamics across China, Japan, India, Australia, and emerging markets within Asia Pacific, enabling targeted investment and expansion strategies.
- Competitive Landscape Intelligence : Understand regional competitive positioning, local player strategies, and market consolidation trends specific to Asia Pacific's rapidly evolving data center busbar sector.
- Growth Opportunity Identification : Identify high-potential sub-markets and emerging opportunities within Asia Pacific where 16.4% CAGR growth is concentrated, supporting strategic resource allocation decisions.
- Regulatory & Infrastructure Insights : Access country-specific regulatory frameworks, power infrastructure capabilities, and government initiatives shaping data center development across the Asia Pacific region.
- Demand Forecasting Accuracy : Leverage region-specific demand projections through 2031 to optimize supply chain planning, manufacturing capacity, and distribution network development in Asia Pacific markets.
Frequently asked questions
What is the projected market size for data center busbars in Asia Pacific by 2031?
Asia Pacific's data center busbar market is projected to reach USD 896.6 million by 2031, up from USD 359.6 million in 2026, representing a 16.4% CAGR.
Which countries in Asia Pacific are driving data center busbar market growth?
China, India, Japan, and Southeast Asian nations are leading growth in Asia Pacific's data center busbar market, driven by cloud adoption, AI infrastructure, and hyperscale data center investments.
Why is Asia Pacific's data center busbar market growing faster than the global average?
Asia Pacific's 16.4% CAGR exceeds the global 14% CAGR due to rapid digital transformation, increasing data consumption, hyperscale facility expansion, and regulatory mandates for energy efficiency across the region.
What factors are influencing busbar adoption in Asia Pacific data centers?
Key factors include rising power density requirements, energy efficiency regulations, cloud service provider expansion, AI and machine learning infrastructure buildouts, and the need for reliable power distribution in mission-critical facilities.
How does Asia Pacific's busbar market compare to other global regions?
Asia Pacific is experiencing the strongest growth trajectory with a 16.4% CAGR through 2031, positioning it as a critical market for busbar manufacturers and reflecting the region's dominance in global data center infrastructure investment.
RESEARCH METHODOLOGY
The study involved four major activities in estimating the current size of the data center busbar market. Exhaustive secondary research was conducted to gather information on the market, peer markets, and the parent market. The next step was to validate these findings, assumptions, and sizing with industry experts across the data center busbars value chain through primary research. Both top-down and bottom-up approaches were employed to estimate the complete market size. Thereafter, market breakdown and data triangulation were used to estimate the market size of segments and subsegments.
Secondary Research
Secondary sources for this research study include annual reports, press releases, and investor presentations of companies; white papers; certified publications; articles by recognized authors; gold- and silver-standard websites; data center busbar manufacturing companies; regulatory bodies; trade directories; and databases. Secondary research was mainly used to obtain key information on the industry’s supply chain, the total pool of key players, market classification, and segmentation by industry trends down to the most granular level and by region. It has also been used to obtain information about key developments from a market-oriented perspective.
Primary Research
The data center busbar market comprises several stakeholders, such as raw material suppliers, technology support providers, data center busbar manufacturers, and regulatory organizations in the supply chain. Various primary sources from both the supply and demand sides of the market were interviewed to obtain qualitative and quantitative information. Primary sources from the supply side included industry experts such as chief executive officers (CEOs), vice presidents, marketing directors, technology and innovation directors, and related key executives from various key companies and organizations operating in the data center busbar market. Primary sources from the demand side included directors, marketing heads, and purchase managers from various sourcing industries. The following is the breakdown of the primary respondents:
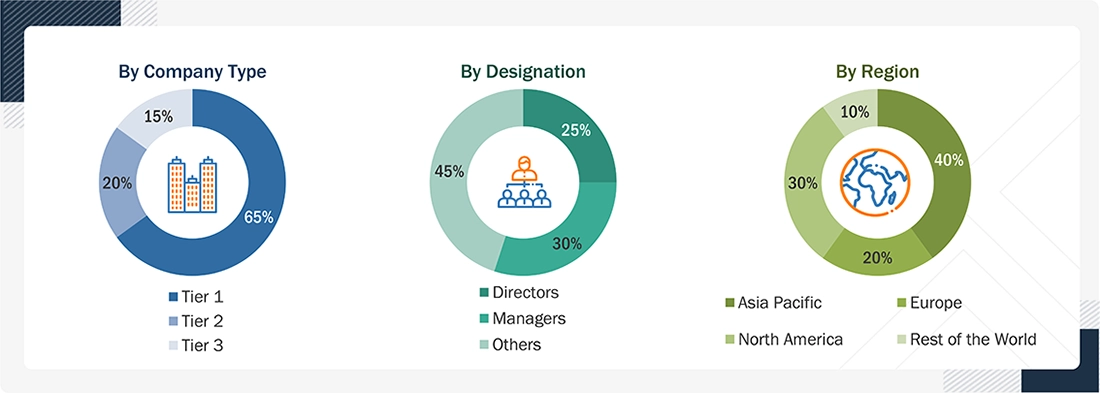
To know about the assumptions considered for the study, download the pdf brochure
Market Size Estimation
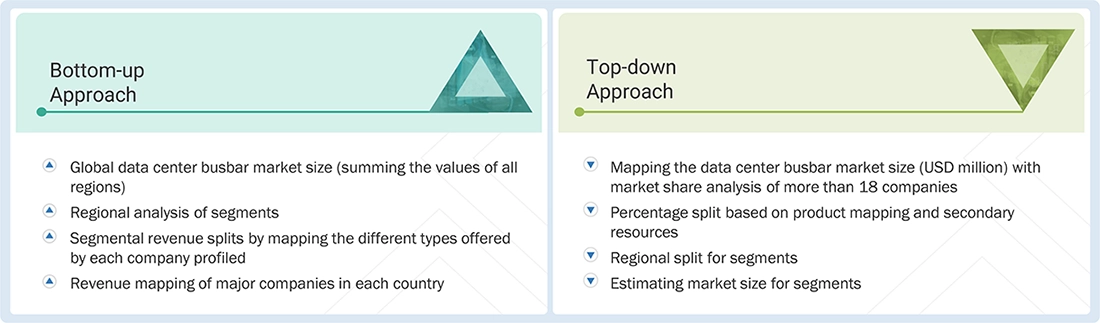
The top-down and bottom-up approaches have been employed to estimate and validate the total size of the data center busbar market. These approaches have also been used extensively to estimate the size of various dependent market subsegments. The research methodology used to estimate the market size included the following:
The following segments provide details about the overall market size estimation process employed in this study:
- Extensive primary and secondary research was done to identify the key players.
- The value chain and market size of the data center busbar market, in terms of value and volume, were determined through primary and secondary research.
- All percentage shares, splits, and breakdowns were collected through secondary sources and verified through primary sources.
- All possible parameters that affect the market were covered in this research study and are viewed in extensive detail, verified through primary research, and analyzed to obtain the final quantitative and qualitative data.
- The study of reports, reviews, and newsletters of top market players, along with extensive interviews for opinions from key leaders, such as CEOs, directors, and marketing executives, is included in this research.
Data Triangulation
After arriving at the overall market size using the market size estimation processes as explained above, the market was split into several segments and subsegments. To complete the overall market engineering process and arrive at the exact statistics of each market segment and subsegment, the data triangulation and market breakdown procedures were employed, wherever applicable. The data was triangulated by studying various factors and trends from both the demand and supply sides.
Market Definition
The data center busbar market comprises busbar-based electrical power distribution systems specifically designed and deployed within data centers to distribute power from upstream equipment such as transformers, switchgear, UPS systems, and power distribution units to IT loads and other facility equipment. These systems primarily use copper or aluminum conductors enclosed within insulated and protective assemblies and may include busbar sections, joints, connectors, and tap-off units. Data center busbars provide compact, modular, scalable, and flexible power distribution, enabling efficient connection of high-density racks and easier capacity expansion compared with conventional cable-based distribution. IEC 61439-6 provides the international framework for busbar trunking systems, covering assemblies incorporating busbars for electrical power distribution.
Key Stakeholders
- Data center busbar manufacturers, processors, and others
- Research institutions, standards organizations, and regulatory agencies such as ASTM, ISO, and others
- NGOs, governments, investment banks, venture capitalists, and private equity firms
Report Objectives
- To define, describe, and forecast the market size of data center busbars in terms of value and volume
- To provide detailed information regarding the key factors, such as drivers, restraints, opportunities, and industry-specific challenges, influencing the growth of the data center busbar market
- To analyze and forecast the global data center busbar market based on IT load, data center type, conductor type, space type, power ampacity, power source, and region
- To analyze the opportunities in the market for stakeholders and provide details of the competitive landscape for market leaders
- To forecast the size of various market segments based on four major regions: North America, Asia Pacific, Europe, and the Rest of the World, along with their respective key countries
- To track and analyze the competitive developments, such as product launches, expansions, and other developments in the market
- To strategically profile the key players and comprehensively analyze their market shares and core competencies
Available customizations:
With the given market data, MarketsandMarkets offers customizations according to the client-specific needs.
The following customization options are available for the report:
- Additional country-level analysis of the data center busbar market
- Profiling of additional market players (up to 5)
Product Analysis
- Product matrix, which provides a detailed comparison of each company's product portfolio.
Get the Full Data Center Busbar Market Report
Full forecast, segment splits, and company analysis for all Data Center Busbar Market.
- China Data Center Busbar Market
- Australia Data Center Busbar Market
- Japan Data Center Busbar Market
- India Data Center Busbar Market
- Germany Data Center Busbar Market
- UK Data Center Busbar Market
- France Data Center Busbar Market
- Netherlands Data Center Busbar Market
- Canada Data Center Busbar Market
- US Data Center Busbar Market
- Rest Of Europe Data Center Busbar Market
- Rest Of Asia Pacific Data Center Busbar Market
Need a Tailored Report?
Customize this report to your needs
Get 10% FREE Customization
Customize This Report
