
Asia Pacific Digital Radiography Market (2024-2029)

The Asia Pacific Digital Radiography Market was valued at $848.3 Million in 2024 and projected to reach to $1014.4 Million by 2029, representing a compound annual growth rate of 3.6%. The Asia Pacific digital radiography market is positioned for sustained growth through 2029, driven by substantial investments in healthcare infrastructure modernization across the region.


| Market Size in | USD 26.32 MN |
| Market Forecast in | |
| CAGR | |
| Forecast Period | |
| Units Considered | Value (USD MN) |
Asia Pacific Digital Radiography Market Trends and Insights
- Asia Pacific's market expansion is driven by increasing healthcare infrastructure investments, rising diagnostic imaging demand, and growing adoption of advanced medical technologies across the region.
- The 3.6% compound annual growth rate reflects Asia Pacific's commitment to modernizing healthcare delivery and improving diagnostic capabilities in both developed and emerging economies. Asia Pacific's digital radiography sector benefits from a large patient population, expanding middle-class demographics, and government initiatives to enhance healthcare accessibility.
- Between 2024 and 2029, Asia Pacific is expected to see accelerated adoption of digital radiography systems in hospitals, diagnostic centers, and clinics.
- Key markets within Asia Pacific, including China, India, Japan, and Southeast Asia, are investing heavily in healthcare digitalization, positioning the region as a critical growth engine for the global digital radiography market..
Key Market Statistics
- CAGR (2024-2029) 3.6% CAGR
- Market Size, 2024 ~USD 848.3 Million
- Forecast, 2029 ~USD 1014.4 Million
- Geography Asia Pacific
Asia Pacific Digital Radiography Market Overview
Market Valuation & Growth :
Asia Pacific digital radiography market valued at USD 848.3 million in 2024, expanding at 3.6% CAGR to reach USD 1,014.4 million by 2029, outpacing the global growth rate of 3.5%.
Healthcare Infrastructure Investment :
Rapid expansion of healthcare facilities and diagnostic centers across Asia Pacific nations, particularly in emerging economies, driving demand for advanced digital radiography systems and modernization of existing imaging departments.
Rising Diagnostic Imaging Demand :
Increasing prevalence of chronic diseases, aging populations, and growing awareness of early disease detection in Asia Pacific countries fueling adoption of digital radiography technologies in hospitals and clinics.
Technology Adoption Acceleration :
Growing adoption of advanced medical imaging technologies, including AI-integrated radiography systems and portable digital solutions, across Asia Pacific healthcare providers seeking improved diagnostic accuracy and operational efficiency.
Asia Pacific Digital Radiography Market Dynamics
- Countries like China, Japan, and India are leading adoption of advanced imaging technologies, supported by government healthcare initiatives and increasing private sector participation.
- The region's expanding middle class and rising healthcare expenditure create favorable conditions for market expansion. Key growth catalysts include the integration of artificial intelligence in radiography systems, increasing prevalence of chronic diseases, and the shift toward value-based healthcare delivery.
- Asia Pacific's competitive advantage lies in cost-effective manufacturing and growing local expertise in medical device development.
- Market players are focusing on localized solutions and partnerships with regional healthcare providers to capture emerging opportunities in this dynamic market..
Market Ecosystem
Related Ecosystem
Diagnostic Imaging
- Magnetic Resonance Imaging (MRI)
- Computed Tomography (CT)
- CT Scanners
- Nuclear Imaging
- Positron Emission Tomography
- Siemens healthineers
- PHILIPS HEALTHCARE
- CANON INC.
- FUJIFILM Holdings Corporation
- UNITED IMAGING HEALTHCARE CO., LTD.
Medical Devices
- Polymerase Chain Reaction (PCR)
- Magnetic Resonance Imaging (MRI)
- Disposable Autoinjectors
- Pulse Oximeters
- Blood Pressure Monitors
- Medtronic plc
- Abbott Laboratories
- Stryker Corporation
- Becton, Dickinson and Company
- CONMED Corporation
Key Takeaways
- Asia Pacific's digital radiography market is valued at USD 848.3 million in 2024 and will grow to USD 1,014.4 million by 2029, representing a 3.6% CAGR.
- Asia Pacific is experiencing rapid healthcare infrastructure modernization, with digital radiography adoption accelerating across hospitals and diagnostic centers.
- Large patient populations and expanding middle-class demographics in Asia Pacific are driving demand for advanced diagnostic imaging solutions.
- Government healthcare initiatives and digitalization programs across Asia Pacific are creating favorable conditions for sustained market growth through 2029.
Digital Radiography Market Report Scope
| Report Metric | Details |
|---|---|
| Base Year | 2024 |
| Fastest Growing Segment | CHEST IMAGING (Application) |
| Forecast Period | 2024-2029 |
| Growth Rate | CAGR of 3.5% from 2024 to 2029 |
| Largest Segment | FIXED DIGITAL RADIOGRAPHY SYSTEMS (Product) |
| Market Size Base Year (Billions) | ~USD 1.6 (2024) |
| Revenue Forecast (Billions) | ~USD 1.9 (2029) |
| Segments Covered | Product, Type, Application, End User |
Asia Pacific Digital Radiography Market Report Segmentation
4 segment dimensions are covered across the global market.
By Product
- Fixed Digital Radiography Systems
- Portable Digital Radiography Systems
By Type
- Ceiling-Mounted Systems
- Floor-To-Ceiling-Mounted Systems
- Handheld Systems
- Mobile Systems
- New Digital Systems
- Retrofit Digital Systems
By Application
- Cardiovascular Imaging
- Chest Imaging
- Orthopedic Imaging
- Other Applications
- Pediatric Imaging
By End User
- Diagnostic Imaging Centers
- Hospitals
- Orthopedic Clinics
- Other End Users
Target Audience
- Medical Device Manufacturers : Manufacturers of digital radiography systems and imaging equipment need Asia Pacific market data to identify expansion opportunities, assess competitive positioning, and develop region-specific product strategies.
- Healthcare Providers & Hospital Networks : Hospital administrators and healthcare facility operators require market insights to benchmark imaging technology investments, evaluate equipment procurement decisions, and plan capital expenditure across Asia Pacific locations.
- Investment & Private Equity Firms : Investors and PE firms evaluating healthcare technology opportunities in Asia Pacific need comprehensive market analysis to assess growth potential, identify acquisition targets, and make informed investment decisions.
- Healthcare Consultants & Advisors : Management consultants and healthcare advisors serving Asia Pacific clients require detailed market data to support strategic planning, feasibility studies, and market entry recommendations for imaging technology initiatives.
- Government & Healthcare Policy Bodies : Healthcare regulators and government agencies across Asia Pacific need market intelligence to inform healthcare infrastructure planning, technology adoption policies, and resource allocation for diagnostic imaging services.
Countries within Asia Pacific - compare and drill down
| Country | 2025 size (native) |
|---|---|
| China | USD 526.5 Million |
| Japan | USD 198.2 Million |
| India | USD 112.2 Million |
| South Korea | USD 75.1 Million |
| Australia | USD 58.4 Million |
| Rest Of Asia Pacific | USD 44 Million |
Country market size visualization
Reasons to Buy this Report
- Regional Market Insights : Gain detailed understanding of Asia Pacific digital radiography market dynamics, including country-specific growth patterns, competitive landscapes, and emerging opportunities across China, Japan, India, South Korea, and Australia.
- Strategic Investment Planning : Identify high-growth markets and investment hotspots within Asia Pacific with accurate market sizing, CAGR projections, and revenue forecasts through 2029 to guide capital allocation and expansion strategies.
- Competitive Positioning : Understand regional competitive dynamics, market consolidation trends, and key player strategies specific to Asia Pacific to develop effective market entry or expansion plans in this rapidly evolving region.
- Technology Adoption Trends : Access insights on adoption rates of advanced digital radiography technologies, AI integration, and portable imaging solutions across Asia Pacific healthcare systems to align product development with regional demand.
- Regulatory & Market Access : Navigate country-specific regulatory requirements, reimbursement policies, and healthcare infrastructure standards across Asia Pacific nations to optimize market entry strategies and compliance frameworks.
Frequently asked questions
What is the current size of the Asia Pacific digital radiography market?
The Asia Pacific digital radiography market was valued at USD 848.3 million in 2024 and is projected to reach USD 1,014.4 million by 2029.
What is the expected growth rate for Asia Pacific's digital radiography market?
Asia Pacific's digital radiography market is expected to grow at a compound annual growth rate (CAGR) of 3.6% from 2024 to 2029.
Which countries are driving growth in Asia Pacific's digital radiography market?
Key markets within Asia Pacific, including China, India, Japan, and Southeast Asian nations, are driving growth through healthcare infrastructure investments and digitalization initiatives.
What factors are contributing to digital radiography adoption in Asia Pacific?
Asia Pacific's digital radiography adoption is driven by increasing healthcare infrastructure investments, rising diagnostic imaging demand, large patient populations, and government healthcare modernization programs.
How does Asia Pacific's growth rate compare to the global digital radiography market?
Asia Pacific's 3.6% CAGR slightly exceeds the global digital radiography market's 3.5% CAGR, indicating the region's above-average growth trajectory.
RESEARCH METHODOLOGY
Four major activities were involved in the estimation of the current market size of digital radiography. Extensive secondary research was conducted to find data regarding the market, peer markets, and parent markets. Following that, obtained and verified data from about 3-5 secondary documents and different sources; the findings, assumptions, and sizing with industry experts from the total value chain were validated through primary research. Top-down and bottom-up approaches were used to estimate the complete market size. After that, the market size of segments and subsegments was estimated through market breakdown and data triangulation.
Secondary Research
The secondary research process shall make an extended use of the following sources: directories, databases such as Bloomberg Businessweek, Factiva, and D&B Hoovers; white papers; annual reports; company house documents; investor presentations; and SEC filings of companies. The information gathered from the secondary research was used in identifying and collecting data helpful in undertaking an in-depth technical, market-oriented, and commercial study of the digital radiography market. It was also used to derive crucial information of the key players and market classification & segmentation according to industry trends up to the bottom-most level, and key developments related to market and technology perspectives. A database of key industry leaders was also prepared using secondary research.
Primary Research
During the course of this primary research, various sources of supply and demand were consulted to obtain the qualitative and quantitative information required for this report. On the supply side, the primary sources include industry experts like CEOs, vice presidents, marketing and sales directors, technology and innovation directors, and related key executives from various key companies and organizations in the digital radiography market. Primary sources from the demand side include hospitals, orthopedic clinics, diagnostic centers, dental clinics, and other end users. Primary research was conducted to validate the market segmentation, identify key players, and get an idea about key industry trends & key market dynamics.
A breakdown of the primary respondents is provided below:
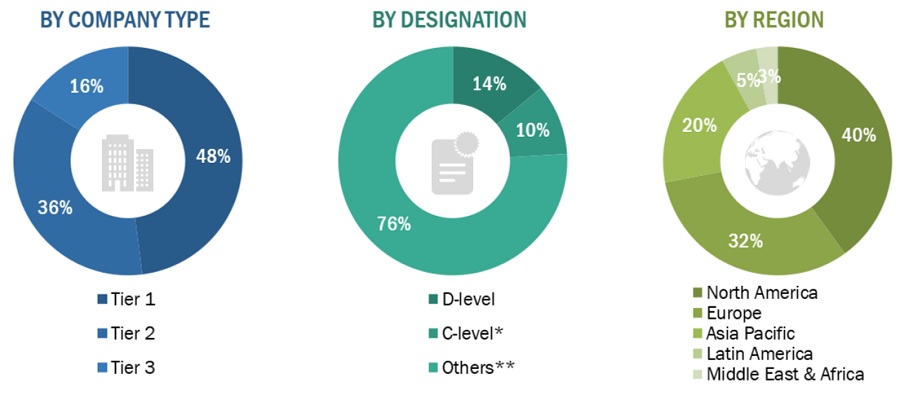
*Others include sales managers, marketing managers, business development managers, product managers, distributors, and suppliers.
The tiers of the companies are defined based on their total revenue. As of 2022: Tier 1 => USD 1.5 billion, Tier 2 = USD 200-500 million to USD 1 billion, and Tier 3 =< USD 500 million
To know about the assumptions considered for the study, download the pdf brochure
Market Estimation Methodology
In this report, revenue share analysis of leading players has been done to determine the size of the digital radiography market. Identified key players operating in the market have their revenue lined up through their market business. This insight is collected during the primary and secondary research phase. Secondary research includes the study of annual and financial reports of the top market players. On the other hand, primary research included in-depth interviews with key opinion leaders, viz., CEOs, directors, and key marketingexecutives.
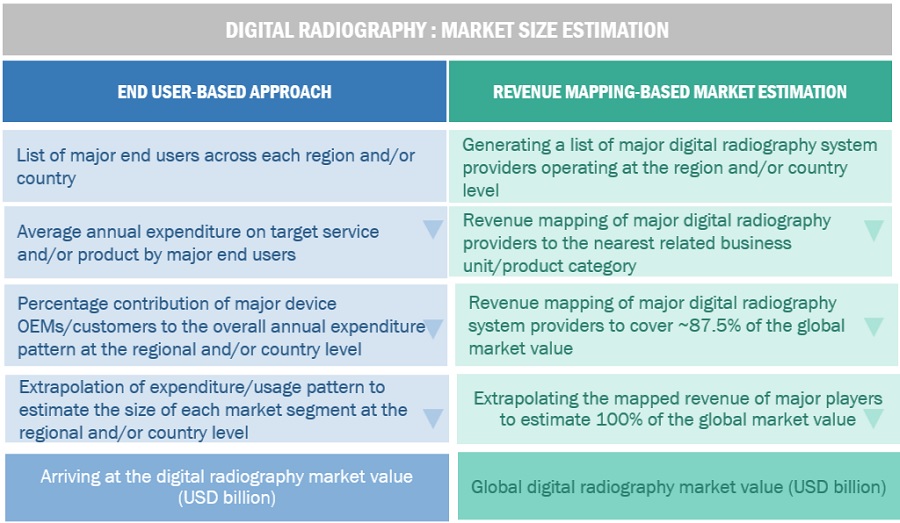
Segmental revenues were calculated based on the revenue mapping of major solution/service providers to calculate the global market value.
This process involved the following steps:
- A list of major players operating in the digital radiography market at the regional/country level
- Product mapping of various manufacturers for each type of digital radiography product at the regional/country level
- Mapping of annual revenue generated by listed major players from digital radiography products segments (or the nearest reported business unit/product category)
- Revenue mapping of major players to cover at least ~87.5% of the global market share as of 2023
- Extrapolation of the revenue mapping of the listed major players to derive the global market value of the respective segments/subsegments
- Summation of the market value of all segments/subsegments to arrive at the digital radiography marke
To know about the assumptions considered for the study, Request for Free Sample Report
Bottom-up approach
In this report, the size of the global digital radiography market was determined using the revenue share analysis of leading players. For this purpose, key players in the market were identified, and their revenues from the digital radiography business were determined through various insights gathered during the primary and secondary research phases. Secondary research included the study of the annual and financial reports of the top market players. In contrast, primary research included extensive interviews with key opinion leaders, such as CEOs, directors, and marketing executives.
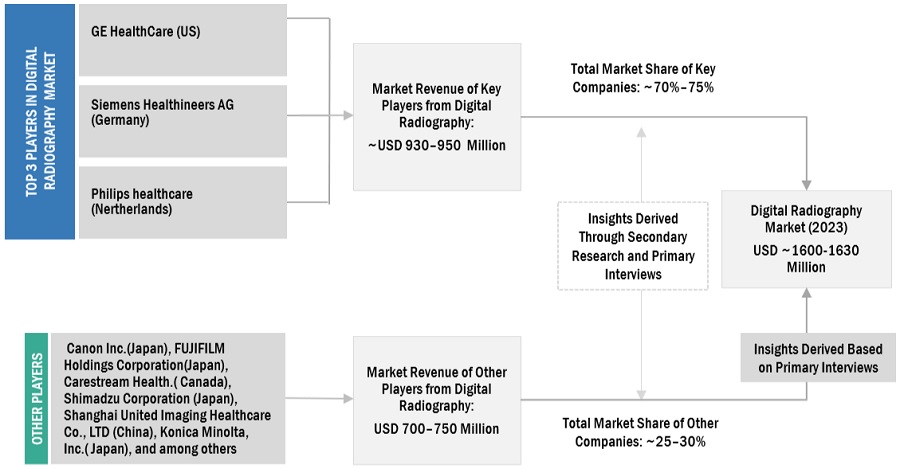
Approach 1: Company revenue estimation approach
To calculate the digital radiography market value, segmental revenues were calculated based on the revenue mapping of major solution/product providers. The steps involved in this process are as follows:
- A list of major global players operating in the digital radiography market had to be generated.
- Mapping of the annual revenues generated by major global players from the digital radiography segment or the nearest reported business unit/product category was done.
- Mapping the revenues of major players to at least cover 87.5% of the global market share as of 2022
- Extrapolation of the global value of the digital radiography industry
Market Size Estimation For Digital Radiography : Approach 1 (Company Revenue Estimation)I
Data Triangulation
The overall market size was arrived at after the market size estimation process described in the previous section. Further, the digital radiography market was segmented and subsegmented. The data triangulation and market breakdown procedures were conducted to complete the overall market engineering process and arrive at the exact statistics for all segments and subsegments. The data was triangulated by studying various factors and trends from both the demand and supply sides. Apart from this, the digital radiography market has also been validated using both top-down and bottom-up approaches.
Market Definition
The digital radiography market represents the global market for the development, production, distribution, and sales of radiographic imaging systems that capture images of internal body structures using digital detectors and processing technologies. These replace the old equipment that used film-based radiography to produce images of internal body structures. It caters to a broad spectrum of applications: medical diagnostics, dental imaging, veterinary care, and industrial non-destructive testing follow with the developments in imaging technology, rising adoption within healthcare facilities, and a raising trend toward more effective and accurate diagnostic procedures.
Key Stakeholders
- Digital radiography system product manufacturers
- Original equipment manufacturers (OEMs)
- Suppliers, distributors, and channel partners
- Healthcare service providers
- Hospitals and academic medical centers
- Radiologists
- Research laboratories
- Health insurance providers
- Government bodies/organizations
- Product distributors and channel partners
- Hospitals and imaging centers
- Orthopedic clinics
- Diagnostic imaging centers
- Radiologists and Technicians
- Regulatory agencies
- Quality control & assurance companies
Objectives of the Study
- To define, describe, and forecast the digital radiography market based on product, type, application, end user, and region
- To provide detailed information regarding the major factors influencing the growth of the market (drivers, restraints, opportunities, and challenges)
- To strategically analyze micro markets with respect to individual growth trends, prospects, and contributions to the total market
- To analyze opportunities in the market for stakeholders and provide details of the competitive landscape for market leaders
- To forecast the revenue of the market segments with respect to four regions, namely, North America, Europe, the Asia Pacific, Latin America, Middle East and Africa
- To profile the key players and comprehensively analyze their market ranking and core competencies
- To benchmark players within the market using a proprietary competitive leadership mapping framework, which analyzes market players on various parameters within the broad categories of market share and product footprint
Available Customizations
With the given market data, MarketsandMarkets offers customizations per the company’s specific needs. The following customization options are available for the present global digital radiography market report:
Product Analysis
- Product matrix, which gives a detailed comparison of the product portfolios of the top five companies
Company Information
- Detailed analysis and profiling of additional market players (up to five)
Geographic Analysis
- Further breakdown of the Rest of Europe digital radiography market into Russia, Belgium, the Netherlands, Switzerland, Austria, Finland, Sweden, Poland, and Portugal, among others
- Further breakdown of the Rest of Asia Pacific digital radiography market into Singapore, Taiwan, New Zealand, Philippines, Malaysia, and other APAC countries
- Further breakdown of the Rest of Latin America (RoLATAM), which comprises Argentina, Chile, Peru, Colombia, and Cuba
- Further breakdown of the RoW market into Latin America and MEA regions
Get the Full Digital Radiography Market Report
Full forecast, segment splits, and company analysis for all Digital Radiography Market.
- Rest Of Asia Pacific Digital Radiography Market
- Rest Of Latin America Digital Radiography Market
- Canada Digital Radiography Market
- US Digital Radiography Market
- Germany Digital Radiography Market
- UK Digital Radiography Market
- France Digital Radiography Market
- Italy Digital Radiography Market
- Spain Digital Radiography Market
- China Digital Radiography Market
- Japan Digital Radiography Market
- India Digital Radiography Market
- Australia Digital Radiography Market
- South Korea Digital Radiography Market
- Brazil Digital Radiography Market
- Mexico Digital Radiography Market
- Rest Of Europe Digital Radiography Market
Need a Tailored Report?
Customize this report to your needs
Get 10% FREE Customization
Customize This Report
