
Europe Education Smart Display Market (2024-2029)

The Europe Education Smart Display Market was valued at $1053.2 Million in 2024 and projected to reach to $1233.4 Million by 2029, representing a compound annual growth rate of 3.2%. Europe's Education Smart Display Market is positioned for steady expansion as educational institutions continue modernizing their learning environments.


| Market Size in | USD 26.32 MN |
| Market Forecast in | |
| CAGR | |
| Forecast Period | |
| Units Considered | Value (USD MN) |
Europe Education Smart Display Market Trends and Insights
- Europe represents a mature yet steadily growing market for educational display technologies, driven by increasing digital transformation initiatives across schools and universities.
- The region's emphasis on modernizing classroom infrastructure and adopting interactive learning solutions continues to support market expansion through the forecast period. In Europe, the education smart display sector benefits from strong regulatory support for EdTech adoption and substantial public and private investment in digital learning environments.
- Between 2024 and 2029, Europe is expected to see accelerated deployment of interactive displays in primary, secondary, and higher education institutions.
- The market's moderate growth trajectory reflects Europe's already-established digital education infrastructure, coupled with ongoing upgrades and replacements of legacy systems to meet contemporary pedagogical demands..
Key Market Statistics
- CAGR (2024-2029) 3.2% CAGR
- Market Size, 2024 ~USD 1053.2 Million
- Forecast, 2029 ~USD 1233.4 Million
- Geography Europe
Europe Education Smart Display Market Overview
Mature Market with Steady Growth :
Europe's Education Smart Display Market valued at USD 1,053.2 million in 2024, demonstrating a mature yet resilient market with consistent 3.2% CAGR through 2029, reflecting stable institutional investment in educational technology.
Digital Transformation Leadership :
European schools and universities are prioritizing digital transformation initiatives, with smart displays becoming essential infrastructure for hybrid learning environments and interactive classroom experiences across the region.
UK and Germany Drive Regional Growth :
UK (USD 406.9M) and Germany (USD 284.5M) lead European adoption, accounting for over 65% of the region's market value, supported by strong government education policies and technology integration mandates.
Forecast Growth to USD 1.23 Billion :
The European market is projected to reach USD 1,233.4 million by 2029, representing a USD 180.2 million increase, driven by modernization of educational infrastructure and increased EdTech spending across member states.
Europe Education Smart Display Market Dynamics
- The region's emphasis on digital literacy and hybrid learning models supports sustained demand for interactive display technologies.
- Government funding initiatives and EU digital education directives are accelerating adoption across primary, secondary, and higher education sectors. The 3.2% CAGR reflects Europe's mature market dynamics, where growth is driven by replacement cycles, classroom upgrades, and integration of advanced features like AI-powered interactivity and cloud connectivity.
- Western European markets remain dominant, while Central and Eastern European countries present emerging growth opportunities as education budgets expand and technology accessibility improves..
Market Ecosystem
Related Ecosystem
Display Technology
- Augmented Reality
- Liquid Crystal Display (LCD)
- Sensors
- Virtual Reality Devices
- Liquid Crystal on Silicon (LCOS)
- VIVITEK CORPORATION
- Samsung
- Lenovo
- Panasonic Holdings Corporation
- Lg corp
Digitalization And Iot
- Sensors
- Remote Monitoring
- Supply Chain Management
- Passenger Information System (PIS)
- Platform as A Service (PaaS)
- International Business Machines Corporation
- Cisco Systems, Inc.
- MICROSOFT CORPORATION
- Oracle Corporation
- HUAWEI TECHNOLOGIES CO LTD
Key Takeaways
- Europe's Education Smart Display Market is valued at USD 1,053.2 million in 2024 and will reach USD 1,233.4 million by 2029.
- Europe experiences a 3.2% CAGR, reflecting steady but moderate growth driven by digital classroom modernization.
- Europe benefits from strong regulatory frameworks and public investment supporting EdTech infrastructure development.
- Europe's mature market position indicates ongoing replacement cycles and upgrades rather than greenfield expansion.
Education Smart Display Market Report Scope
| Report Metric | Details |
|---|---|
| Base Year | 2024 |
| Fastest Growing Segment | OLEDS (Display Technology) |
| Forecast Period | 2024-2029 |
| Growth Rate | CAGR of 4% from 2024 to 2029 |
| Largest Segment | WHITEBOARDS (Product Type) |
| Market Size Base Year (Billions) | ~USD 3.37 (2024) |
| Revenue Forecast (Billions) | ~USD 4.1 (2029) |
| Segments Covered | Product Type, Display Size, Display Technology |
Europe Education Smart Display Market Report Segmentation
3 segment dimensions are covered across the global market.
By Product Type
- Video Walls
- Whiteboards
By Display Size
- Above 55"
- Up To 55"
By Display Technology
- Direct-View Leds
- Lcds
- Micro-Leds
- Oleds
- Other Display Technologies
Target Audience
- EdTech Hardware Manufacturers : Smart display and interactive panel manufacturers need Europe-specific market data to optimize product portfolios, identify regional demand patterns, and develop localized solutions for European educational standards.
- Education Technology Distributors : Regional and national distributors require detailed market sizing and growth forecasts for Europe to plan inventory, negotiate supplier agreements, and allocate resources across country markets effectively.
- School & University Administrators : Educational institution decision-makers use market intelligence to benchmark technology investments, understand adoption trends among peer institutions, and justify budget allocations for smart display infrastructure.
- Investment & Private Equity Firms : Investors evaluating EdTech opportunities in Europe need comprehensive market analysis, growth projections, and competitive dynamics to assess investment viability and portfolio company potential.
- Government & Policy Makers : European education ministries and policy bodies utilize market data to inform digital education strategies, funding allocations, and technology integration initiatives aligned with EU digital transformation goals.
Countries within Europe - compare and drill down
| Country | 2025 size (native) |
|---|---|
| UK | USD 406.9 Million |
| Germany | USD 284.5 Million |
| France | USD 123.7 Million |
| Rest Of Europe | USD 418.3 Million |
Country market size visualization
Reasons to Buy this Report
- Regional Market Segmentation : Gain detailed insights into Europe's education smart display market with country-level breakdowns for UK, Germany, France, and Rest of Europe, enabling targeted market entry and expansion strategies.
- Competitive Landscape Intelligence : Understand market dynamics specific to Europe's mature education sector, including key players, adoption rates, and competitive positioning across different educational institution types and geographies.
- Growth Opportunity Identification : Identify high-potential segments and emerging markets within Europe, from established Western European markets to growth regions in Central and Eastern Europe with expanding education budgets.
- Investment & Funding Insights : Access data on government education spending, EU digital initiatives, and institutional investment trends driving smart display adoption across European schools and universities through 2029.
- Strategic Planning Support : Leverage accurate market forecasts and CAGR projections to inform product development, pricing strategies, and go-to-market plans tailored to Europe's specific regulatory and educational landscape.
Frequently asked questions
What is the current size of Europe's Education Smart Display Market?
Europe's Education Smart Display Market was valued at USD 1,053.2 million in 2024.
What is the projected market size for Europe by 2029?
Europe's Education Smart Display Market is projected to reach USD 1,233.4 million by 2029.
What is the CAGR for Europe's Education Smart Display Market?
Europe's Education Smart Display Market is expected to grow at a CAGR of 3.2% from 2024 to 2029.
What factors are driving growth in Europe's education smart display sector?
Growth in Europe is driven by digital transformation initiatives, regulatory support for EdTech, public investment in classroom modernization, and replacement of legacy systems.
How does Europe's market growth compare to global trends?
Europe's 3.2% CAGR is slightly lower than the global 4% CAGR, reflecting Europe's more mature and established education technology infrastructure.
RESEARCH METHODOLOGY
The research study involved four major activities in estimating the size of the education smart display market. Exhaustive secondary research has been done to collect important information about the market and peer markets. The validation of these findings, assumptions, and sizing with the help of primary research with industry experts across the value chain has been the next step. Both top-down and bottom-up approaches have been used to estimate the market size. Post which the market breakdown and data triangulation have been adopted to estimate the market sizes of segments and sub-segments.
Secondary Research
In secondary research, various secondary sources have been referred to for obtaining the information that was needed for the study. Various secondary sources that were used for the research include corporate filings such as annual reports, press releases, investor presentations, and financial statements; trade, business, and professional associations; whitepapers, journals, certified publications, and articles from recognized authors and databases.
In the education smart display report, the top-down as well as bottom-up approaches have been used for the estimation of the global market size, along with several other dependent submarkets. The major players in the market were identified with the help of extensive secondary research and their presence in the market was determined using secondary and primary research. All the percentage shares, splits, and breakdowns have been determined using secondary sources and verified through primary sources.
Primary Research
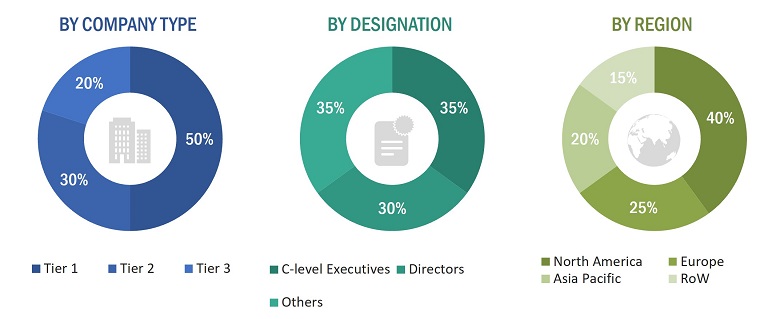
Extensive primary research has been conducted after understanding the education smart display market scenario through secondary research. Several primary interviews have been conducted with key opinion leaders from both demand- and supply-side vendors across four major regions— North America, Europe, Asia Pacific, and the Rest of the World. Approximately 25% of the primary interviews have been conducted with the demand-side vendors and 75% with the supply-side vendors. Primary data has been collected mainly through telephonic interviews, which consist of 80% of the total primary interviews; questionnaires and emails have also been used to collect the data.
After successful interaction with industry experts, brief sessions were conducted with highly experienced independent consultants to reinforce the findings of our primary research. This, along with the in-house subject matter experts’ opinions, has led us to the findings as described in the report.
To know about the assumptions considered for the study, download the pdf brochure
Market Size Estimation
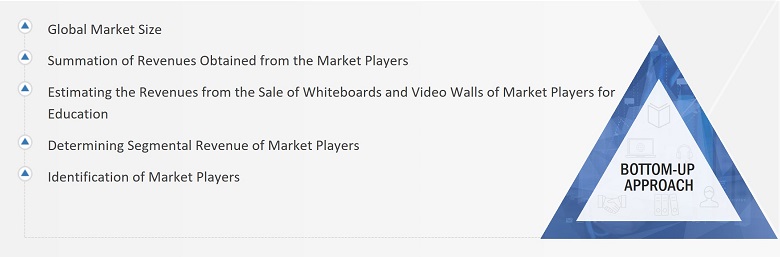
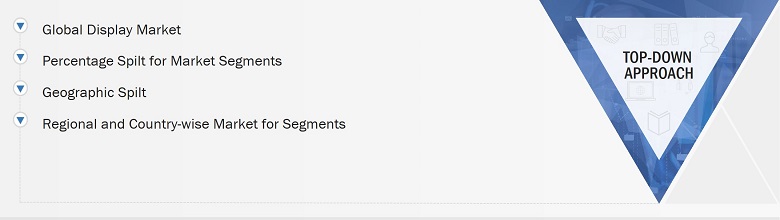
In the market engineering process, both top-down and bottom-up approaches along with data triangulation methods have been used to estimate and validate the size of the education smart display market and other dependent submarkets. The research methodology used to estimate the market sizes includes the following:
- Initially, the focus was on top line investments and spending in the ecosystem. Further the segment level splits and major developments in the market have been considered.
- Identifying different stakeholders in the education smart displays market that influence the entire market, along with participants across the supply chain
- Analyzing major manufacturers of whiteboards and video walls for education as well as studying their product portfolios
- Analyzing trends related to the adoption of whiteboards and video walls
- Tracking the recent and upcoming developments in the market that include investments, R&D activities, product launches, collaborations, mergers & acquisitions, and partnerships as well as forecasting the market size based on these developments and other critical parameters
- Carrying out multiple discussions with key opinion leaders to identify the trends in the adoption of whiteboards and video walls
- Segmenting the overall market into various other market segments
- Validating the estimates at each level through discussions with key opinion leaders, such as chief executives (CXOs), directors, and operation managers, and finally with the domain experts at MarketsandMarkets
Market Size Estimation Methodology-Bottom-up Approach
Market Size Estimation Methodology-Top-Down Approach
Data Triangulation
After arriving at the overall market size through the market size estimation process explained in the earlier section, the overall education smart displays market has been divided into several segments and subsegments. To complete the overall market engineering process and arrive at the exact statistics for all segments, the data triangulation and market breakdown procedures have been used, wherever applicable. The data has been triangulated by studying various factors and trends from both, the demand and supply side perspectives. Along with the data triangulation and market breakdown procedures, the market has been validated through the top-down and bottom-up approaches.
Market Definition
The education smart displays market refers to the industry segment that involves the production, distribution, and adoption of interactive display solutions designed specifically for educational environments. These displays are equipped with advanced technologies such as touchscreens, high resolutions, and interactive functionalities to enhance the learning experience in classrooms and other educational settings.
Education smart displays are tailored to support modern teaching methodologies, foster collaborative learning, and provide interactive content delivery. The market encompasses a range of display sizes, formats, and features that cater to the diverse needs of educational institutions, from primary schools to universities. The primary goal is to leverage technology to create dynamic, engaging, and interactive learning environments, contributing to the digital transformation of education.
Key Stakeholders
- Raw Material Supplier
- Manufacturers
- Technology Providers
- Government and Regulatory Bodies
- IT Support and Service Providers
- Educational Institutions
- Investors and Financial Institutions
- Industry Associations
- Content Developers
The main objectives of this study are as follows:
- To define, analyze, and forecast the education smart display market size, based on product type, display technology, display size and region in terms of value
- To define, analyze, and forecast the market size, based on product type, and display size in terms of volume
- To forecast the market size for various segments with respect to four main regions, namely, North America, Europe, Asia Pacific, and Rest of the World
- To provide detailed information regarding the major drivers, restraints, opportunities, and challenges influencing the growth of the market
- To study the complete value chain and related industry segments for the market
- To strategically analyze the micromarkets1 with respect to individual growth trends, prospects, and contributions to the total market
- To analyze trends and disruptions; pricing trends; patents and innovations; trade data (export and import data); regulatory environment; Porter's five forces analysis; case studies; key stakeholders & buying criteria; technology trends; the market ecosystem; and key conferences and events related to the education smart displays market
- To analyze opportunities in the market for various stakeholders by identifying the high-growth segments of the market
- To strategically profile the key players and comprehensively analyze their market positions in terms of ranking and core competencies2, along with the detailed the competitive landscape for the market leaders
- To analyze competitive developments such as product launches/developments, expansions, acquisitions, partnerships, collaborations, agreements, and research & development (R&D) activities carried out by players in the market, strategically profile the key players and comprehensively analyze their market position in terms of ranking and core competencies2, along with detailing the competitive landscape for the market leaders
- To analyze competitive developments such as product launches/developments, expansions, acquisitions, partnerships, collaborations, agreements, and research and development (R&D) activities carried out by players in the education smart display market
Available Customizations:
With the given market data, MarketsandMarkets offers customizations according to the specific requirements of companies. The following customization options are available for the report:
Country-wise Information:
- Country-wise breakdown for Americas, Europe, Asia Pacific, and Rest of the World
Company Information:
- Detailed analysis and profiling of additional market players (up to five)
Get the Full Education Smart Display Market Report
Full forecast, segment splits, and company analysis for all Education Smart Display Market.
- Japan Education Smart Display Market
- South Korea Education Smart Display Market
- India Education Smart Display Market
- Rest Of Europe Education Smart Display Market
- Rest Of Asia Pacific Education Smart Display Market
- US Education Smart Display Market
- Canada Education Smart Display Market
- Mexico Education Smart Display Market
- UK Education Smart Display Market
- Germany Education Smart Display Market
- France Education Smart Display Market
- China Education Smart Display Market
Need a Tailored Report?
Customize this report to your needs
Get 10% FREE Customization
Customize This Report
