
Rest Of Asia Pacific Food Inspection Devices Market (2025-2030)

The Rest Of Asia Pacific Food Inspection Devices Market was valued at $101.6 Million in 2025 and projected to reach to $166 Million by 2030, representing a compound annual growth rate of 10.3%. Rest Of Asia Pacific represents a high-growth segment within the global food inspection devices market, driven by strengthening regulatory frameworks and modernization of food production infrastructure.


| Market Size in | USD 26.32 MN |
| Market Forecast in | |
| CAGR | |
| Forecast Period | |
| Units Considered | Value (USD MN) |
Rest Of Asia Pacific Food Inspection Devices Market Trends and Insights
- The region is experiencing robust growth driven by increasing food safety regulations, rising consumer awareness, and rapid industrialization across emerging economies.
- Rest Of Asia Pacific is projected to expand significantly, reaching $166.0 million by 2030, reflecting a compound annual growth rate of 10.3% throughout the forecast period. The growth trajectory in Rest Of Asia Pacific is supported by substantial investments in food processing infrastructure and modernization of supply chain operations.
- Rest Of Asia Pacific's food inspection device adoption is accelerating as manufacturers seek to comply with stringent international quality standards and reduce contamination risks.
- The region's expanding middle class and growing demand for packaged foods further propel the need for advanced inspection technologies in Rest Of Asia Pacific. Rest Of Asia Pacific demonstrates strong potential for market participants, with opportunities emerging across both established and developing markets within the region.
- The competitive landscape in Rest Of Asia Pacific is becoming increasingly sophisticated, with local and international players investing in innovation and localized solutions to capture market share through 2030..
Key Market Statistics
- CAGR (2025-2030) 10.3% CAGR
- Market Size, 2025 ~USD 101.6 Million
- Forecast, 2030 ~USD 166 Million
- Country Rest Of Asia Pacific
Rest Of Asia Pacific Food Inspection Devices Market Overview
Rapid Market Expansion :
Rest Of Asia Pacific's food inspection devices market is projected to grow from $101.6 million in 2025 to $166.0 million by 2030, representing a robust 10.3% CAGR, outpacing the global average of 9.3%.
Regulatory Compliance Drivers :
Stringent food safety regulations across emerging economies in the region are compelling manufacturers and food processors to adopt advanced inspection technologies to meet international standards.
Rising Consumer Awareness :
Increasing consumer consciousness regarding food quality and safety in Rest Of Asia Pacific is accelerating demand for automated inspection devices across food production and distribution channels.
Industrial Growth Momentum :
Rapid industrialization and expansion of food processing sectors in emerging economies within Rest Of Asia Pacific are creating substantial opportunities for food inspection device adoption.
Rest Of Asia Pacific Food Inspection Devices Market Dynamics
- The region's emerging economies are increasingly investing in automation and quality assurance technologies to meet both domestic and export market requirements.
- Consumer demand for safer, higher-quality food products continues to rise, compelling manufacturers to implement sophisticated inspection solutions.
- The 10.3% CAGR through 2030 reflects sustained momentum as food safety becomes a critical competitive differentiator.
- Market expansion is further supported by government initiatives promoting food industry standards and the growing middle-class population demanding premium food products with verified safety credentials..
Market Ecosystem
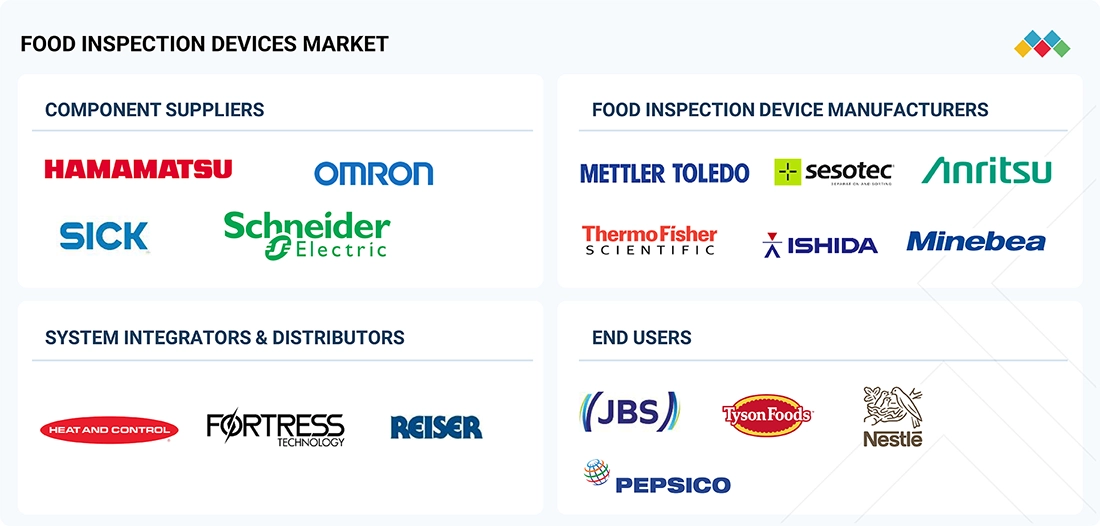
Food Inspection Devices Market: COMMERCIAL USE CASES ACROSS INDUSTRIES
| COMPANY | USE CASE DESCRIPTION | BENEFITS |
|---|---|---|
 |
Advanced X-ray, metal detection, and checkweighing for contamination, weight verification, and quality checks | High detection sensitivity | Compliance with global food safety standards (BRC, IFS) | Modular, automated systems | Real-time data analytics for process optimization |
 |
X-ray, metal detection, and spectroscopy systems for contaminant detection and product integrity verification | Superior analytical accuracy | Robust contamination detection | Integrated Data Management | High throughput for large-scale food processing |
 |
Checkweighers, X-ray, and vision systems for weight control, seal integrity, and foreign object detection | High-speed inspection | Precision weighing | Reliable packaging quality | Enhanced productivity through automation and digital monitoring |
 |
X-ray and metal detection for contamination control and package quality consistency | High-resolution imaging | Advanced detection algorithms | Reduced false rejects | Compliance with international safety and quality regulations |
 |
Metal detectors, checkweighers, and X-ray systems for automated end-of-line contamination and weight checks | Durable, hygienic designs | Easy integration with production lines | User-friendly interface | Global service support and regulatory compliance |
Logos and trademarks shown above are the property of their respective owners. Their use here is for informational and illustrative purposes only.
Related Ecosystem
Electronics System And Components
- Sensors
- Temperature Sensors
- Pressure Sensors
- Actuators
- Image Sensors
- Lenovo
- Samsung
- Texas Instruments Incorporated
- HONEYWELL INTERNATIONAL INC.
- Teledyne Technologies Incorporated
Key Takeaways
- Rest Of Asia Pacific food inspection devices market is valued at $101.6 million in 2025 and is forecast to reach $166.0 million by 2030.
- Rest Of Asia Pacific is experiencing a 10.3% CAGR, outpacing global growth and reflecting strong regional demand for food safety solutions.
- Regulatory compliance and food safety standards are primary drivers accelerating adoption of inspection devices across Rest Of Asia Pacific.
- Rest Of Asia Pacific presents significant opportunities for both established technology providers and emerging local manufacturers through 2030.
Food Inspection Devices Market Report Scope
| Report Metric | Details |
|---|---|
| Base Year | 2025 |
| Fastest Growing Segment | SPECTROSCOPY DEVICES (Product) |
| Forecast Period | 2025-2030 |
| Growth Rate | CAGR of 9.3% from 2025 to 2030 |
| Largest Segment | AUTOMATED/COMPUTERIZED SYSTEMS (Technology) |
| Market Size Base Year (Billions) | ~USD 3.26 (2025) |
| Revenue Forecast (Billions) | ~USD 5.08 (2030) |
| Segments Covered | Product, Vertical, Food Category, Technology |
Rest Of Asia Pacific Food Inspection Devices Market Report Segmentation
4 segment dimensions are covered across the global market.
By Product
- Checkweighers
- Metal Detectors
- Microbial Detection Systems
- Other Devices
- Spectroscopy Devices
- Vision Inspection Systems
- X-Ray Inspection Devices
By Vertical
- Food Manufacturers & Processors
- Food Packaging Companies
- Government Agencies, Food Safety Authorities, And Other Verticals
- Retail Chains & Hypermarkets
By Food Category
- Bakery & Confectionery
- Catering & Ready-To-Eat Meals
- Dairy
- Meat
- Poultry & Seafood
By Technology
- Automated/Computerized Systems
- Manual Inspection Devices
Target Audience
- Food Processing Manufacturers : Need regional market intelligence to invest in inspection technology upgrades, optimize production quality, and ensure compliance with increasingly stringent food safety regulations across Rest Of Asia Pacific.
- Equipment Suppliers & OEMs : Require detailed market forecasts and regional demand drivers to develop product roadmaps, identify distribution partnerships, and allocate resources effectively in the high-growth Rest Of Asia Pacific segment.
- Food Safety Consultants : Depend on comprehensive market data to advise clients on technology adoption trends, regulatory compliance requirements, and best practices specific to Rest Of Asia Pacific food inspection standards.
- Investment & Private Equity Firms : Need market sizing, growth projections, and competitive landscape analysis for Rest Of Asia Pacific to evaluate investment opportunities in food inspection technology companies and related ventures.
- Government & Regulatory Bodies : Utilize market insights to develop food safety policies, understand industry adoption rates, and benchmark Rest Of Asia Pacific's inspection technology infrastructure against global standards.
Reasons to Buy this Report
- Regional Growth Opportunity : Capture insights into the fastest-growing food inspection segment in Asia Pacific with 10.3% CAGR, enabling strategic market entry and expansion planning in high-potential emerging economies.
- Regulatory Landscape Intelligence : Understand evolving food safety regulations across Rest Of Asia Pacific countries to align product development and compliance strategies with regional requirements and standards.
- Competitive Positioning : Gain detailed market analysis to identify competitive gaps, emerging players, and differentiation opportunities specific to Rest Of Asia Pacific's unique market dynamics.
- Investment Decision Support : Access comprehensive market sizing and forecasts ($101.6M to $166M) to support capital allocation decisions, partnership evaluations, and market entry strategies in the region.
- Consumer Trend Insights : Leverage data on rising consumer awareness and industrialization trends in Rest Of Asia Pacific to develop targeted marketing strategies and product positioning for regional audiences.
Frequently asked questions
What is the current market size of food inspection devices in Rest Of Asia Pacific?
Rest Of Asia Pacific's food inspection devices market is estimated at $101.6 million in 2025, with strong growth anticipated through the forecast period.
What is the projected market size for Rest Of Asia Pacific by 2030?
Rest Of Asia Pacific is projected to reach $166.0 million by 2030, representing significant expansion from the 2025 baseline.
What is the CAGR for the food inspection devices market in Rest Of Asia Pacific?
Rest Of Asia Pacific is experiencing a compound annual growth rate of 10.3% from 2025 to 2030.
What factors are driving growth in Rest Of Asia Pacific's food inspection devices market?
Rest Of Asia Pacific's growth is driven by stringent food safety regulations, increasing consumer awareness, rapid industrialization, and modernization of food processing infrastructure.
Which segments are most active in Rest Of Asia Pacific's food inspection market?
Rest Of Asia Pacific shows strong activity across packaged food manufacturing, beverage production, and export-oriented food processing sectors seeking compliance with international standards.
RESEARCH METHODOLOGY
The research study involved four major activities in estimating the size of the food inspection devices market. Exhaustive secondary research has been done to collect important information about the market and peer markets. The next step has been to validate these findings and assumptions and size them with the help of primary research with industry experts across the value chain. Both top-down and bottom-up approaches have been used to estimate the market size. Post which, the market breakdown and data triangulation have been adopted to estimate the market sizes of segments and sub-segments.
Secondary Research
In the secondary research process, various secondary sources were referred to identify and collect the information required for this study. The secondary sources include annual reports, press releases, investor presentations of companies, white papers, and articles from recognized authors. Secondary research has been mainly done to obtain key information about the market’s value chain, the pool of key market players, market segmentation according to industry trends, regional outlook, and developments from both market and technology-oriented perspectives.
The food inspection devices market report estimates the global market size using both the top-down and bottom-up approaches, along with several other dependent submarkets. The major players in the market were identified using extensive secondary research, and their presence in the market was determined using secondary and primary research. All the percentage shares, splits, and breakdowns have been determined using secondary sources and verified through primary sources.
Primary Research
Extensive primary research has been conducted after understanding the food inspection devices market scenario through secondary research. Several primary interviews have been conducted with key opinion leaders from demand- and supply-side vendors across four major regions—North America, Europe, Asia Pacific, and the Rest of the World. Approximately 25% of the primary interviews have been conducted with the demand-side vendors and 75% with the supply-side vendors. Primary data has been collected mainly through telephonic interviews, which account for 80% of the total primary interviews. Questionnaires and emails have also been used to collect the data.
After successful interaction with industry experts, brief sessions were conducted with highly experienced independent consultants to reinforce the findings of our primary research. This, along with the in-house subject matter experts’ opinions, has led us to the findings as described in the report.
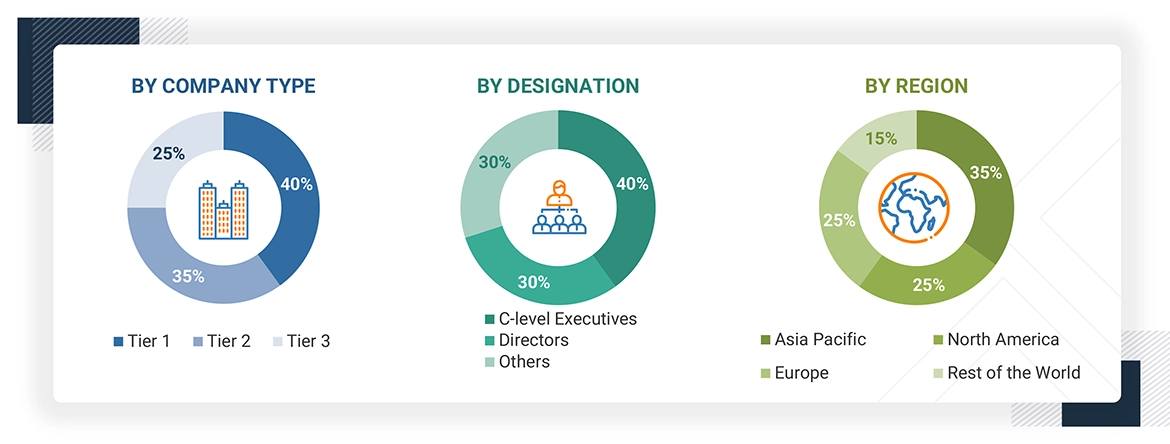
Note: “Others” includes sales, marketing, and product managers.
To know about the assumptions considered for the study, download the pdf brochure
Market Size Estimation
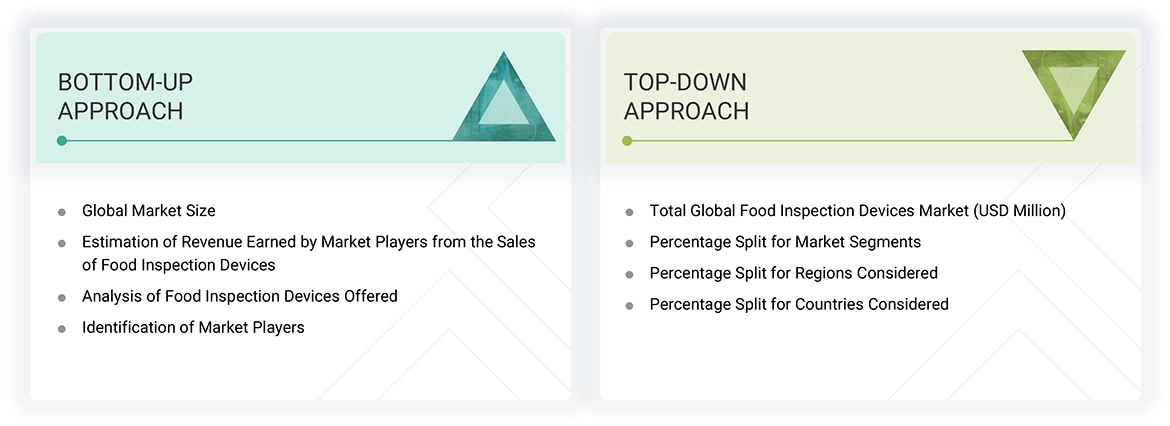
In the market engineering process, top-down and bottom-up approaches and data triangulation methods have been used to estimate and validate the size of the food inspection devices market and other dependent submarkets. The research methodology used to estimate the market sizes includes the following:
- Identifying stakeholders in the food inspection devices market, including certification bodies, regulatory authorities, accreditation agencies, consulting firms, and industry participants across the value chain
- Analyzing major providers of food inspection devices and their key offerings, including x-ray inspection devices, metal detectors, spectroscopy devices, checkweighers, vision inspection systems, microbial detection systems, and other food inspection devices
- Studying trends of food inspection devices across food categories such as meat, poultry & seafood, dairy, bakery & confectionery, and catering & ready-to-eat meals, based on product, technology, vertical, and region
- Tracking recent market developments, including regulatory updates from agencies like the U.S. FDA, EFSA (Europe), and FSSAI (India), introduction of advanced inspection technologies (e.g., AI-integrated X-ray and spectroscopy systems), and product launches of key players to accurately forecast market size and growth trends
- Conducting multiple discussions with key opinion leaders across equipment manufacturers, food processors, quality assurance consultants, and regulatory auditors to understand real-time adoption dynamics, operational challenges, and the shifting focus toward automation, compliance, and traceability in food inspection workflows
- Validating market estimates through in-depth consultations with industry experts—ranging from R&D heads of leading device manufacturers to quality heads of food processing units and technical advisors at regulatory bodies—and finally aligning insights with the domain experts at MarketsandMarkets to ensure robustness and precision in market projections
Food Inspection Devices Market : Top-Down and Bottom-Up Approach
Data Triangulation
After arriving at the overall market size by the market size estimation process explained in the earlier section, the overall food inspection devices market has been divided into several segments and subsegments. The data triangulation and market breakdown procedures have been used to complete the overall market engineering process and arrive at the exact statistics for all segments, wherever applicable. The data has been triangulated by studying various factors and trends from both the demand and supply side perspectives. Along with data triangulation and market breakdown, the market has been validated through the top-down and bottom-up approaches.
Market Definition
The food inspection devices market comprises a diverse array of technologically sophisticated systems designed to detect, monitor, and prevent contamination or defects throughout various stages of food production and packaging. These devices are essential for ensuring food safety, maintaining quality standards, and achieving regulatory compliance. They utilize advanced technologies such as X-ray imaging, metal detection, vision inspection, spectroscopy, and microbial detection.
Increasingly, food inspection systems are being integrated into automated production environments to facilitate real-time monitoring, reduce the incidence of product recalls, and enhance overall operational efficiency. These systems are deployed by food manufacturers, processors, packaging companies, and retailers to identify foreign objects, verify weight accuracy, assess packaging integrity, and confirm product compliance with industry norms and regulatory requirements.
The market is undergoing significant transformation, propelled by heightened consumer awareness, stricter regulatory frameworks, and escalating demand for safe, traceable, and high-quality food products. This shift is driving the adoption of predictive, data-centric solutions powered by artificial intelligence (AI), the Internet of Things (IoT), and machine learning. Consequently, food inspection devices are evolving from traditional manual systems into strategic assets that not only mitigate compliance risks and protect brand equity but also contribute to greater productivity and profitability across the global food supply chain.
Key Stakeholders
- Equipment Manufacturers and OEMs
- System Integrators and Automation Solution Providers
- Digital Solution Providers
- Calibration, Validation, and Maintenance Service Providers
- Food Safety and Quality Auditing Firms
- Regulatory Authorities and Food Safety Agencies
- Industry Associations and Technical Consortiums
- Research Institutions and Academic Bodies
- Food Processing and Packaging Companies
- Retail Chains, Hypermarkets, and Foodservice Operators
- End-use Industries
Report Objectives
- To define, describe, segment, and forecast the size of the food inspection devices market, by product, technology, vertical, food category, and region, in terms of value
- To forecast the market size for the product segment for metal detectors, in terms of volume
- To forecast the size of various segments for four regions: North America, Asia Pacific, Europe, and the Rest of the World (RoW), in terms of value
- To offer detailed information on drivers, restraints, opportunities, and challenges influencing market growth
- To provide a detailed overview of the food inspection devices market value chain
- To strategically analyze the micromarkets1 concerning individual growth trends, prospects, and contributions to the overall market
- To study the impact of AI/Gen AI on the market under study, along with the macroeconomic outlook for each region
- To analyze opportunities for various stakeholders by identifying the high-growth segments of the market
- To benchmark the key players and analyze their market position in terms of revenue, market share, and core competencies2 and provide a detailed competitive landscape for the market leaders
- To analyze competitive developments such as product launches carried out by players in the food inspection devices market
Available customizations:
With the given market data, MarketsandMarkets offers customizations according to the specific requirements of companies. The following customization options are available for the report:
Country-wise Information:
- Country-wise breakdown for North America, Europe, Asia Pacific, and Rest of the World
Company Information:
- Detailed analysis and profiling of additional market players (up to five)
Get the Full Food Inspection Devices Market Report
Full forecast, segment splits, and company analysis for all Food Inspection Devices Market.
- US Food Inspection Devices Market
- Canada Food Inspection Devices Market
- Mexico Food Inspection Devices Market
- Germany Food Inspection Devices Market
- UK Food Inspection Devices Market
- France Food Inspection Devices Market
- Italy Food Inspection Devices Market
- Spain Food Inspection Devices Market
- Poland Food Inspection Devices Market
- China Food Inspection Devices Market
- Japan Food Inspection Devices Market
- South Korea Food Inspection Devices Market
- India Food Inspection Devices Market
- Australia Food Inspection Devices Market
- Indonesia Food Inspection Devices Market
- Thailand Food Inspection Devices Market
- Malaysia Food Inspection Devices Market
- Vietnam Food Inspection Devices Market
- Nordics Food Inspection Devices Market
- Rest Of Europe Food Inspection Devices Market
- Bahrain Food Inspection Devices Market
- Kuwait Food Inspection Devices Market
- Oman Food Inspection Devices Market
- Qatar Food Inspection Devices Market
- Rest Of Middle East Food Inspection Devices Market
- Saudi Arabia Food Inspection Devices Market
- UAE Food Inspection Devices Market
- Rest Of Africa Food Inspection Devices Market
- South Africa Food Inspection Devices Market
Need a Tailored Report?
Customize this report to your needs
Get 10% FREE Customization
Customize This Report
