
Asia Pacific Future of E-Powertrain (2024-2029)

The Asia Pacific Future of E-Powertrain was valued at $11325 Million in 2024 and projected to reach to $30506 Million by 2029, representing a compound annual growth rate of 13.2%. Asia Pacific's e-powertrain market is positioned for transformative growth through 2029, driven by aggressive electrification targets and supportive policy frameworks across the region.


| Market Size in | USD 26.32 MN |
| Market Forecast in | |
| CAGR | |
| Forecast Period | |
| Units Considered | Value (USD MN) |
Asia Pacific Future of E-Powertrain Trends and Insights
- This 13.2% compound annual growth rate reflects Asia Pacific's accelerating shift toward electrified vehicle platforms, driven by stringent emissions regulations, government incentives, and rising consumer demand for sustainable mobility solutions.
- Asia Pacific's dominance in battery manufacturing and semiconductor production positions the region as a strategic advantage for e-powertrain component sourcing and integration. The Asia Pacific e-powertrain market is characterized by rapid technological advancement and competitive intensity among regional and global OEMs.
- Asia Pacific countries, particularly China, Japan, and South Korea, are investing heavily in R&D for next-generation motor technologies, power electronics, and thermal management systems.
- Between 2024 and 2029, Asia Pacific is expected to capture significant market share through localized production facilities and supply chain optimization, supporting both domestic EV adoption and global export demand. Asia Pacific's growth trajectory is underpinned by favorable policy frameworks, declining battery costs, and expanding charging infrastructure.
- Asia Pacific manufacturers are leveraging cost advantages and engineering expertise to develop competitive e-powertrain solutions, positioning the region as a global leader in the transition to electrified transportation..
Key Market Statistics
- CAGR (2024-2029) 13.2% CAGR
- Market Size, 2024 ~USD 11325 Million
- Forecast, 2029 ~USD 30506 Million
- Geography Asia Pacific
Asia Pacific Future of E-Powertrain Overview
Rapid Market Expansion :
Asia Pacific e-powertrain market is experiencing explosive growth, expanding from USD 11,325 million in 2024 to USD 30,506 million by 2029, representing a 13.2% CAGR and outpacing many mature markets globally.
Regulatory Momentum :
Stringent emissions regulations across China, India, Japan, and South Korea are accelerating OEM adoption of electrified powertrains, creating sustained demand for advanced e-powertrain technologies and components.
Government Incentive Programs :
Substantial subsidies, tax benefits, and EV purchase incentives across Asia Pacific nations are driving consumer adoption and manufacturer investment in e-powertrain R&D and production capacity.
Innovation Hub Status :
Asia Pacific is becoming the global epicenter for e-powertrain innovation, with major investments from Tesla, BYD, NIO, and traditional OEMs establishing regional R&D centers and manufacturing facilities.
Asia Pacific Future of E-Powertrain Dynamics
- China's dominance in battery manufacturing and EV production, combined with India's emerging EV sector and Japan's hybrid-electric expertise, creates a diversified innovation ecosystem.
- Consumer preferences are rapidly shifting toward electric vehicles, supported by expanding charging infrastructure and improving battery technology. The region's competitive advantage lies in its manufacturing scale, supply chain integration, and government commitment to carbon neutrality.
- Investment in solid-state batteries, fast-charging systems, and autonomous electric platforms will further accelerate market penetration.
- By 2029, Asia Pacific is expected to account for a significant share of global e-powertrain revenues, establishing the region as the primary growth engine for the automotive electrification revolution..
Market Ecosystem
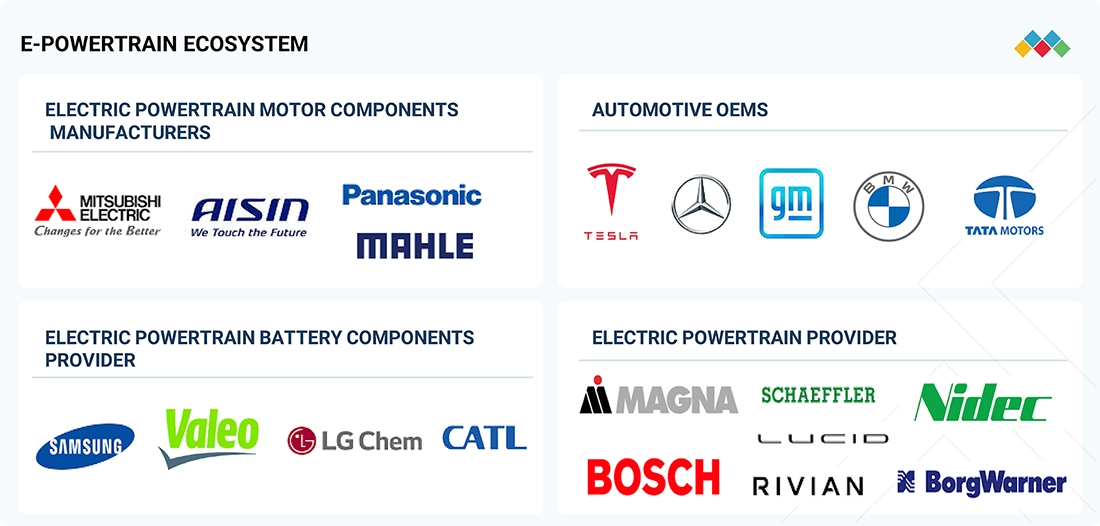
Future of E-Powertrain Market: COMMERCIAL USE CASES ACROSS INDUSTRIES
| COMPANY | USE CASE DESCRIPTION | BENEFITS |
|---|---|---|
 |
Develop and supply high-efficiency e-motors, inverters, and control units with advanced materials and integrated cooling solutions for EV platforms. | Improve energy efficiency, enhance power density, and reduce system weight for extended range and performance. |
 |
Design and manufacture advanced battery systems, including thermal management units, BMS, and high-voltage connectors tailored for integrated powertrains. | Enhance battery safety, lifespan, and efficiency while supporting faster charging and optimized vehicle packaging. |
 |
Integrate modular and scalable e-powertrain systems (e-axles, integrated drive units) across passenger and commercial vehicle portfolios. | Enable higher production flexibility, reduced manufacturing costs, and improved vehicle performance and range. |
 |
Supply complete e-drive systems and retrofit solutions for electric and hybrid vehicles, including 3-in-1 or 5-in-1 integrated configurations. | Simplify powertrain architecture, lower costs, and accelerate electrification through efficient, compact system integration. |
Logos and trademarks shown above are the property of their respective owners. Their use here is for informational and illustrative purposes only.
Related Ecosystem
Key Takeaways
- Asia Pacific e-powertrain market will grow from USD 11.3B (2024) to USD 30.5B (2029) at a 13.2% CAGR, reflecting strong regional electrification momentum.
- Asia Pacific's battery manufacturing and semiconductor capabilities provide competitive advantages in e-powertrain component sourcing and vertical integration.
- China, Japan, and South Korea are driving innovation in motor technologies and power electronics, positioning Asia Pacific as a global technology leader.
- Favorable government policies, declining battery costs, and expanding EV infrastructure are key growth catalysts for Asia Pacific's e-powertrain market through 2029.
Future of E-Powertrain Report Scope
| Report Metric | Details |
|---|---|
| Base Year | 2024 |
| Fastest Growing Segment | COMMERCIAL VEHICLES (Vehicle Type) |
| Forecast Period | 2024-2029 |
| Growth Rate | CAGR of 13.8% from 2024 to 2029 |
| Largest Segment | INVERTER (Component) |
| Market Size Base Year (Billions) | ~USD 0.02 (2024) |
| Revenue Forecast (Billions) | ~USD 0.0513 (2029) |
| Segments Covered | Vehicle Type, Propulsion, Component, Integration Type |
Asia Pacific Future of E-Powertrain Report Segmentation
4 segment dimensions are covered across the global market.
By Vehicle Type
- Commercial Vehicles
- Passenger Cars
By Propulsion
- Bev
- Phev
By Component
- Batteries
- Battery Management System
- Control Unit
- Inverter
- Motor
- On-Board Charger
- Power Distribution Module
By Integration Type
- Integrated
- Non-Integrated
Target Audience
- OEM Executives & Strategy Teams : Require detailed Asia Pacific market intelligence to inform product development roadmaps, manufacturing capacity planning, and regional go-to-market strategies for e-powertrain platforms.
- Automotive Suppliers & Component Manufacturers : Need market forecasts and competitive analysis to identify growth segments, optimize supply chain positioning, and secure contracts with Asia Pacific OEMs transitioning to electrified platforms.
- Investment & Private Equity Firms : Seek comprehensive market data and growth projections to evaluate investment opportunities in Asia Pacific e-powertrain startups, manufacturers, and technology providers with high-growth potential.
- Government & Policy Makers : Utilize market insights to design effective EV incentive programs, set realistic electrification targets, and allocate resources for charging infrastructure and manufacturing ecosystem development.
- Technology & Battery Companies : Require regional demand forecasts and technology adoption trends to guide R&D investments, production scaling, and partnership strategies in Asia Pacific's rapidly evolving e-powertrain sector.
Countries within Asia Pacific - compare and drill down
| Country | 2025 size (native) |
|---|
Country market size visualization
Reasons to Buy this Report
- Regional Market Sizing & Forecasts : Obtain precise market valuations and growth projections specific to Asia Pacific, enabling accurate budget allocation and strategic planning for regional expansion and investment decisions.
- Competitive Landscape Intelligence : Identify key players, market share dynamics, and competitive positioning within Asia Pacific's e-powertrain ecosystem to benchmark performance and identify partnership or acquisition opportunities.
- Regulatory & Policy Analysis : Understand country-specific emissions standards, EV incentive programs, and government mandates across China, India, Japan, and Southeast Asia to navigate compliance and capitalize on policy-driven demand.
- Technology & Innovation Trends : Gain insights into emerging e-powertrain technologies, battery innovations, and manufacturing advancements driving Asia Pacific's market leadership and identify R&D investment priorities.
- Investment & Growth Opportunities : Discover high-potential market segments, emerging geographies, and supply chain gaps within Asia Pacific to guide capital deployment and identify strategic business development initiatives.
Frequently asked questions
What is the projected market size for e-powertrain in Asia Pacific by 2029?
Asia Pacific's e-powertrain market is projected to reach USD 30,506 million by 2029, growing from USD 11,325 million in 2024, representing a 13.2% CAGR.
Which countries are leading e-powertrain development in Asia Pacific?
China, Japan, and South Korea are the primary drivers of e-powertrain innovation in Asia Pacific, with significant investments in motor technology, power electronics, and battery integration.
What factors are driving e-powertrain adoption in Asia Pacific?
Key drivers include stringent emissions regulations, government EV incentives, declining battery costs, expanding charging infrastructure, and rising consumer demand for sustainable mobility solutions across Asia Pacific.
How does Asia Pacific's e-powertrain market compare to global growth rates?
Asia Pacific's 13.2% CAGR is slightly below the global average of 13.8%, but the region's absolute market growth and manufacturing capabilities position it as a critical global hub for e-powertrain development.
What supply chain advantages does Asia Pacific offer for e-powertrain manufacturing?
Asia Pacific dominates battery manufacturing and semiconductor production, enabling cost-effective component sourcing, vertical integration, and rapid scaling of e-powertrain production for both regional and global markets.
RESEARCH METHODOLOGY
The study involved analyzing the recent developments, trends, and performance of the players and the electric powertrain market in 2024, along with the projections for 2032. The analysis was based on the sales volume of the EVs around the world. The study also analyzes the primary targets for EVs, market adoption, advancement in powertrain technologies, and government electrification goals—exhaustive secondary research collected information on the market, peer, and parent markets. The next step was to validate these findings, assumptions, and sizing with the industry experts. The bottom-up and top-down approaches were employed to estimate the market size in EV sales for the segments considered.
Secondary Research
In the secondary research process, various secondary sources such as company annual reports/presentations, press releases, industry association publications such as National Highway Traffic Safety Administration (NHTSA), European Automobile Manufacturers’ Association (ACEA), California Department of Motor Vehicles, White papers published by various industry experts, Corporate filings (such as annual reports, investor presentations, and financial statements), Trade, business, and related associations, International Organization for Standardization (ISO), articles, directories, technical handbooks, World Economic Outlook, trade websites, and technical articles are used to identify and collect information useful for an extensive commercial study of the global electric powertrain market.
Market Size Estimation
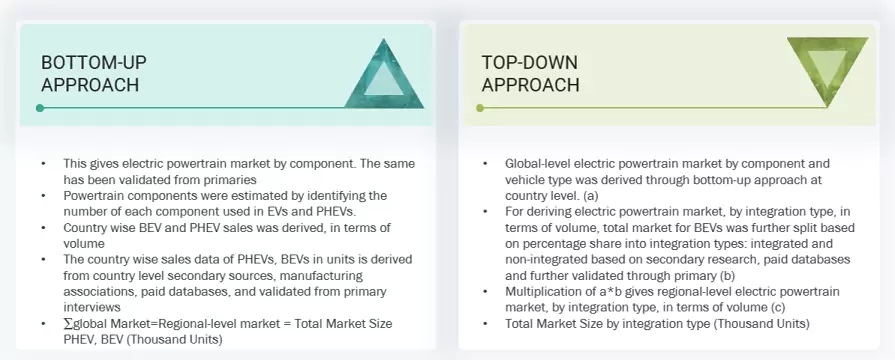
The bottom-up and top-down approaches were used to estimate and validate the size of the electric powertrain market. Country-wise BEV and PHEV sales were derived from various secondary sources, such as country-wise manufacturing associations and paid databases.
The market for BEVs and PHEVs was forecasted based on factors such as government and OEM targets, emission regulations, investments by OEMs & Tier-1 companies is taken into consideration which is further validated through primary research.
Once the base numbers were projected, the powertrain components were estimated by identifying the number of each element used in EVs and PHEVs. This gives the volume of the electric powertrain market by component.
The integrated vs. non-integrated system market was forecasted based on secondary sources like country-wise manufacturing associations, paid databases, etc., further validated through primary research. Factors considered for the forecast of this market include companies’ investment in weight and cost reduction, increasing investments towards electric powertrain, the adoption rate of integrated systems, overall supply chain readiness for integrated components, government’s support for e-powertrain (Subsidies and incentives for electric powertrain), future integrated powertrain launch announcements, etc.
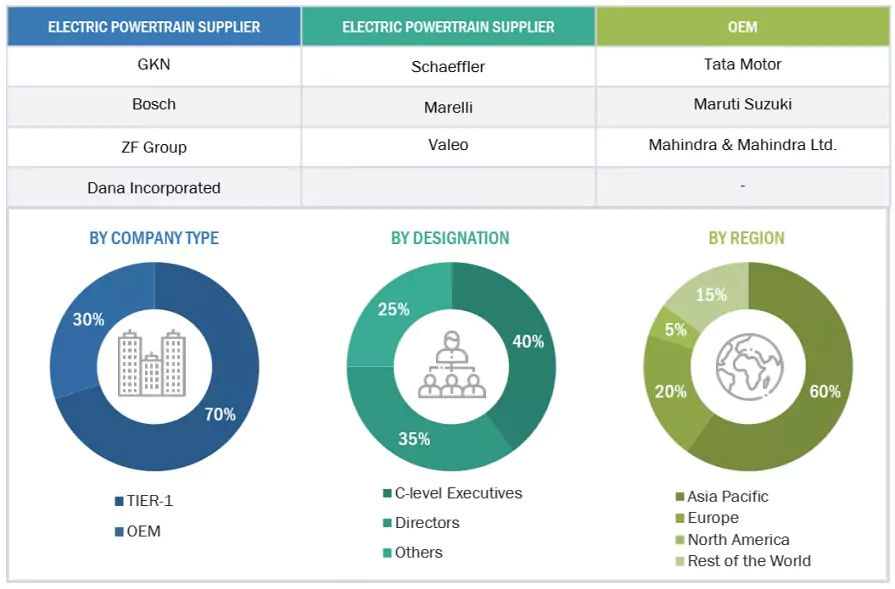
Note 1: Others include sales managers, marketing managers, and product managers.
Note 2: Tier 1 companies’ revenues are more than USD 10 billion; tier 2 companies’ revenues range between USD 1 and 10 billion; and tier 3 companies’ revenues range between USD 500 million and USD 1 billion.
Source: Industry Experts
To know about the assumptions considered for the study, download the pdf brochure
Future of E-Powertrain Market : Top-Down and Bottom-Up Approach
Market Definition
BEV Powertrain: A battery electric vehicle (BEV) powertrain is used in EVs that rely solely on electricity for propulsion. Unlike hybrid cars, BEVs do not have an internal combustion engine and operate entirely on electric power stored in a high-voltage battery pack. The components of a BEV powertrain include electric motors/generators, batteries, battery management systems, on-board chargers, inverters, and power distribution modules.
PHEV Powertrain: A plug-in hybrid electric vehicle (PHEV) powertrain combines an internal combustion engine (ICE) with an electric motor and a battery pack. PHEVs are designed to operate in electric and hybrid models, offering the flexibility of driving on electric power alone or using the internal combustion engine for an extended range. The main components of a PHEV powertrain include motors/generators, batteries, battery management systems, control units, inverters, power distribution modules, and onboard chargers. While PHEV powertrain components share similarities with HEV powertrain components, the larger battery pack, charging capabilities, and extended electric-only range are the key differentiating factors that enable PHEVs to offer a more excellent electric driving experience.
Stakeholders
- Automobile Organizations/Associations
- Electric powertrain manufacturers and suppliers
- Regional manufacturing associations and automobile associations
- Automotive OEMs and electric vehicle manufacturers
- Component suppliers for electric powertrains
- Regional emission standard regulatory authorities
- Research Professionals
Report Objectives
- To analyze the electric powertrain market performance till 2032
- To provide critical developments expected to take place till 2030 and beyond.
- Identify the technological trends likely to impact the market during the forecast period.
- To identify significant growth segments and growth opportunities till 2032.
- To project the electric powertrain sales from 2024 to 2032
- To track and analyze competitive developments such as deals (joint ventures, mergers & acquisitions, partnerships, collaborations), product developments, and other activities carried out by key industry participants.
Get the Full Future of E-Powertrain Report
Full forecast, segment splits, and company analysis for all Future of E-Powertrain.
Need a Tailored Report?
Customize this report to your needs
Get 10% FREE Customization
Customize This Report
