
Asia Pacific GPU Server Market (2025-2030)

The Asia Pacific GPU Server Market was valued at $57210 Million in 2025 and projected to reach to $277860 Million by 2030, representing a compound annual growth rate of 37.2%. Asia Pacific stands as the fastest-growing region for GPU servers globally, fueled by unprecedented AI adoption across enterprise, cloud, and research sectors.


| Market Size in | USD 26.32 MN |
| Market Forecast in | |
| CAGR | |
| Forecast Period | |
| Units Considered | Value (USD MN) |
Asia Pacific GPU Server Market Trends and Insights
- This exceptional 37.2% compound annual growth rate significantly outpaces global trends, driven by accelerating AI adoption, cloud infrastructure investments, and data center expansion across major economies including China, India, Japan, and Southeast Asia.
- Asia Pacific's dominance in semiconductor manufacturing and emerging AI capabilities position the region as the primary driver of GPU server demand through 2030. The Asia Pacific GPU server market is experiencing unprecedented momentum fueled by enterprise digital transformation, government AI initiatives, and the proliferation of large language models and generative AI applications.
- Major cloud service providers and hyperscalers are rapidly scaling GPU-enabled infrastructure across the region to support training, inference, and real-time analytics workloads.
- Asia Pacific's competitive cost structure, talent availability, and strategic importance in global supply chains further reinforce the region's market leadership and investment attractiveness in GPU server technologies..
Key Market Statistics
- CAGR (2025-2030) 37.2% CAGR
- Market Size, 2025 ~USD 57210 Million
- Forecast, 2030 ~USD 277860 Million
- Geography Asia Pacific
Asia Pacific GPU Server Market Overview
Exceptional Growth Trajectory :
Asia Pacific GPU server market is projected to grow from $57,210 million in 2025 to $277,860 million by 2030, representing a 37.2% CAGR that significantly outpaces the global average of 33.6%.
China's Market Dominance :
China leads the Asia Pacific region with $110,220 million in market size, driven by massive AI infrastructure investments, cloud computing expansion, and government initiatives supporting semiconductor advancement.
Japan's Established Presence :
Japan represents the second-largest market at $81,500 million, leveraging its advanced semiconductor ecosystem, robotics integration, and enterprise AI adoption across manufacturing and financial sectors.
Emerging Growth Hubs :
South Korea ($37,510 million) and India ($17,320 million) are emerging as critical growth markets, supported by tech infrastructure development, startup ecosystems, and increasing cloud service adoption.
Asia Pacific GPU Server Market Dynamics
- China and Japan's combined market share exceeds 75% of the regional value, while emerging economies like India and South Korea are rapidly scaling infrastructure investments.
- The region's growth is accelerated by government AI initiatives, hyperscaler data center expansions, and the shift toward edge computing and localized AI services. By 2030, Asia Pacific is expected to capture nearly 40% of global GPU server demand, driven by digital transformation initiatives, semiconductor self-sufficiency goals, and the proliferation of AI-powered applications in finance, healthcare, and manufacturing.
- Strategic partnerships between regional tech giants and international GPU manufacturers will further consolidate market leadership, while supply chain localization efforts reduce dependencies and enhance regional competitiveness..
Market Ecosystem
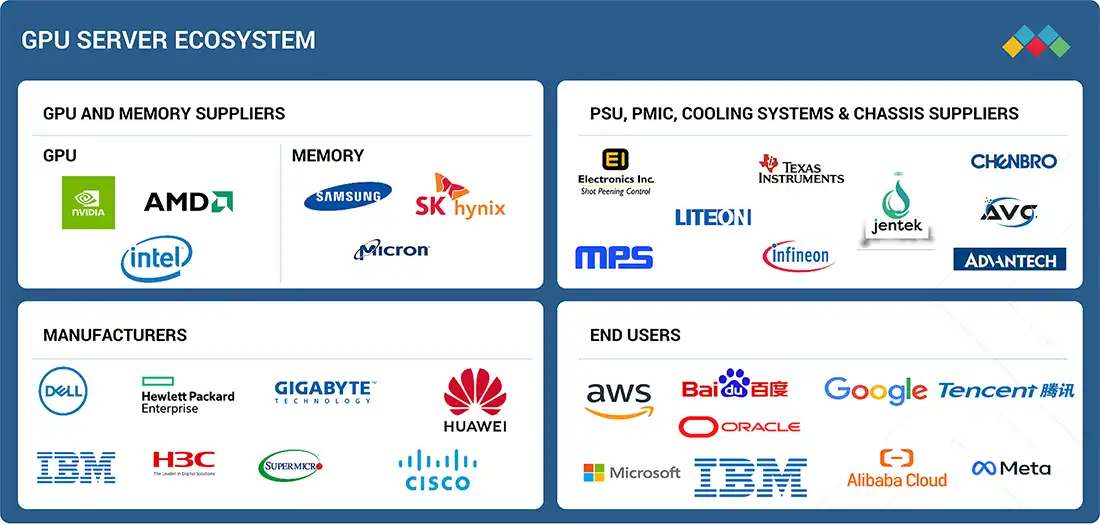
GPU Server Market: COMMERCIAL USE CASES ACROSS INDUSTRIES
| COMPANY | USE CASE DESCRIPTION | BENEFITS |
|---|---|---|
 |
GPU server for healthcare, BFSI, automotive, and others | Rapid data transfer, reducing the total cost of ownership, helping enterprises to accelerate their AI/ML strategies |
 |
GPU server for healthcare, BFSI, automotive, manufacturing, telecommunication, defense, and others | Robust security and scalability features, faster decision making, boosting productivity |
 |
GPU cloud server for data center and AI research industry | Ideal for handling computational task and enhance cloud deployment |
 |
GPU server for healthcare, BFSI, automotive, and others | Ideal for workloads like natural language processing, image recognition, recommendation systems, and scientific research. |
 |
GPU server for healthcare, BFSI, automotive, retail, telecommunication, government, and others | Virtualized GPU Resource Allocation, Scalable compute for automotive and manufacturing digital twin environments. |
Logos and trademarks shown above are the property of their respective owners. Their use here is for informational and illustrative purposes only.
Related Ecosystem
Information System And Analytics
- Machine Learning
- Natural Language Processing (NLP)
- Sensors
- Software as A Service (SaaS)
- Data Loss Prevention (DLP)
- International Business Machines Corporation
- MICROSOFT CORPORATION
- Amazon.com, Inc.
- Oracle Corporation
Key Takeaways
- Asia Pacific GPU server market will grow from $57.2B (2025) to $277.9B (2030) at a 37.2% CAGR, outpacing global growth rates.
- China, India, Japan, and Southeast Asia are primary demand drivers in Asia Pacific, supported by government AI initiatives and hyperscaler investments.
- Enterprise AI adoption and generative AI applications are accelerating GPU server deployments across Asia Pacific data centers.
- Asia Pacific's semiconductor manufacturing dominance and cost competitiveness position the region as the global GPU server market leader.
GPU Server Market Report Scope
| Report Metric | Details |
|---|---|
| Base Year | 2025 |
| Fastest Growing Segment | GENERATIVE AI (Application) |
| Forecast Period | 2025-2030 |
| Growth Rate | CAGR of 33.6% from 2025 to 2030 |
| Largest Segment | RACK-MOUNTED SERVERS (Form Factor) |
| Market Size Base Year (Billions) | ~USD 171.64 (2025) |
| Revenue Forecast (Billions) | ~USD 730.56 (2030) |
| Segments Covered | Cooling Technology, Deployment, Function, Form Factor, Application, Type, End User, Enterprise Type |
Asia Pacific GPU Server Market Report Segmentation
8 segment dimensions are covered across the global market.
By Cooling Technology
- Air Cooling
- Hybrid Cooling
- Liquid Cooling
By Deployment
- Cloud-Based
- On-Premises
By Function
- Inference
- Training
By Form Factor
- Blade Servers
- Rack-Mounted Servers
- Tower Servers
By Application
- Computer Vision
- Generative AI
- Machine Learning
- Natural Language Processing
By Type
- Autoencoders
- Convolutional Neural Networks (Cnns)
- Deep Learning
- Generative Adversarial Networks (Gans)
- Rule-Based Models
- Statistical Models
- Transformer Models
By End User
- Cloud Service Providers
- Enterprises
- Government Organizations
By Enterprise Type
- Automotive
- Bfsi
- Healthcare
- Media & Entertainment
- Other Enterprise Types
- Other Enterprises
- Retail & E-Commerce
Target Audience
- GPU & Semiconductor Manufacturers : Strategic planning for regional production capacity, distribution networks, and product localization to capture Asia Pacific's 37.2% growth opportunity.
- Cloud & Data Center Operators : Infrastructure investment decisions and market expansion strategies across China, Japan, and emerging Asia Pacific markets experiencing rapid AI workload growth.
- Enterprise IT Decision Makers : Procurement planning and technology roadmap development for AI infrastructure deployment across Asia Pacific operations and regional data centers.
- Investment & Private Equity Firms : Portfolio assessment and M&A opportunity identification within Asia Pacific's high-growth GPU server and AI infrastructure sectors.
- Government & Policy Advisors : Evidence-based policy development for semiconductor self-sufficiency, AI infrastructure investment, and regional technology competitiveness initiatives.
Countries within Asia Pacific - compare and drill down
| Country | 2025 size (native) |
|---|---|
| China | USD 110220 Million |
| Japan | USD 81500 Million |
| South Korea | USD 37510 Million |
| India | USD 17320 Million |
| Rest Of Asia Pacific | USD 31310 Million |
Country market size visualization
Reasons to Buy this Report
- Regional Market Segmentation : Gain detailed insights into country-level GPU server markets across Asia Pacific, including China, Japan, South Korea, and India, enabling precise market entry and expansion strategies.
- Competitive Landscape Analysis : Understand regional competitive dynamics, key players, and market consolidation trends specific to Asia Pacific's rapidly evolving GPU server ecosystem.
- Growth Driver Identification : Identify region-specific growth catalysts including government AI policies, cloud infrastructure investments, and enterprise digital transformation initiatives driving 37.2% CAGR.
- Investment Opportunity Assessment : Evaluate emerging markets and high-growth segments within Asia Pacific to identify optimal investment timing and portfolio allocation strategies.
- Demand Forecasting Precision : Access granular 2025-2030 forecasts by country and segment to support supply chain planning, capacity expansion, and revenue projections for Asia Pacific operations.
Frequently asked questions
What is the projected market size for GPU servers in Asia Pacific by 2030?
Asia Pacific's GPU server market is forecast to reach $277,860 million by 2030, growing from $57,210 million in 2025.
What is the CAGR for the Asia Pacific GPU server market?
Asia Pacific's GPU server market is expected to grow at a compound annual growth rate of 37.2% from 2025 to 2030.
Which countries are driving GPU server demand in Asia Pacific?
China, India, Japan, and Southeast Asian nations are the primary growth drivers in Asia Pacific, fueled by AI adoption and cloud infrastructure expansion.
What factors are accelerating GPU server adoption in Asia Pacific?
Key drivers include enterprise digital transformation, government AI initiatives, generative AI applications, hyperscaler investments, and data center modernization across the region.
How does Asia Pacific's GPU server market growth compare to global trends?
Asia Pacific's 37.2% CAGR significantly exceeds the global GPU server market CAGR of 33.6%, establishing the region as the primary growth engine.
RESEARCH METHODOLOGY
The study involved major activities in estimating the current size of the GPU server market. Exhaustive secondary research was done to collect information on GPU servers. The next step was to validate these findings, assumptions, and sizing with industry experts across the value chain using primary research. Different approaches, such as top-down and bottom-up, were employed to estimate the total market size. After that, the market breakup and data triangulation procedures were used to estimate the market size of the segments and subsegments of the GPU server.
Secondary Research
In the secondary research process, various secondary sources were referred to identify and collect information relevant to this study. Secondary sources included annual reports, press releases, and investor presentations of companies; white papers, certified publications, and articles from recognized authors; directories; and databases. Secondary research was mainly carried out to obtain critical information about the industry’s supply chain, value chain, the total pool of key players, and market classification and segmentation according to industry trends, geographic markets, and key developments from both market- and technology-oriented perspectives. Secondary sources included corporate filings (such as annual reports, investor presentations, and financial statements); trade, business, and professional associations; white papers; IoT technologies journals and certified publications; articles by recognized authors; gold- and silver-standard websites; directories; and databases. Data was also collected from secondary sources, such as the Semiconductor Industry Association, Global Semiconductor Alliance, and Taiwan Semiconductor Industry Association.
Secondary research was mainly used to obtain critical information about the supply chain of the industry, the value chain of the market, the total pool of key players, market classification and segmentation according to industry trends to the bottom-most level, geographic markets, and key developments from both the market and technology-oriented perspectives. Secondary data has been gathered and analyzed to determine the overall market size, which has also been validated by primary research.
Primary Research
Extensive primary research was conducted after understanding and analyzing the current scenario of the GPU server market through secondary research. Several primary interviews were held with key opinion leaders from the demand and supply sides in four key regions: North America, Europe, Asia Pacific, and the rest of the world. Nearly 25% of the primary interviews were held with the demand side and 75% with the supply side. The primary data was gathered primarily through telephonic interviews, which were 80% of the total primary interviews. Surveys and e-mails were also utilized to gather data.
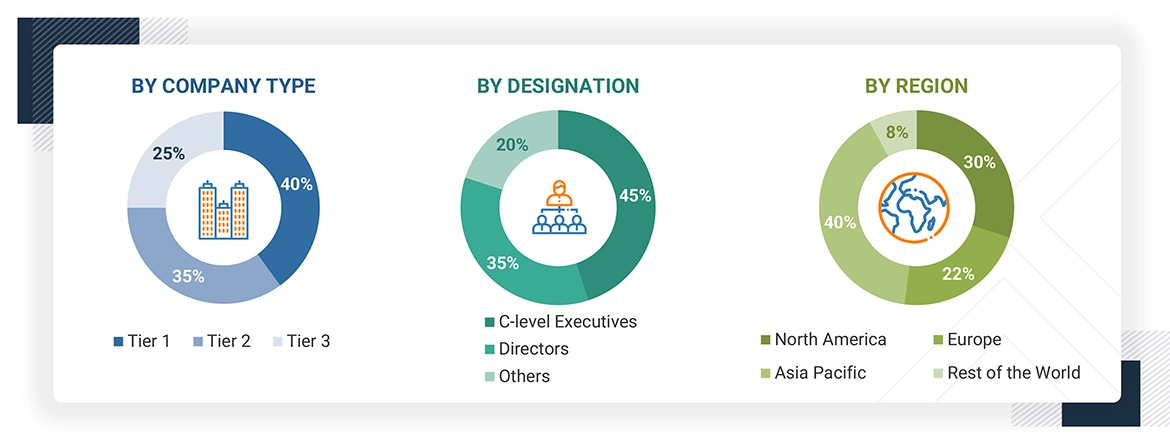
Note: Three tiers of companies are defined based on their total revenue as of 2024; tier 1: revenue more than or equal to USD 500 million, tier 2: revenue between USD 100 million and USD 500 million, and tier 3: revenue less than or equal to USD 100 million. Other designations include sales and marketing executives and researchers, as well as members of various GPU server organizations.
To know about the assumptions considered for the study, download the pdf brochure
Market Size Estimation
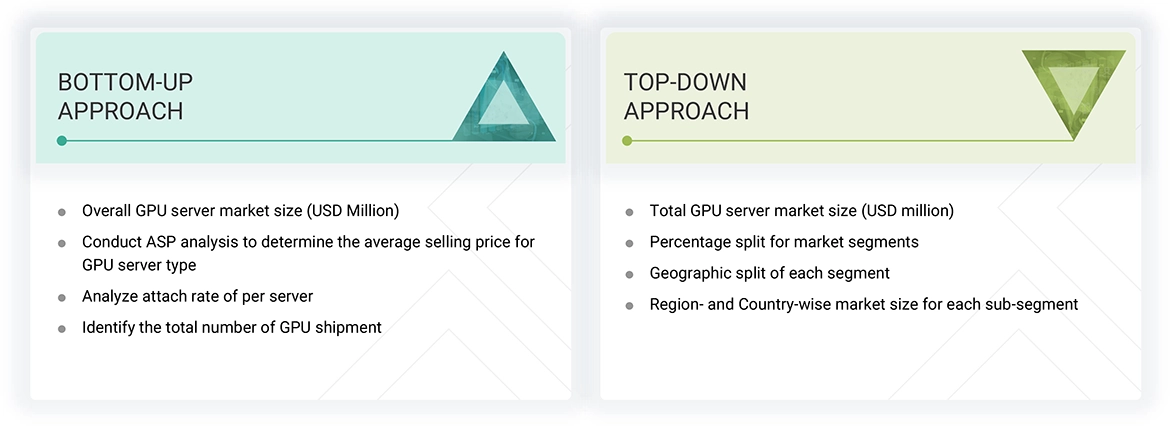
This report implemented both the top-down and bottom-up approaches to estimate and validate the size of the GPU server market and various other dependent submarkets. Secondary research identified key players in this market, and their market shares in the respective regions were determined through primary and secondary research.
This entire research methodology included the study of annual and financial reports of top companies, as well as interviews with experts (such as CEOs, VPs, directors, and marketing executives) for key insights (both quantitative and qualitative). All percentage shares, splits, and breakdowns were determined using secondary sources and verified through primary sources. All the possible parameters that affect the market covered in this research study were accounted for, viewed in detail, verified through primary research, and analyzed to obtain the final quantitative and qualitative data. This data was consolidated and supplemented with detailed inputs and analysis from MarketsandMarkets and presented in this report. The figures given below show the overall market size estimation process employed for this study.
Bottom-Up Approach
- Key players in the GPU server market were identified through secondary research, and their global market share was determined through primary and secondary research.
- The research methodology included a study of annual and quarterly financial reports, regulatory filings of major market players (public), and interviews with industry experts for detailed market insights.
- All GPU server penetration rates, percentage shares, splits, and breakdowns for the GPU server market were determined using secondary sources and verified through primary sources.
- All key macro indicators affecting the revenue growth of the market segments and subsegments were accounted for, viewed in extensive detail, verified through primary research, and analyzed to obtain validated and verified quantitative and qualitative data.
- The gathered market data was consolidated, enhanced with detailed inputs, analyzed, and presented in this report.
Top-Down Approach
- Focusing on top-line investments and expenditures being made in various end user ecosystems.
- Building and developing the information related to the market revenue generated by key GPU server manufacturers.
- Conduct multiple on-field discussions with the key opinion leaders involved in the development of GPU server products for various end users.
- Estimating geographic splits using secondary sources based on various factors, such as the number of players in a specific country and region, and the level of solutions offered to end users.
GPU Server Market : Top-Down and Bottom-Up Approach
Data Triangulation
After arriving at the overall size of the GPU server market from the estimation process explained above, the market was split into several segments and subsegments. The data triangulation and market breakdown procedures were employed (wherever applicable) to complete the overall market engineering process and arrive at the exact statistics for all segments and subsegments. The data was triangulated by studying various factors and trends from both the demand and supply sides. The size of the GPU server market was validated using both top-down and bottom-up approaches.
Market Definition
The GPU server refers to the global domain that comprises the avenues for developing, producing, deploying, and utilizing servers to equip GPU acceleration for computing. CPU servers are very different from GPU servers. On the contrary, GPU servers embrace parallel processing systems and hence are used for HPC, AI, ML, deep learning, data analytics, scientific simulations, graphics rendering, and blockchain mining. GPU servers are utilized heavily in world industries such as Healthcare, BFSI, Media & Entertainment, Automotive, Cloud Computing, Government, and Research Institutions. The market ranges from several types of GPU servers-Entry level, Midrange, and High-end, to various deployment models-On-premises, Cloud, and Hybrid. Rising requirements for AI Workloads, GenAI Models, and Real-time Data Processing are the key drivers of market growth, thereby leading to global demand for capable, high-performance GPU Server Infrastructure.
Key Stakeholders
- Government, financial institutions, and investment communities
- Analysts and strategic business planners
- Semiconductor product designers and fabricators
- Application providers
- AI platform providers
- Server OEM/ODM
- Business providers
- Professional service/solution providers
- Research organizations
- Technology standard organizations, forums, alliances, and associations
- Technology investors
Report Objectives
- To define, describe, segment, and forecast the GPU server market size, by function, cooling technology, form factor, deployment, application, and end-user Industry, in terms of value
- To forecast the market, based on function, in terms of volume
- To assess the market size of four key regions, namely, North America, Europe, Asia Pacific, and the RoW, in terms of value
- To present detailed information regarding the major factors influencing the growth of the market (drivers, restraints, opportunities, and challenges)
- To provide an ecosystem analysis, Investment and funding analysis, case study analysis, patent analysis, technology analysis, key conferences and events, ASP analysis, Porter’s Five Forces analysis, Key stakeholders and buying criteria, and regulations pertaining to the market
- To offer a comprehensive overview of the value chain of the GPU server market ecosystem
- To critically analyze micromarkets with respect to individual growth trends, prospects, and contributions to the total market
- To strategically profile the key players and comprehensively analyze their market shares and core competencies
- To assess the opportunities in the market for stakeholders and describe the competitive landscape of the market
- To analyze competitive developments in the market, such as collaborations, partnerships, product developments, and research and development (R&D)
- Inclusion of the Macroeconomic Impact market
Available customizations:
With the market data given, MarketsandMarkets offers customizations according to the company’s specific needs. The following customization options are available for the report:
Company Information
- Detailed analysis and profiling of additional market players (up to 7)
Get the Full GPU Server Market Report
Full forecast, segment splits, and company analysis for all GPU Server Market.
- US GPU Server Market
- Canada GPU Server Market
- Mexico GPU Server Market
- Germany GPU Server Market
- UK GPU Server Market
- France GPU Server Market
- Spain GPU Server Market
- Italy GPU Server Market
- Rest Of Europe GPU Server Market
- China GPU Server Market
- Japan GPU Server Market
- India GPU Server Market
- South Korea GPU Server Market
- Rest Of Asia Pacific GPU Server Market
- GCC GPU Server Market
- Rest Of Middle East GPU Server Market
- Rest Of GCC GPU Server Market
- UAE GPU Server Market
Need a Tailored Report?
Customize this report to your needs
Get 10% FREE Customization
Customize This Report
