
Netherlands Leukapheresis Market (2026-2031)

The Netherlands Leukapheresis Market was valued at $0.75 Million in 2026 and projected to reach to $1.04 Million by 2031, representing a compound annual growth rate of 6.9%. The Netherlands leukapheresis market demonstrates robust growth potential driven by increasing adoption of advanced cellular therapies and rising hematologic malignancy cases.


| Market Size in | USD 26.32 MN |
| Market Forecast in | |
| CAGR | |
| Forecast Period | |
| Units Considered | Value (USD MN) |
Netherlands Leukapheresis Market Trends and Insights
- This growth trajectory reflects increasing adoption of leukapheresis procedures across Dutch healthcare facilities, driven by rising prevalence of hematologic malignancies and expanding CAR-T cell therapy applications in the Netherlands.
- The Dutch market benefits from advanced healthcare infrastructure and strong reimbursement frameworks that support cell therapy innovations. In the Netherlands, leukapheresis demand is being propelled by growing investment in immunotherapy treatments and enhanced clinical capabilities within major medical centers.
- The forecast period through 2031 indicates steady market expansion as Netherlands healthcare providers continue to integrate leukapheresis technology into standard treatment protocols.
- Market growth in the Netherlands is supported by collaborative research initiatives and increasing patient access to cutting-edge cellular therapies..
Key Market Statistics
- CAGR (2026-2031) 6.9% CAGR
- Market Size, 2026 ~USD 0.75 Million
- Forecast, 2031 ~USD 1.04 Million
- Country Netherlands
Netherlands Leukapheresis Market Overview
Market Size & Growth :
The Netherlands leukapheresis market is valued at $0.75 million in 2026 and is projected to reach $1.04 million by 2031, with a steady CAGR of 6.9%, outpacing many European counterparts in adoption rates.
CAR-T Cell Therapy Expansion :
Dutch healthcare institutions are increasingly integrating leukapheresis procedures to support CAR-T cell immunotherapy programs, driven by regulatory approvals and growing patient eligibility across hematologic malignancies.
Hematologic Malignancy Prevalence :
Rising incidence of leukemia, lymphoma, and multiple myeloma in the Netherlands is fueling demand for leukapheresis procedures, with improved diagnostic capabilities identifying more candidates for cell-based therapies.
Healthcare Infrastructure Investment :
Dutch hospitals and specialized treatment centers are upgrading apheresis equipment and training personnel, reflecting commitment to advanced cellular therapies and positioning the Netherlands as a regional treatment hub.
Netherlands Leukapheresis Market Dynamics
- Dutch healthcare providers are investing in state-of-the-art apheresis technology and specialized treatment centers, supported by strong regulatory frameworks and reimbursement policies that facilitate patient access to CAR-T and other cell-based therapies. Over the 2026-2031 forecast period, the market will benefit from expanding clinical applications, growing physician awareness, and improved patient outcomes data.
- Strategic partnerships between Dutch hospitals and international biotech firms, combined with ongoing clinical trials, will accelerate procedure adoption.
- The 6.9% CAGR reflects steady market maturation as leukapheresis becomes standard practice in Dutch oncology and hematology departments..
Market Ecosystem
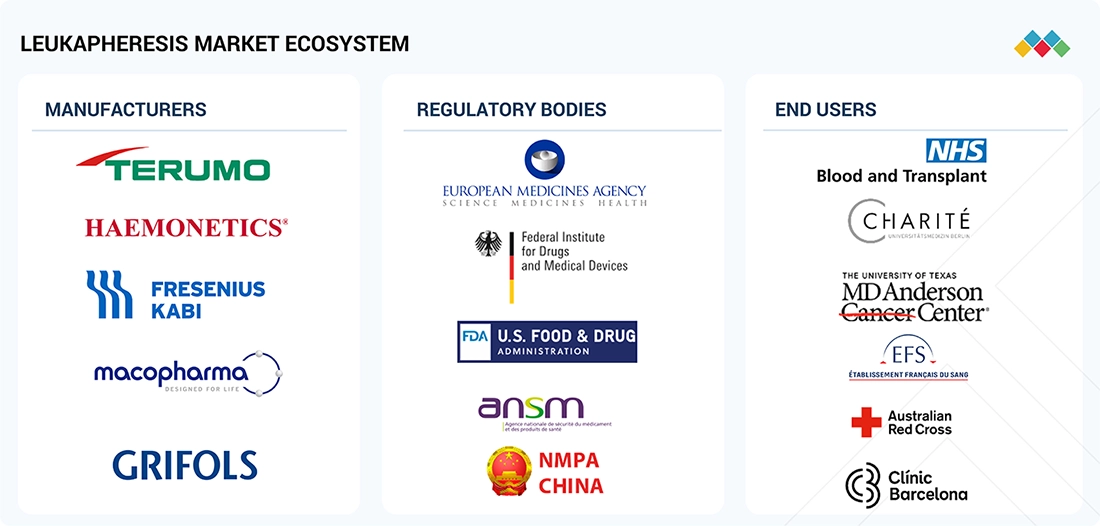
LEUKAPHERESIS MARKET: COMMERCIAL USE CASES ACROSS INDUSTRIES
| COMPANY | USE CASE DESCRIPTION | BENEFITS |
|---|---|---|
 |
Provides the Spectra Optia Apheresis System, one of the most widely used continuous-flow centrifugal devices for therapeutic leukapheresis, mononuclear cell collection, and immune cell harvesting | Used extensively in CGT workflows to collect high-quality starting material for CAR-T and TCR-T manufacturing | High automation, real-time monitoring, customizable protocols, and superior MNC yield support reproducible collections for both clinical and manufacturing settings | Its broad clinical indication library and integrated disposable kits ensure consistency, safety, and scalability |
 |
Provides leukapheresis systems and disposables widely used in hospitals for therapeutic leukocyte reduction and standardized cell collection supporting hematology and oncology workflows | Strong reliability, broad hospital penetration in Europe, integrated consumables portfolio, and compliance with EU clinical and safety standards ensure consistent procedural outcomes |
 |
Supplies automated apheresis platforms used for efficient leukocyte separation in therapeutic leukapheresis and immune cell collection for advanced clinical applications | High automation improves cell yield consistency, reduces procedure time, enhances patient safety, and supports scalable adoption in busy European apheresis centers |
 |
Miltenyi’s CliniMACS Prodigy automates cell processing using leukapheresis-derived inputs, supporting T-cell enrichment, activation, and genetic modification. Their leukopak handling workflows are critical to CGT manufacturing | Closed, automated GMP-compliant processing improves cell viability, reduces operator error, and accelerates manufacturing timelines for CAR-T and other advanced therapies |
 |
Offers apheresis disposables and blood processing solutions supporting leukapheresis procedures within European hospitals and transfusion services | Cost-effective consumables, strong regional presence, and alignment with European blood safety regulations support reliable and compliant leukapheresis operations |
 |
Provides leukapheresis-related systems and blood management solutions used in therapeutic leukocyte reduction and research-grade cell collection across Europe | Deep expertise in blood therapies, strong transfusion network integration, and regulatory experience enable safe procedures and dependable access to leukocyte products |
Logos and trademarks shown above are the property of their respective owners. Their use here is for informational and illustrative purposes only.
Related Ecosystem
Key Takeaways
- Netherlands leukapheresis market valued at $0.75M in 2026, growing to $1.04M by 2031 at 6.9% CAGR
- Advanced Dutch healthcare infrastructure and reimbursement support leukapheresis adoption and market expansion
- Rising hematologic malignancy prevalence and CAR-T cell therapy expansion drive Netherlands market growth
- Collaborative research and clinical integration initiatives strengthen leukapheresis accessibility across Netherlands facilities
Leukapheresis Market Report Scope
| Report Metric | Details |
|---|---|
| Base Year | 2026 |
| Fastest Growing Segment | MULTIPLE MYELOMA (Indication) |
| Forecast Period | 2026–2031 |
| Growth Rate | CAGR of 8.9% from 2026 to 2031 |
| Largest Segment | ACUTE LYMPHOCYTIC LEUKEMIA (Indication) |
| Market Size Base Year (Billions) | ~USD 0.09 (2026) |
| Revenue Forecast (Billions) | ~USD 0.14 (2031) |
| Segments Covered | Product Type, Product Type 2024–2031, Type, Application, End User, Indication, Leukopak Type |
Netherlands Leukapheresis Market Report Segmentation
7 segment dimensions are covered across the global market.
By Product Type
- Devices
- Disposables
- Leukapheresis Devices
- Leukapheresis Disposables
By Product Type 2024–2031
- Collection Kits & Accessories
- Filters & Membrane Consumables
- Tubing Sets & Collection Bag
By Type
- Australia
- Belgium
- Brazil
- Canada
- Centrifugal Devices
- China
- Diseased Leukopaks
- France
- Germany
- India
- Isolated Pbmcs
- Italy
- Japan
- Kingdom Of Saudi Arabia (Ksa)
- Membrane Separators
- Mexico
- Mobilized Leukopaks
- Netherlands
- New Zealand
- Non-Mobilized Leukopaks
- Poland
- Rest Of Asia Pacific
- Rest Of Europe
- Rest Of GCC Countries
- Rest Of Latin America
- Rest Of Middle East & Africa
- South Korea
- Spain
- Switzerland
- Thailand
- UK
- United Arab Emirates (UAE)
- US
By Application
- Research Applications
- Therapeutic Applications
By End User
- Academic & Research Institutes
- Blood Component Providers & Blood Centers
- Contract Research Organizations
- Hospitals & Transfusion Centers
- Pharmaceutical & Biotechnology Companies
By Indication
- Acute Lymphocytic Leukemia
- Chronic Lymphocytic Leukemia
- Hepatocellular Carcinoma
- Multiple Myeloma
- Non-Hodgkin’S Lymphoma
- Other Indications
- Pancreatic Cancer
By Leukopak Type
- Diseased Leukopaks
- Isolated Pbmcs
- Mobilized Leukopaks
- Non-Mobilized Leukopaks
NETHERLANDS: LEUKOPAKS MARKET, BY END USER, 2024–2031
| Segment | 2024 | 2025 | 2026 | 2027 | 2028 | 2029 | 2030 | 2031 | CAGR (%) |
|---|---|---|---|---|---|---|---|---|---|
| ACADEMIC & RESEARCH INSTITUTES | 3.17 | 3.44 | 3.74 | 4.08 | 4.45 | 4.87 | 5.34 | 5.87 | 9.4 |
| CONTRACT RESEARCH ORGANIZATIONS | 0.24 | 0.26 | 0.28 | 0.29 | 0.31 | 0.34 | 0.36 | 0.39 | 7 |
| PHARMACEUTICAL & BIOTECHNOLOGY COMPANIES | 0.99 | 1.09 | 1.21 | 1.33 | 1.48 | 1.64 | 1.83 | 2.04 | 11 |
| TOTAL | 4.41 | 4.79 | 5.22 | 5.71 | 6.24 | 6.85 | 7.53 | 8.3 | 9.7 |
NETHERLANDS: LEUKAPHERESIS MARKET, BY END USER, 2024–2031
| Segment | 2024 | 2025 | 2026 | 2027 | 2028 | 2029 | 2030 | 2031 | CAGR (%) |
|---|---|---|---|---|---|---|---|---|---|
| ACADEMIC & RESEARCH INSTITUTES | 0.12 | 0.12 | 0.13 | 0.14 | 0.15 | 0.16 | 0.17 | 0.18 | 6.5 |
| BLOOD COMPONENT PROVIDERS & BLOOD CENTERS | 0.41 | 0.44 | 0.47 | 0.51 | 0.55 | 0.59 | 0.64 | 0.69 | 8 |
| HOSPITALS & TRANSFUSION CENTERS | 0.22 | 0.23 | 0.25 | 0.27 | 0.28 | 0.31 | 0.33 | 0.35 | 7.3 |
| PHARMACEUTICAL & BIOTECHNOLOGY COMPANIES | 0.07 | 0.07 | 0.08 | 0.08 | 0.09 | 0.09 | 0.1 | 0.1 | 5.3 |
| TOTAL | 0.81 | 0.87 | 0.93 | 0.99 | 1.07 | 1.15 | 1.23 | 1.33 | 7.4 |
Target Audience
- Medical Device Manufacturers : Apheresis equipment and leukapheresis system manufacturers need Netherlands-specific market data to develop localized go-to-market strategies, identify key hospital accounts, and optimize product positioning for Dutch healthcare procurement.
- Pharmaceutical & Biotech Companies : CAR-T cell therapy developers and immunotherapy firms require detailed Netherlands market insights to plan clinical trial sites, establish treatment partnerships with Dutch centers, and forecast patient populations for cell therapy applications.
- Healthcare Consultants & Advisors : Strategy consultants supporting healthcare clients in the Netherlands need localized leukapheresis market data to inform investment decisions, competitive analysis, and market entry strategies for cellular therapy services.
- Hospital & Treatment Center Administrators : Dutch hospital leadership and oncology department heads require market benchmarking data to justify capital investments in apheresis technology, assess competitive positioning, and plan service expansion for leukapheresis procedures.
- Investment & Private Equity Firms : Healthcare investors evaluating opportunities in Dutch medical services need Netherlands-specific market sizing and growth forecasts to assess investment returns in leukapheresis centers and cellular therapy infrastructure.
Key Companies in the Netherlands Leukapheresis Market
| Company | HQ | Ownership | Strongest segments |
|---|---|---|---|
| MAXCYTE, INC | United States | Public Company | ExPERT instruments (ATx, STx, GTx, VLx),Disposable processing assemblies (PAs) and consumables,Licensing and technology access fees, |
MAXCYTE, INC
MaxCyte, Inc. is a United States-based biotechnology company founded in 1998 that specializes in cell engineering technologies. As a publicly traded company, MaxCyte operates with 91 employees and develops innovative solutions for cell-based therapies and research applications.
Reasons to Buy this Report
- Localized Market Intelligence : Gain Netherlands-specific insights on market size, growth trajectories, and competitive dynamics that generic global reports cannot provide, enabling precise strategic planning for Dutch market entry or expansion.
- Healthcare Provider Targeting : Identify key Dutch hospitals, treatment centers, and apheresis facilities driving leukapheresis adoption, with detailed information on procurement patterns and technology preferences specific to the Netherlands healthcare system.
- Regulatory & Reimbursement Clarity : Understand Dutch regulatory pathways, insurance coverage policies, and reimbursement mechanisms for leukapheresis procedures, critical for pricing strategy and market access planning in the Netherlands.
- CAR-T Therapy Opportunity Assessment : Evaluate the expanding CAR-T cell therapy market in the Netherlands with patient population data, clinical trial activity, and adoption rates among Dutch oncology centers to identify growth opportunities.
- Competitive Positioning : Benchmark your leukapheresis solutions against established competitors in the Dutch market, with insights on market share, technology preferences, and unmet clinical needs specific to Dutch healthcare providers.
Frequently asked questions
What is the current market size of leukapheresis in the Netherlands?
The Netherlands leukapheresis market is estimated at $0.75 million in 2026.
What is the projected market size for leukapheresis in the Netherlands by 2031?
The Netherlands leukapheresis market is projected to reach $1.04 million by 2031.
What is the CAGR for the leukapheresis market in the Netherlands?
The Netherlands leukapheresis market is expected to grow at a compound annual growth rate of 6.9% from 2026 to 2031.
What factors are driving leukapheresis market growth in the Netherlands?
Key growth drivers in the Netherlands include rising hematologic malignancy prevalence, expanding CAR-T cell therapy applications, advanced healthcare infrastructure, and strong reimbursement frameworks supporting cell therapy innovations.
How does the Netherlands leukapheresis market compare to global trends?
The Netherlands market grows at 6.9% CAGR, slightly below the global average of 8.9%, reflecting the mature healthcare system and established clinical practices in the Netherlands.
RESEARCH METHODOLOGY
This study extensively used both primary and secondary sources. The research involved studying various factors affecting the industry to identify segmentation types, industry trends, key players, competitive landscape, key market dynamics, and key player strategies.
Secondary Research
This research study involved the usage of comprehensive secondary sources, directories, databases such as Bloomberg Business, Factiva, and Dun & Bradstreet; white papers; annual reports; company house documents; investor presentations; and SEC filings of companies. Secondary research was used to identify and collect information useful for an extensive, technical, market-oriented, and commercial study of the leukapheresis market. It was also used to identify key players in the market and classify and segment the industry based on trends to the most detailed level. Additionally, significant developments related to market and technology perspectives were noted. A database of the primary industry leaders was also created using secondary research.
Primary Research
In the primary research process, various sources from both the supply and demand sides were interviewed to obtain qualitative and quantitative information for this report. Primary sources from the supply side include project/sales/marketing/business development managers, presidents, CEOs, vice presidents, chairpersons, chief operating officers, chief strategy officers, directors, chief information officers, and chief medical information officers related to the leukapheresis market. Primary sources from the demand side include healthcare professionals from blood component providers & blood centers, academic & research institutes, pharmaceutical & biotechnology companies, and hospitals & transfusion centers.
A breakdown of the primary respondents is provided below:
BREAKDOWN OF PRIMARY INTERVIEWS: SUPPLY-SIDE PARTICIPANTS, BY COMPANY TYPE, DESIGNATION, AND REGION
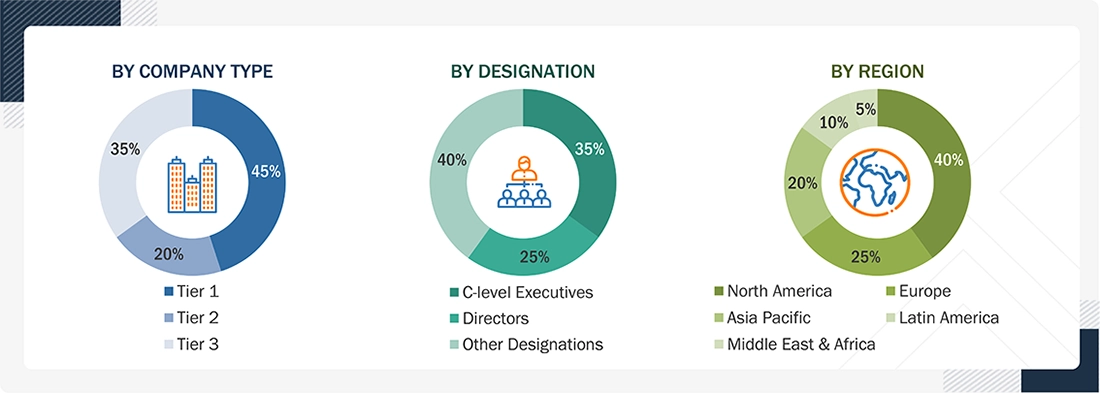
Note 1: C-level executives include CEOs, COOs, CTOs, and VPs.
Note 2: Other designations include sales, marketing, and product managers.
Note 3: Tiers are defined based on a company’s total revenue. As of 2024: Tier 1 = >USD 1 billion, Tier 2 = USD 500 million to USD 1 billion, and Tier 3 = <USD 500 million
To know about the assumptions considered for the study, download the pdf brochure
Market Size Estimation
The total size of the leukapheresis market was determined after data triangulation from three approaches, as mentioned below. After each approach, the weighted average of the three approaches was taken based on the level of assumptions used in each approach.
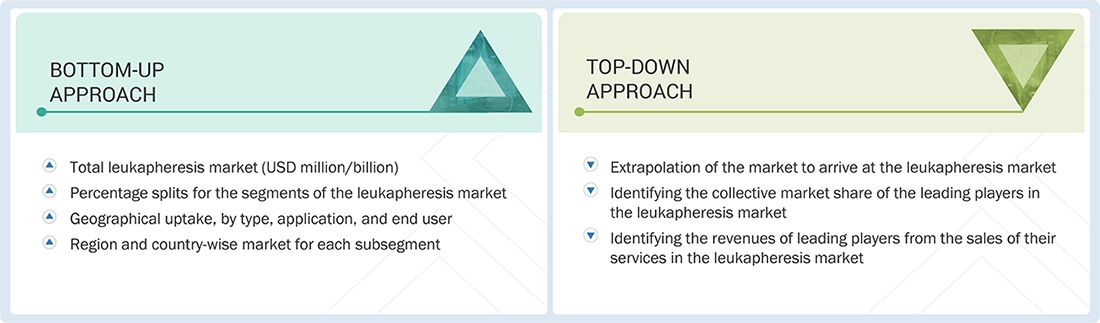
Data Triangulation
After arriving at the market size, the total market was divided into several segments and subsegments. Data triangulation and market breakdown procedures were employed wherever applicable to complete the overall market engineering process and arrive at the exact statistics for all segments and subsegments.
Market Definition
Leukapheresis is the process of separating white blood cells from the whole blood. Therapeutic leukapheresis procedures are used to treat hyperleukocytic leukemia, including acute lymphoblastic leukemia (ALL), chronic lymphocytic leukemia (CLL), multiple myeloma, and non-Hodgkin’s lymphoma.
Leukopaks are enriched leukapheresis products that contain mononuclear leukocytes (lymphocytes and monocytes) and are used to develop cell-based therapeutics
Key Stakeholders
- Apheresis device manufacturers and distributors
- Leukapheresis product manufacturers and distributors
- Leukopak manufacturers and distributors
- Pharmaceutical and biotechnology companies
- Healthcare service providers (including hospitals and transfusion centers)
- Cancer treatment centers
- Blood component providers & blood centers
- Contract research organizations (CROS)
- Academic and research institutes
- Government associations
- Market research and consulting firms
- Venture capitalists and investors
Report Objectives
- To define, describe, segment, and forecast the leukapheresis market by type, application, end user, and region, and the leukopaks market, by type, indication, end user, and region
- To provide detailed information about the factors influencing market growth (such as drivers, restraints, opportunities, and challenges)
- To analyze micromarkets with respect to individual growth trends, prospects, and contributions to the overall leukapheresis market
- To analyze market opportunities for stakeholders and provide details of the competitive landscape for key players
- To forecast the size of the leukapheresis market in five main regions (along with their respective key countries), namely, North America, Europe, Asia Pacific, Latin America, and the Middle East & Africa
- To profile the key players in the leukapheresis market and comprehensively analyze their core competencies and market share
- To track and analyze competitive developments such as acquisitions, product launches, expansions, collaborations, agreements, and partnerships
Available customizations:
With the given market data, MarketsandMarkets offers customizations to meet your company’s specific needs. The following customization options are available for the report:- Company Information
Detailed analysis and profiling of additional market players (up to 5)
- Geographic Analysis
Further breakdown of the Rest of Europe leukapheresis market into Austria, Finland, and other countries
Further breakdown of the Rest of Latin America leukapheresis market into Colombia, Chile, and other countries
- Competitive Landscape Assessment
Market share analysis for North America and Europe, which provides market shares of the top 3–5 key players in the leukapheresis market
Competitive leadership mapping for established players in the US
Get the Full Leukapheresis Market Report
Full forecast, segment splits, and company analysis for all Leukapheresis Market.
- Canada Leukapheresis Market
- US Leukapheresis Market
- Germany Leukapheresis Market
- UK Leukapheresis Market
- Spain Leukapheresis Market
- Italy Leukapheresis Market
- Poland Leukapheresis Market
- Switzerland Leukapheresis Market
- China Leukapheresis Market
- Japan Leukapheresis Market
- India Leukapheresis Market
- Australia Leukapheresis Market
- South Korea Leukapheresis Market
- New Zealand Leukapheresis Market
- Thailand Leukapheresis Market
- Brazil Leukapheresis Market
- Mexico Leukapheresis Market
- Belgium Leukapheresis Market
- France Leukapheresis Market
- Rest Of Europe Leukapheresis Market
- Rest Of Asia Pacific Leukapheresis Market
Need a Tailored Report?
Customize this report to your needs
Get 10% FREE Customization
Customize This Report
