
Europe Micro-inverter Market (2024-2029)

The Europe Micro-inverter Market was valued at $910 Million in 2024 and projected to reach to $2755.5 Million by 2029, representing a compound annual growth rate of 24.8%. Europe's micro-inverter market is positioned for exceptional growth through 2029, driven by stringent carbon reduction targets and the continent's transition toward distributed renewable energy systems.


| Market Size in | USD 26.32 MN |
| Market Forecast in | |
| CAGR | |
| Forecast Period | |
| Units Considered | Value (USD MN) |
Europe Micro-inverter Market Trends and Insights
- This represents a compound annual growth rate of 24.8%, significantly outpacing global trends and reflecting Europe's strong commitment to renewable energy adoption.
- Europe's regulatory framework, including the EU's Green Deal and renewable energy directives, is driving widespread deployment of distributed solar systems that rely on micro-inverter technology. The growth trajectory in Europe is underpinned by increasing residential and commercial solar installations across key markets including Germany, Italy, Spain, and France.
- Europe's aging grid infrastructure and push toward decentralization make micro-inverters an attractive solution for optimizing energy efficiency and grid stability.
- Between 2024 and 2029, Europe is expected to capture significant market share as manufacturers expand production capacity and costs continue to decline, making micro-inverter systems more accessible to mid-market and residential consumers throughout the region..
Key Market Statistics
- CAGR (2024-2029) 24.8% CAGR
- Market Size, 2024 ~USD 910 Million
- Forecast, 2029 ~USD 2755.5 Million
- Geography Europe
Europe Micro-inverter Market Overview
Market Leadership Position :
Europe's micro-inverter market commands $910.0 million in 2024, with a 24.8% CAGR outpacing the global average of 24.1%, establishing the region as a critical growth driver in renewable energy infrastructure.
Regulatory Momentum :
The EU Green Deal and renewable energy directives create a favorable regulatory environment, mandating increased solar adoption across member states and accelerating micro-inverter deployment in residential and commercial installations.
Projected Market Expansion :
The European market is forecast to nearly triple to $2,755.5 million by 2029, driven by declining hardware costs, grid modernization initiatives, and rising consumer demand for distributed energy solutions.
Regional Leadership by Country :
Germany leads European adoption with $1,168.9 million in market value, followed by the Netherlands ($400.6M) and France ($311.4M), reflecting strong solar infrastructure investments and favorable feed-in tariff policies.
Europe Micro-inverter Market Dynamics
- Government incentives, including subsidies for residential solar installations and net metering policies, are accelerating adoption across residential, commercial, and utility-scale segments.
- The region's mature supply chain and technological innovation ecosystem support competitive pricing and product differentiation. Key growth catalysts include increasing electricity costs, grid decentralization trends, and mandatory renewable energy integration targets.
- European manufacturers and distributors are investing heavily in smart inverter technologies and energy storage integration, positioning the region as a global innovation hub.
- Market consolidation among leading players and strategic partnerships with solar installers will further strengthen market penetration through 2029..
Market Ecosystem
Related Ecosystem
Battery And Wireless Charging
- Nickel-Cadmium Battery
- Battery Electric Vehicle (BEV)
- Energy Harvesting
- Hybrid Electric Vehicle (HEV)
- Smart Cards
- Panasonic Holdings Corporation
- MOMENTIVE PERFORMANCE MATERIALS INC.
- Lg corp
- FDK Corporation
- Samsung
Electronics System And Components
- Sensors
- Temperature Sensors
- Pressure Sensors
- Actuators
- Image Sensors
- Lenovo
- Samsung
- Texas Instruments Incorporated
- HONEYWELL INTERNATIONAL INC.
- Teledyne Technologies Incorporated
Digitalization And Iot
- Sensors
- Remote Monitoring
- Supply Chain Management
- Passenger Information System (PIS)
- Platform as A Service (PaaS)
- International Business Machines Corporation
- Cisco Systems, Inc.
- MICROSOFT CORPORATION
- Oracle Corporation
- HUAWEI TECHNOLOGIES CO LTD
Key Takeaways
- Europe's micro-inverter market will grow from $910.0M (2024) to $2,755.5M (2029) at a 24.8% CAGR, driven by renewable energy mandates and grid modernization initiatives across the region.
- Europe's regulatory environment, including the EU Green Deal and revised Renewable Energy Directive, is accelerating micro-inverter adoption in residential and commercial solar applications.
- Key European markets including Germany, Italy, Spain, and France are leading deployment, supported by favorable feed-in tariffs and net metering policies that incentivize distributed solar generation.
- Declining component costs and increased manufacturing capacity in Europe are expected to improve market accessibility and competitiveness through 2029, benefiting both installers and end consumers.
Micro-inverter Market Report Scope
| Report Metric | Details |
|---|---|
| Base Year | 2024 |
| Fastest Growing Segment | SOFTWARE & SERVICES (Offering) |
| Forecast Period | 2024-2029 |
| Growth Rate | CAGR of 24.1% from 2024 to 2029 |
| Largest Segment | SINGLE-PHASE (Type) |
| Market Size Base Year (Billions) | ~USD 4.93 (2024) |
| Revenue Forecast (Billions) | ~USD 14.5 (2029) |
| Segments Covered | Offering, Communication Technology, Application, Type, Power Rating, Connection Type, Sales Channel, Component |
Europe Micro-inverter Market Report Segmentation
8 segment dimensions are covered across the global market.
By Offering
- Hardware
- Software & Services
By Communication Technology
- Wired
- Wireless
By Application
- Commercial
- Commercial & Industrial
- Pv Power Plants
- Residential
- Utility
By Type
- Single-Phase
- Three-Phase
By Power Rating
- Above 500 W
- Below 250 W
- Between 250 And 500 W
By Connection Type
- Grid-Tied
- Standalone
By Sales Channel
- Direct
- Indirect
By Component
- Balance Of System (Bos)
- Inverter
- Module
EUROPE: MICRO-INVERTER MARKET, BY APPLICATION, 2024–2029
| Segment | 2024 | 2025 | 2026 | 2027 | 2028 | 2029 | CAGR (%) |
|---|---|---|---|---|---|---|---|
| COMMERCIAL | 296.2 | 363.5 | 448.2 | 555.6 | 692.3 | 867.1 | 24 |
| PV POWER PLANTS | 149.5 | 176.9 | 209.9 | 249.6 | 297.5 | 355.4 | 18.9 |
| RESIDENTIAL | 464.3 | 583.6 | 737.3 | 936.2 | 1194.8 | 1533 | 27 |
| TOTAL | 910 | 1124 | 1395.4 | 1741.3 | 2184.6 | 2755.5 | 24.8 |
Target Audience
- Solar Equipment Manufacturers : Develop European market strategies, optimize product portfolios for regional preferences, and identify partnership opportunities with installers and distributors across high-growth markets like Germany and the Netherlands.
- Renewable Energy Investors : Evaluate investment opportunities in European solar infrastructure, assess market growth potential, and benchmark returns against regional CAGR trends and regulatory incentive structures.
- System Integrators & Installers : Understand market demand patterns, competitive pricing dynamics, and customer preferences across European regions to optimize procurement strategies and service offerings.
- Energy Utilities & Grid Operators : Plan grid modernization initiatives, assess distributed generation impacts, and develop strategies for integrating micro-inverter technology into smart grid infrastructure across Europe.
- Policy & Regulatory Bodies : Leverage market data to inform renewable energy targets, subsidy programs, and regulatory frameworks that accelerate micro-inverter adoption and support Europe's decarbonization goals.
Countries within Europe - compare and drill down
| Country | 2025 size (native) |
|---|---|
| Germany | USD 1168.9 Million |
| UK | USD 345.3 Million |
| France | USD 311.4 Million |
| Netherlands | USD 400.6 Million |
| Rest Of Europe | USD 529.3 Million |
Country market size visualization
Reasons to Buy this Report
- Country-Level Market Segmentation : Access detailed market sizing for Germany, UK, France, Netherlands, and Rest of Europe, enabling precise market entry strategies and competitive positioning in high-growth European segments.
- Regulatory & Policy Insights : Understand how EU Green Deal mandates, feed-in tariffs, and renewable energy directives shape market dynamics and create investment opportunities across different European jurisdictions.
- Competitive Landscape Analysis : Identify leading regional players, market consolidation trends, and strategic partnerships driving innovation in European micro-inverter technology and distribution networks.
- Growth Opportunity Mapping : Leverage 24.8% CAGR projections and $1.85 billion incremental market growth to identify high-potential customer segments, geographic expansion targets, and product development priorities.
- Investment Decision Support : Make informed capital allocation decisions with comprehensive market forecasts, trend analysis, and risk assessments specific to Europe's renewable energy transition and grid modernization initiatives.
Frequently asked questions
What is the current size of Europe's micro-inverter market?
Europe's micro-inverter market was valued at $910.0 million in 2024 and is projected to grow to $2,755.5 million by 2029, representing a 24.8% compound annual growth rate.
Which European countries are driving micro-inverter market growth?
Germany, Italy, Spain, and France are the primary growth drivers in Europe, supported by strong renewable energy policies, favorable incentive structures, and high residential solar adoption rates.
What regulatory factors are supporting Europe's micro-inverter adoption?
Europe's micro-inverter market is supported by the EU Green Deal, the revised Renewable Energy Directive, feed-in tariff schemes, and net metering policies that incentivize distributed solar generation across the region.
How does Europe's micro-inverter CAGR compare to global growth?
Europe's micro-inverter market is growing at 24.8% CAGR, which exceeds the global CAGR of 24.1%, indicating that Europe is outpacing worldwide market expansion.
What factors are expected to drive Europe's micro-inverter market through 2029?
Key drivers include declining component costs, increased manufacturing capacity, grid modernization initiatives, residential solar adoption, and Europe's commitment to achieving climate neutrality by 2050.
RESEARCH METHODOLOGY
To estimate the size of the micro-inverter market, the study utilized four major activities. Exhaustive secondary research was conducted to gather information on the market, as well as its peer and parent markets. The next step was to validate these findings, assumptions, and sizing with industry experts across the value chain through primary research. Both top-down and bottom-up approaches were employed to estimate the total market size. Finally, market breakdown and data triangulation methods were utilized to estimate the market size for different segments and subsegments.
Secondary Research
In the secondary research process, various sources have been referred to for identifying and collecting information for this study on the micro-inverter market. Secondary sources for this research study include corporate filings (such as annual reports, investor presentations, and financial statements); trade, business, and professional associations, white papers, certified publications, articles by recognized authors, directories, and databases. The secondary data was collected and analyzed to determine the overall market size, further validated through primary research.
List of key secondary sources
|
SOURCE NAME |
WEBLINK |
|
Department of Energy |
|
|
International Energy Agency |
|
|
United Nations Environment Programme |
|
|
European Environment Agency |
Primary Research
To gather insights on market statistics, revenue data, market breakdowns, size estimations, and forecasting, primary interviews were conducted. Additionally, primary research was used to comprehend the various technology, application, vertical, and regional trends. Interviews with stakeholders from the demand side, including CIOs, CTOs, CSOs, and customer/end-user installation teams using micro-inverter, were also conducted to understand their perspective on suppliers, products, component providers, and their current and future use of micro-inverter, which will impact the overall market. Several primary interviews were conducted across major countries of North America, Europe, Asia Pacific, the Middle East & Africa, and Latin America.
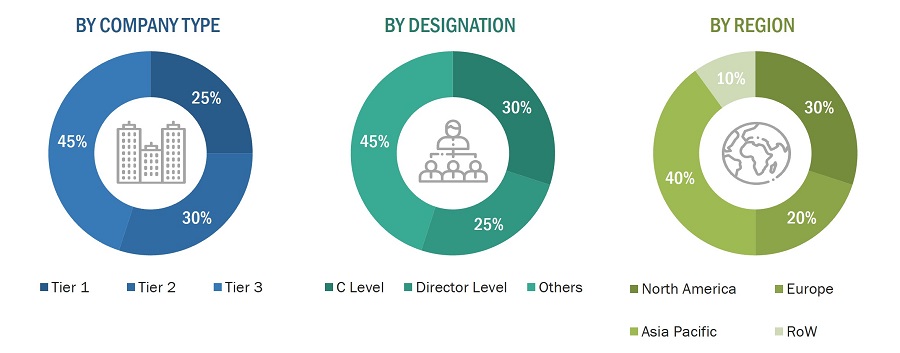
To know about the assumptions considered for the study, download the pdf brochure
Market Size Estimation
To estimate and validate the size of the micro-inverter market and its submarkets, both top-down and bottom-up approaches were utilized. Secondary research was conducted to identify the key players in the market, and primary and secondary research was used to determine their market share in specific regions. The entire process involved studying the annual and financial reports of top players and conducting extensive interviews with industry leaders such as CEOs, VPs, directors, and marketing executives. Secondary sources were used to determine all percentage shares and breakdowns, which were then verified through primary sources. All parameters that could impact the markets covered in this research study were accounted for, analyzed in detail, verified through primary research, and consolidated to obtain the final quantitative and qualitative data.
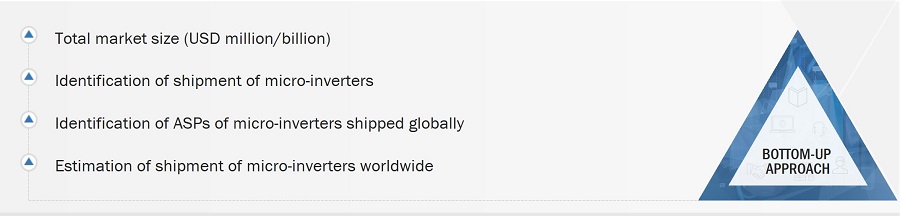
Global Micro-Inverter Market Size: Botton Up Approach
- First, companies offering Micro-Inverter products have been identified, and their product mapping with respect to different parameters, such as offering, communication technology, type, power rating, connection type, sales channel, and application has been carried out.
- The market size has been estimated based on the demand for different types of micro-inverters for different applications. The anticipated change in demand for micro-inverters offered by these companies in the recession and company revenues have been analyzed and estimated.
- Primary research has been conducted with a few major players operating in the micro-inverters market to validate the global market size. Discussions included the recession impact on the micro-inverters ecosystem.
- Then, the size of the micro-inverters market has been validated through secondary sources, which include the International Trade Centre (ITC), world trade organization, and world economic forum.
- The CAGR of the micro-inverters market has been calculated considering the historical and future market trends and the impact of recession by understanding the adoption rate of micro-inverters for different applications.
- The estimates at every level have been verified and cross-checked through discussions with key opinion leaders, such as corporate executives (CXOs), directors, and sales heads, as well as with the domain experts in MarketsandMarkets.
- Various paid and unpaid information sources, such as company websites, annual reports, press releases, research journals, magazines, white papers, and databases, have also been studied.
Global Micro-Inverter Market Size: Top Down Approach
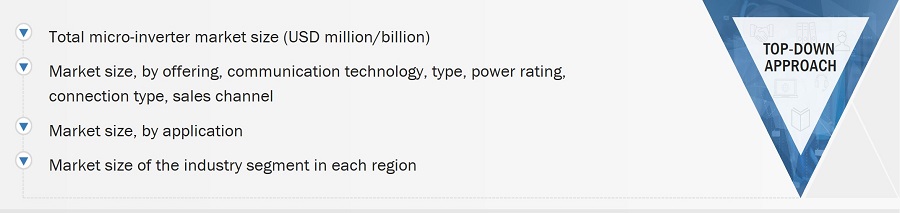
The top-down approach has been used to estimate and validate the total size of the micro-inverter market market.
- Focusing initially on the R&D investments and expenditures being made in the ecosystem of the micro-inverter market, further splitting the market on the basis of offerings, communication technology, type, power rating, connection type, sales channel, and region and listing the key developments.
- Identifying leading players in the micro-inverter market through secondary research and verifying them through brief discussions with industry experts
- Analyzing revenue, product mix, geographic presence, and key applications for which products are served by all identified players to estimate and arrive at percentage splits for all key segments.
- Discussing splits with industry experts to validate the information and identify key growth pockets across all key segments.
- Breaking down the total market based on verified splits and key growth pockets across all segments.
Data Triangulation
Once the overall size of the micro-inverter market was determined using the methods described above, it was divided into multiple segments and subsegments. Market engineering was performed for each segment and subsegment using market breakdown and data triangulation methods, as applicable, to obtain accurate statistics. To triangulate the data, various factors and trends from the demand and supply sides were studied. The market was validated using both top-down and bottom-up approaches.
Market Definition
A micro-inverter is a device used in solar photovoltaic (PV) systems to convert direct current (DC) electricity generated by individual solar panels into alternating current (AC) electricity. Unlike traditional string inverters, which are designed to handle the output of multiple solar panels in a series, micro-inverters operate on a per-panel basis. Micro-inverters are often more flexible in terms of system design and installation. They can be used in complex roof layouts or situations where shading is a concern, offering greater design flexibility. The micro-inverters are used for applications such as residential, commercial, and PV power plants.
Key Stakeholders
- Associations and industrial bodies
- End-user industries
- Government bodies such as regulating authorities and policymakers
- Market research and consulting firms
- Raw material suppliers and distributors
- Research institutes and organizations
- Original equipment manufacturers (OEMs)
- Micro-inverter system manufacturers
- Micro-inverter system traders and suppliers
Report Objectives
- To define, describe, and forecast the micro-inverter market based on offerings, communication technology, type, power rating, connection type, sales channel, application, and region.
- To forecast the market size, in terms of value, for the concerned segments with regard to four main regions, namely, Americas, Europe, Asia Pacific (APAC), and Rest of the World (RoW)
- To strategically analyze the micromarkets with regard to the individual growth trends, prospects, and contribution to the micro-inverter market
- To provide detailed information regarding the major factors (drivers, restraints, opportunities, and industry-specific challenges) influencing the growth of the micro-inverter market
- To analyze opportunities in the market for stakeholders and the details of the competitive landscape for the market leaders
- To provide a detailed overview of the micro-inverter value chain
- To benchmark players within the market using a proprietary “Competitive Leadership Mapping” framework, which analyzes market players on various parameters within the broad categories of business and product strategy
- To analyze competitive developments such as partnerships, acquisitions, expansions, agreements, collaborations, contracts, and product launches, along with research and development (R&D) in the micro-inverter market
- To strategically profile key players of the micro-inverter market and comprehensively analyze their market shares and core competencies
Available Customizations:
With the given market data, MarketsandMarkets offers customizations according to the specific requirements of companies. The following customization options are available for the report:
- Detailed analysis and profiling of additional market players (up to 5)
- Additional country-level analysis of the micro-inverter market
Product Analysis
- Product matrix, which provides a detailed comparison of the product portfolio of each company in the micro-inverter market.
Get the Full Micro-inverter Market Report
Full forecast, segment splits, and company analysis for all Micro-inverter Market.
- US Micro-inverter Market
- Canada Micro-inverter Market
- Mexico Micro-inverter Market
- Germany Micro-inverter Market
- UK Micro-inverter Market
- France Micro-inverter Market
- Netherlands Micro-inverter Market
- Rest Of Europe Micro-inverter Market
- China Micro-inverter Market
- India Micro-inverter Market
- Japan Micro-inverter Market
- Australia Micro-inverter Market
- Rest Of Asia Pacific Micro-inverter Market
Need a Tailored Report?
Customize this report to your needs
Get 10% FREE Customization
Customize This Report
