
Asia Pacific Microspheres Market (2026-2031)

The Asia Pacific Microspheres Market was valued at $1226.1 Million in 2026 and projected to reach to $1847.1 Million by 2031, representing a compound annual growth rate of 8.54%. The Asia Pacific microspheres market is poised for sustained growth through 2031, driven by rapid industrialization, expanding pharmaceutical manufacturing capabilities, and increasing healthcare expenditures across the region.


| Market Size in | USD 26.32 MN |
| Market Forecast in | |
| CAGR | |
| Forecast Period | |
| Units Considered | Value (USD MN) |
Asia Pacific Microspheres Market Trends and Insights
- Asia Pacific's growth trajectory reflects increasing demand across pharmaceuticals, cosmetics, and industrial applications, driven by rapid industrialization and rising healthcare investments across the region.
- The Asia Pacific microspheres market benefits from expanding manufacturing capabilities and growing adoption of advanced material technologies in emerging economies. Asia Pacific is positioned as a critical growth hub for microspheres, with a compound annual growth rate of 8.54% through the forecast period.
- The region's market expansion is supported by rising consumer spending, regulatory improvements, and strategic investments in research and development.
- Asia Pacific's competitive landscape features both established players and emerging manufacturers capitalizing on cost advantages and regional supply chain integration..
Key Market Statistics
- CAGR (2026-2031) 8.54% CAGR
- Market Size, 2026 ~USD 1226.1 Million
- Forecast, 2031 ~USD 1847.1 Million
- Geography Asia Pacific
Asia Pacific Microspheres Market Overview
Rapid Market Expansion :
Asia Pacific microspheres market is valued at USD 1,226.1 million in 2026 and projected to grow to USD 1,847.1 million by 2031, representing a strong 8.54% CAGR driven by regional industrialization.
China's Market Dominance :
China leads the Asia Pacific region with a market size of USD 950.5 million, accounting for over 77% of the regional market and serving as the primary growth engine for microsphere applications.
Diverse Application Growth :
Increasing demand across pharmaceuticals, cosmetics, and industrial applications in Asia Pacific is fueled by rising healthcare investments, expanding manufacturing sectors, and growing consumer spending in emerging economies.
Strategic Regional Positioning :
Japan (USD 305.2M) and India (USD 222.1M) represent significant secondary markets, with growing pharmaceutical and cosmetic industries creating substantial opportunities for microsphere manufacturers.
Asia Pacific Microspheres Market Dynamics
- China's dominance as a manufacturing hub, combined with India's emerging pharmaceutical sector and Japan's advanced cosmetics industry, creates a diversified demand landscape.
- Rising investments in R&D and growing adoption of microspheres in drug delivery systems and cosmetic formulations will accelerate market penetration. Key growth catalysts include regulatory support for pharmaceutical innovation, expanding middle-class consumer bases, and technological advancements in microsphere production.
- The region's competitive manufacturing costs and skilled workforce position Asia Pacific as a critical hub for both microsphere production and consumption, supporting the projected 8.54% CAGR through 2031..
Market Ecosystem
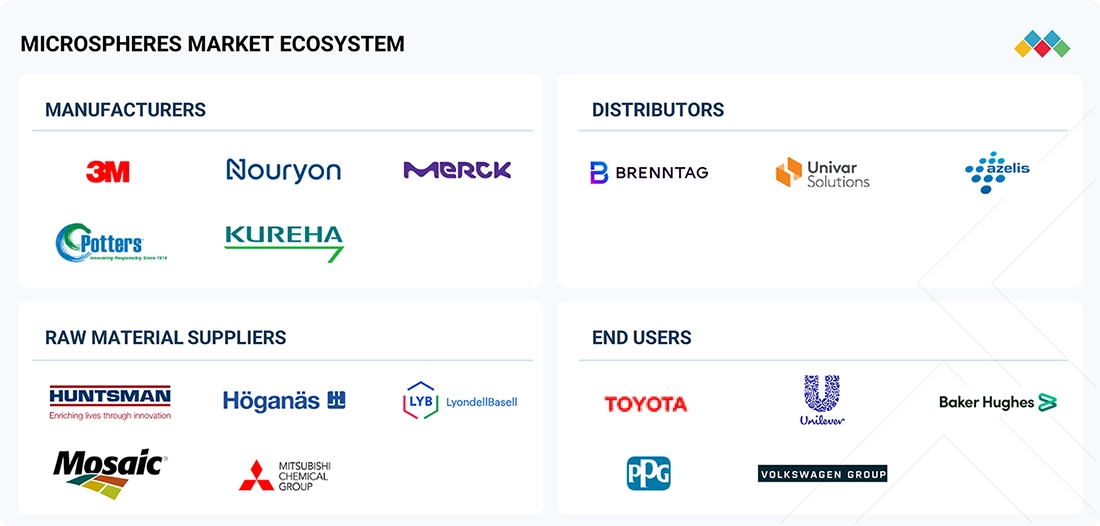
MICROSPHERES MARKET: COMMERCIAL USE CASES ACROSS INDUSTRIES
| COMPANY | USE CASE DESCRIPTION | BENEFITS |
|---|---|---|
 |
Use of polymeric microspheres in skincare and cosmetic formulations for texture enhancement and controlled release of active ingredients. | Improved product feel and spreadability, enhanced sensory appeal, controlled ingredient delivery, and better formulation stability. |
 |
Incorporation of hollow microspheres in industrial and architectural coatings to improve film build and reduce weight. | Enhanced coverage efficiency, reduced paint consumption, improved insulation properties, and consistent surface finish. |
 |
Use of microspheres in lightweight composite components and underbody coatings for vehicle weight reduction. | Improved fuel efficiency, reduced vehicle weight, enhanced corrosion resistance, and better noise and vibration damping. |
 |
Deployment of hollow microspheres in drilling fluids and cementing systems for density control and thermal insulation. | Optimized fluid performance, improved well stability, reduced operational risks, and enhanced efficiency in deep-well drilling operations. |
Logos and trademarks shown above are the property of their respective owners. Their use here is for informational and illustrative purposes only.
Related Ecosystem
Ceramics And Glass
- Zirconia
- Alumina Ceramics
- Silicon Carbide
- Silicon Nitride
- Titanate Ceramics
- Saint-gobain
- 3M COMPANY
- CERAMTEC GMBH
- Kyocera Corporation
- COORSTEK INCORPORATED
Infrastructure Material
- Alumina Ceramics
- Ceramic Coatings
- Monolithic Ceramics
- Polyphenylene Sulfide (PPS)
- Titanate Ceramics
- Saint-gobain
- Simpson Manufacturing Co., Inc.
- Sika ag
- DOW CHEMICAL COMPANY
- Basf se
Key Takeaways
- Asia Pacific microspheres market will grow from USD 1,226.1M (2026) to USD 1,847.1M (2031) at 8.54% CAGR
- Asia Pacific demand is driven by pharmaceutical, cosmetic, and industrial applications across emerging economies
- Asia Pacific manufacturing expansion and supply chain integration create competitive advantages for regional players
- Asia Pacific regulatory improvements and R&D investments accelerate market adoption and innovation
Microspheres Market Report Scope
| Report Metric | Details |
|---|---|
| Base Year | 2026 |
| Fastest Growing Segment | MEDICAL TECHNOLOGY (Application) |
| Forecast Period | 2026–2031 |
| Growth Rate | CAGR of 8.23% from 2026 to 2031 |
| Largest Segment | INDUSTRIAL (End-Use Industry) |
| Market Size Base Year (Billions) | ~USD 4.36 (2026) |
| Revenue Forecast (Billions) | ~USD 6.47 (2031) |
| Segments Covered | End-Use Industry, Raw Material, Type, Application, Sub-Application |
Asia Pacific Microspheres Market Report Segmentation
5 segment dimensions are covered across the global market.
By End-Use Industry
- Architectural
- Industrial
By Raw Material
- Ceramic
- Fly Ash
- Glass
- Metallic
- Other Raw Materials
- Polymer
By Type
- Hollow
- Solid
By Application
- Aerospace
- Automotive
- Building & Construction
- Cosmetics & Personal Care
- Life Science & Biotechnology
- Medical Technology
- Oil & Gas
- Other Applications
- Paints & Coatings
By Sub-Application
- Adhesives & Sealants
- Architectural Paints & Coatings
- Foams & Composites
- Industrial Coatings & Powder Coatings
- Insulation Boards & Plasters
- Lightweight Composite
Target Audience
- Pharmaceutical Manufacturers : Leverage Asia Pacific microspheres market data to develop drug delivery systems, optimize formulations for regional markets, and identify partnership opportunities in China, India, and Japan.
- Cosmetics & Personal Care Companies : Utilize regional market insights to expand cosmetic microsphere product lines, understand consumer preferences across Asia Pacific, and capitalize on growing beauty and skincare demand.
- Chemical & Material Suppliers : Access supply chain intelligence and demand forecasts to optimize production capacity, identify distribution channels, and establish strategic partnerships with regional manufacturers.
- Investment & Private Equity Firms : Evaluate investment opportunities in Asia Pacific microsphere companies, assess market growth potential, and identify acquisition targets in high-growth countries like China and India.
- Market Researchers & Consultants : Utilize comprehensive Asia Pacific market data, country-level insights, and growth forecasts to support client strategy development, competitive analysis, and market entry planning.
Key Companies in the Asia Pacific Microspheres Market
| Company | HQ | Ownership | Strongest segments |
|---|---|---|---|
| KUREHA CORPORATION | Japan | Public Company | Hollow Polymer Microspheres,Solid Polymer and Functional Microspheres,Glass and Ceramic Microspheres, |
| 3M COMPANY | United States | Public Company | Hollow Microspheres,Solid Microspheres,Glass Raw Material, |
| THERMO FISHER SCIENTIFIC INC. | United States | Public Company | Polymer microspheres for medical technology and diagnostics,Glass and ceramic microspheres for analytical and industrial uses,Specialty microspheres embedded in lab products and biopharma services, |
| MERCK KGAA | United States | Public Company | Hollow microspheres,Solid microspheres,Glass microspheres, |
| DIASORIN S.P.A. | Italy | Public Company | Polymer microspheres for immunodiagnostic reagents,Glass and specialty microspheres for molecular/xMAP platforms,Other microsphere uses in medical technology and R&D, |
| MERIT MEDICAL SYSTEMS, INC. | United States | Public Company | Medical Technology – Embolotherapy Microspheres,Medical Technology – Delivery Systems & Kits Linked to Microspheres,Other Microsphere-Related Medical Components, |
| TERUMO CORPORATION | Japan | Public Company | Medical Technology – Embolization and Therapeutic Microsphere Delivery,Medical Technology – Imaging and Diagnostic Microsphere Use,Contract Manufacturing / Prefilled Systems Using Microsphere-Enabled Drugs, |
| TRELLEBORG AB | Sweden | Public Company | Hollow Microspheres,Solid Microspheres,Glass Raw Material, |
| CHASE CORPORATION | United States | Private Company | Hollow polymeric microspheres,Solid polymeric microspheres,Glass and ceramic microsphere solutions, |
| SUZHOU NANOMICRO TECHNOLOGY CO., LTD. | China | Public Company | Solid polymer and silica microspheres for life sciences (chromatography media, magnetic beads, life-science microspheres),LCD spacers and ACF conductive microspheres for electronics,Particle size standards and specialty solid microspheres for R&D and metrology, |
KUREHA CORPORATION
Kureha Corporation is a Japanese public company founded in 1944 with 3,941 employees, operating in the chemical and materials manufacturing sector.
3M COMPANY
3M Company is a diversified American multinational public company founded in 1902 with 60,500 employees, known for manufacturing a wide range of industrial, consumer, and healthcare products.
THERMO FISHER SCIENTIFIC INC.
Thermo Fisher Scientific Inc. is an American public company founded in 1956 with 125,000 employees, providing laboratory equipment, reagents, and analytical instruments for research and diagnostics.
MERCK KGAA
Merck KGaA is a German-headquartered public company with roots dating to 1668 and 59,077 employees, operating in pharmaceuticals, life sciences, and performance materials.
DIASORIN S.P.A.
DiaSorin S.p.A. is an Italian public company founded in 1968 with 3,242 employees, specializing in in vitro diagnostics and immunodiagnostic solutions.
MERIT MEDICAL SYSTEMS, INC.
Merit Medical Systems, Inc. is an American public company founded in 1987 with 7,500 employees, manufacturing medical devices for interventional procedures and vascular access.
TERUMO CORPORATION
Terumo Corporation is a Japanese public company founded in 1921 with 30,591 employees, specializing in medical devices and blood management solutions.
TRELLEBORG AB
Trelleborg AB is a Swedish public company founded in 1905 with 15,756 employees, manufacturing engineered polymer solutions and sealing systems.
CHASE CORPORATION
Chase Corporation is an American private company founded in 1946 with 859 employees, producing specialty chemicals and protective coatings.
SUZHOU NANOMICRO TECHNOLOGY CO., LTD.
Suzhou Nanomicro Technology Co., Ltd. is a Chinese public company founded in 2007 with 1,213 employees, engaged in nanotechnology and advanced materials development.
Countries within Asia Pacific - compare and drill down
| Country | 2025 size (native) |
|---|---|
| China | USD 950.5 Million |
| Japan | USD 305.2 Million |
| India | USD 222.1 Million |
| South Korea | USD 88.2 Million |
| Rest Of Asia Pacific | USD 281.1 Million |
Country market size visualization
Reasons to Buy this Report
- Regional Market Sizing & Forecasts : Obtain precise market valuations for Asia Pacific (USD 1,226.1M in 2026) and country-level breakdowns including China, Japan, India, and South Korea to identify high-growth opportunities.
- Competitive Landscape Intelligence : Understand market dynamics specific to Asia Pacific, including key players, market share distribution, and competitive strategies tailored to regional pharmaceutical, cosmetic, and industrial sectors.
- Growth Driver Analysis : Identify region-specific growth catalysts including healthcare investments, manufacturing expansion, regulatory trends, and consumer demand patterns driving the 8.54% CAGR in Asia Pacific.
- Country-Level Investment Insights : Access detailed market data for individual Asia Pacific countries to prioritize market entry strategies, partnerships, and resource allocation in high-potential markets like China and India.
- Application & End-Use Segmentation : Analyze microsphere demand across pharmaceuticals, cosmetics, and industrial applications specific to Asia Pacific to align product development and marketing strategies with regional preferences.
Frequently asked questions
What is the projected size of the Asia Pacific microspheres market by 2031?
The Asia Pacific microspheres market is projected to reach USD 1,847.1 million by 2031, up from USD 1,226.1 million in 2026.
What is the CAGR for the Asia Pacific microspheres market?
The Asia Pacific microspheres market is expected to grow at a compound annual growth rate of 8.54% from 2026 to 2031.
Which industries drive demand in the Asia Pacific microspheres market?
Asia Pacific microspheres demand is primarily driven by pharmaceuticals, cosmetics, diagnostics, and industrial applications including coatings and composites.
What factors support growth in the Asia Pacific microspheres market?
Asia Pacific market growth is supported by rapid industrialization, rising healthcare investments, expanding manufacturing capabilities, and increasing adoption of advanced materials.
How does Asia Pacific compare to the global microspheres market?
Asia Pacific represents a significant portion of global microspheres demand with an 8.54% CAGR, slightly outpacing the global average of 8.23% through 2031.
RESEARCH METHODOLOGY
This study involved four major activities in estimating the market size for microspheres. Exhaustive secondary research was done to collect information on the market, the peer market, and the parent market. The next step was to validate these findings, assumptions, and sizing with industry experts across the value chain through primary research. Both top-down and bottom-up approaches were employed to estimate the complete market size. After that, the market breakdown and data triangulation procedures were used to estimate the market size of the segments and subsegments.
Secondary Research
Secondary sources used in this study included annual reports, press releases, and investor presentations of companies; white papers; certified publications; articles from recognized authors; and gold-standard and silver-standard websites, such as Factiva, ICIS, Bloomberg, and others. The findings of this study were verified through primary research, which involved conducting extensive interviews with key officials, including CEOs, VPs, directors, and other executives. The breakdown of profiles of the primary interviewees is illustrated in the figure below:
Primary Research
The microspheres market comprises several stakeholders, such as raw material suppliers, end-product manufacturers, and regulatory organizations in the supply chain. Various primary sources from both the supply and demand sides of the market were interviewed to obtain qualitative and quantitative information.
BREAKDOWN OF PRIMARY PARTICIPANTS
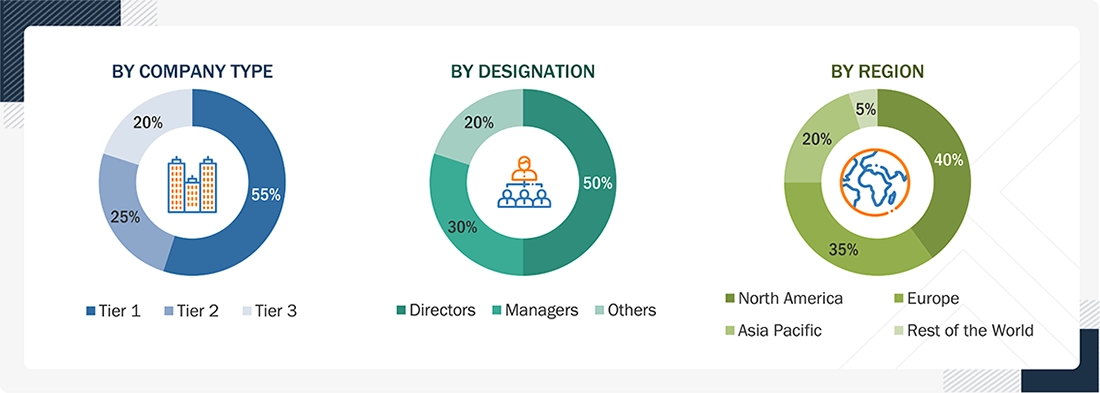
Notes: Tier 1, Tier 2, and Tier 3 companies are classified based on their market revenue in 2023/2024, available in the public domain, product portfolios, and geographical presence. Other designations include consultants and sales, marketing, and procurement managers.
|
COMPANY NAME |
DESIGNATION |
|
3M Company |
Senior Manager |
|
Nouryon |
Innovation Manager |
|
Merck KGaA |
Vice President |
|
Potters Industries LLC |
Production Supervisor |
|
Thermo Fisher Scientific Inc. |
Sales Manager |
To know about the assumptions considered for the study, download the pdf brochure
Market Size Estimation
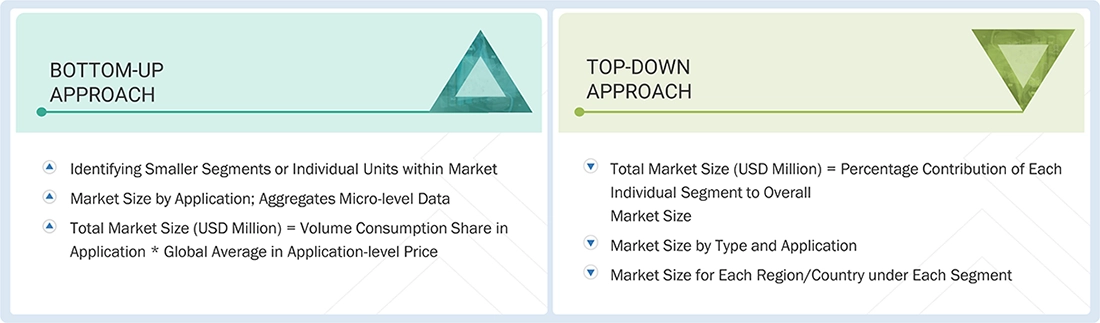
Both top-down and bottom-up approaches were used to estimate and validate the total size of the microspheres market. These methods were also used extensively to estimate the size of various subsegments in the market. The research methodology used to estimate the market size includes the following:
- The key players in the industry were identified through extensive secondary research.
- The supply chain of the industry was determined through primary and secondary research.
- All percentage shares, splits, and breakdowns were determined using secondary sources and verified through primary sources.
- All possible parameters that affect the markets covered in this research study were accounted for, viewed in extensive detail, verified through primary research, and analyzed to obtain the final quantitative and qualitative data.
Microspheres Market: Bottom-up and Top-DownApproach
Data Triangulation
After determining the overall market size using the market size estimation processes explained above, the market was divided into several segments and subsegments. To complete the overall market engineering process and determine the exact statistics for each market segment and subsegment, data triangulation and market breakdown procedures were employed, as applicable. The data was triangulated by studying various factors and trends from both the demand and supply sides in the microspheres industry.
Market Definition
According to the International Journal of Pharmaceutical Research and Applications, microspheres are engineered spherical particles, typically ranging from 1 to 1000 micrometers (µm) in diameter, produced in hollow or solid forms from materials such as polymers, glass, ceramics, fly ash, metals, and other specialty compounds. They are designed with controlled size, structure, and surface properties to function as lightweight fillers, performance enhancers, or carrier systems across diverse applications. They help improve properties such as density, strength, insulation, flow behavior, and controlled delivery performance.
Key Stakeholders
- Microspheres manufacturers
- Microspheres distributors
- Raw material suppliers
- Government and research organizations
- Investment banks and private equity firms
Report Objectives
- To analyze and forecast the size of the microspheres market in terms of value
- To provide detailed information about the major drivers, restraints, challenges, and opportunities influencing the market growth
- To define, describe, and segment the market based on type, raw material, application, and region
- To forecast the size of the market segments based on regions such as Asia Pacific, North America, Europe, Middle East & Africa, and South America.
- To strategically analyze micromarkets with respect to individual growth trends, prospects, and their contribution to the overall market
- To strategically analyze the segmented markets with respect to individual growth trends, prospects, and contributions to the overall market
- To identify and analyze opportunities for stakeholders in the market
- To analyze competitive developments such as expansions, partnerships, joint ventures, mergers & acquisitions, agreements, and product launches in the market
- To strategically profile the key companies and comprehensively analyze their core competencies.
Available customizations:
Using the provided market data, MarketsandMarkets offers customizations tailored to the company’s specific needs. The following customization options are available for the report.
Product analysis
- Product comparative analysis, which gives a detailed comparison of innovative products being offered by prominent vendors
Geographic analysis
- Further breakup of additional European countries by offering, business function, data type, and vertical
- Further breakup of additional Asia Pacific countries by offering, business function, data type, and vertical
- Further breakup of additional Middle East & African countries by offering, business function, data type, and vertical
- Further breakup of additional Latin American countries by offering, business function, data type, and vertical
Company information
- Detailed analysis and profiling of additional market players (up to five)
Get the Full Microspheres Market Report
Full forecast, segment splits, and company analysis for all Microspheres Market.
- US Microspheres Market
- Canada Microspheres Market
- Mexico Microspheres Market
- Germany Microspheres Market
- France Microspheres Market
- UK Microspheres Market
- Italy Microspheres Market
- Spain Microspheres Market
- China Microspheres Market
- Japan Microspheres Market
- India Microspheres Market
- South Korea Microspheres Market
- Brazil Microspheres Market
- Rest Of Europe Microspheres Market
- Rest Of Asia Pacific Microspheres Market
- Rest Of South America Microspheres Market
Need a Tailored Report?
Customize this report to your needs
Get 10% FREE Customization
Customize This Report
