
Asia Pacific Mobile Mass Spectrometers Market (2026-2031)

The Asia Pacific Mobile Mass Spectrometers Market was valued at $119.1 Million in 2026 and projected to reach to $215.5 Million by 2031, representing a compound annual growth rate of 12.6%. The Asia Pacific mobile mass spectrometers market is poised for sustained expansion through 2031, with the region's healthcare sector increasingly prioritizing portable diagnostic solutions to improve clinical outcomes and operational efficiency.


| Market Size in | USD 26.32 MN |
| Market Forecast in | |
| CAGR | |
| Forecast Period | |
| Units Considered | Value (USD MN) |
Asia Pacific Mobile Mass Spectrometers Market Trends and Insights
- Asia Pacific's healthcare sector is increasingly adopting portable mass spectrometry solutions to enhance diagnostic capabilities and streamline clinical workflows across hospitals, laboratories, and point-of-care settings.
- The region's growing investment in healthcare infrastructure, rising prevalence of chronic diseases, and expanding pharmaceutical research activities are driving demand for mobile mass spectrometer technologies throughout Asia Pacific. Asia Pacific's 12.6% compound annual growth rate significantly outpaces global trends, reflecting the region's accelerating modernization of diagnostic facilities and regulatory support for advanced medical technologies.
- Between 2026 and 2031, Asia Pacific is expected to capture substantial market share as emerging economies strengthen their healthcare systems and increase spending on precision medicine tools.
- The region's competitive landscape features both established multinational manufacturers and innovative local players positioning mobile mass spectrometers as essential instruments for clinical diagnostics, drug development, and environmental monitoring across Asia Pacific..
Key Market Statistics
- CAGR (2026-2031) 12.6% CAGR
- Market Size, 2026 ~USD 119.1 Million
- Forecast, 2031 ~USD 215.5 Million
- Geography Asia Pacific
Asia Pacific Mobile Mass Spectrometers Market Overview
Rapid Market Growth :
Asia Pacific's mobile mass spectrometers market is expanding at 12.6% CAGR, outpacing the global growth rate of 11.3%, driven by increasing healthcare investments and diagnostic modernization across the region.
China & Japan Leadership :
China ($244.9M) and Japan ($247.4M) dominate the Asia Pacific market, leveraging advanced healthcare infrastructure, strong R&D capabilities, and government support for precision medicine initiatives.
Point-of-Care Adoption :
Healthcare facilities across Asia Pacific are increasingly deploying portable mass spectrometry solutions in hospitals, clinical laboratories, and point-of-care settings to enhance diagnostic speed and accuracy.
Emerging Market Potential :
India ($138.9M) and South Korea ($46.6M) represent high-growth opportunities, with expanding healthcare sectors and rising demand for advanced diagnostic technologies in emerging economies.
Asia Pacific Mobile Mass Spectrometers Market Dynamics
- Government healthcare reforms, rising healthcare expenditure, and growing awareness of precision medicine are key drivers accelerating adoption across hospitals, diagnostic centers, and research institutions. Key markets including China, Japan, and India are investing heavily in healthcare infrastructure modernization and laboratory automation.
- The region's competitive advantage in manufacturing and technology development, combined with a large patient population requiring advanced diagnostics, positions Asia Pacific as a critical growth engine for the global mobile mass spectrometers market..
Market Ecosystem

MOBILE MASS SPECTROMETERS MARKET: COMMERCIAL USE CASES ACROSS INDUSTRIES
| COMPANY | USE CASE DESCRIPTION | BENEFITS |
|---|---|---|
 |
The MX908 helps in immediate identification of unknown substances in the field, enabling faster and safer decision-making | Handheld device (e.g., MX908) used by law enforcement and hazmat teams for on-site detection of narcotics, explosives, and chemical threats |
 |
Portable GC-MS systems used for environmental monitoring and field-based chemical analysis (air, soil, water contaminants) | Real-time environmental assessment, allowing quicker regulatory compliance and faster response to contamination events |
 |
Portable GC-MS systems deployed in military and homeland security operations for the detection of hazardous chemicals and toxic industrial compounds | Enhanced situational awareness in mission-critical environments, enabling rapid response and minimizing exposure to dangerous substances |
 |
Field-deployable MS systems (Bruker MM2) for chemical warfare agent (CWA) detection and forensic analysis | Reduces the need for specialized in-house column-packing expertise and labor, reducing the need for specialized workflow |
Logos and trademarks shown above are the property of their respective owners. Their use here is for informational and illustrative purposes only.
Related Ecosystem
Analytical And Scientific Instrumentation
- Environmental Testing
- Gas Chromatography
- Polymerase Chain Reaction (PCR)
- Automated Liquid Handling Systems
- Flow Cytometry
- Thermo Fisher Scientific Inc.
- Danaher Corporation
- Agilent Technologies, Inc.
- Merck KGaA
- Shimadzu Corporation
Key Takeaways
- Asia Pacific's mobile mass spectrometers market will grow from $119.1M (2026) to $215.5M (2031) at a 12.6% CAGR, outpacing global growth rates.
- Asia Pacific's healthcare modernization and increased pharmaceutical R&D investment are primary catalysts for mobile mass spectrometer adoption across the region.
- Emerging economies in Asia Pacific are prioritizing precision diagnostic tools, creating significant expansion opportunities for portable mass spectrometry solutions.
- Asia Pacific's competitive environment combines multinational leaders with regional innovators, intensifying product development and market penetration strategies.
Mobile Mass Spectrometers Market Report Scope
| Report Metric | Details |
|---|---|
| Base Year | 2026 |
| Fastest Growing Segment | OTHER COMPONENTS (Component) |
| Forecast Period | 2026–2031 |
| Growth Rate | CAGR of 11.3% from 2026 to 2031 |
| Largest Segment | OUTSIDE LAB-BASED APPLICATIONS (Application) |
| Market Size Base Year (Billions) | ~USD 1.68 (2026) |
| Revenue Forecast (Billions) | ~USD 2.87 (2031) |
| Segments Covered | Product Type, Component, Application, Type |
Asia Pacific Mobile Mass Spectrometers Market Report Segmentation
4 segment dimensions are covered across the global market.
By Product Type
- Benchtop Platforms
- Field Deployable/ Backpack- Based Platforms
- Hand-Held & Portable Platforms
- Other Platforms
By Component
- Detectors
- Electrodes & Electromagnet
- Electrodes & Electromagnets
- Ion Interface & Optics Systems
- Ion Sources
- Mass Analyzers
- Other Components
- Sample Introduction Systems
- Vacuum Systems & Pumps
By Application
- Hand-Held Applications
- Lab-Based Applications
- Outside Lab-Based Applications
By Type
- Cbrn Mission Testing
- Environmental Testing
- Food Testing
- Forensic Toxicology
- Homeland & Border Security
- Military Applications
- Narcotics Detection
- Other Hand-Held Applications
- Other Lab-Based Applications
- Other Outside Lab-Based Applications
- Rapid Response & Disaster Management
Target Audience
- Medical Device Manufacturers : Manufacturers need Asia Pacific market intelligence to identify growth opportunities, benchmark competitive positioning, and develop region-specific product strategies for mobile mass spectrometer solutions.
- Healthcare Facility Operators : Hospital administrators and laboratory directors require market insights to evaluate technology investments, understand adoption trends, and optimize diagnostic capabilities across Asia Pacific facilities.
- Diagnostic Service Providers : Clinical laboratory networks and diagnostic centers need regional market data to assess demand for portable mass spectrometry, plan capital expenditures, and expand service offerings.
- Healthcare Investors & PE Firms : Investment professionals require comprehensive Asia Pacific market analysis to identify acquisition targets, evaluate portfolio companies, and assess growth potential in the diagnostic technology sector.
- Government & Healthcare Policy Makers : Regulatory bodies and healthcare planners need market intelligence to inform healthcare infrastructure investments, technology adoption policies, and precision medicine initiatives across Asia Pacific.
Key Companies in the Asia Pacific Mobile Mass Spectrometers Market
| Company | HQ | Ownership | Strongest segments |
|---|---|---|---|
| THERMO FISHER SCIENTIFIC INC. | United States | Public Company | Portable (lab-centric, transportable systems),Field Deployable (outside lab, ruggedized),Handheld, |
| TELEDYNE TECHNOLOGIES | United States | Public Company | Field Deployable Systems (Outside Lab: CBRN, Military, Homeland Security, Disaster Management),Portable / Handheld (Narcotics, Forensics, On-site Env and Food Checks),Benchtop / Lab-focused (Env, Food, Forensics Labs), |
| 908 DEVICES INC. | United States | Public Company | Handheld Mass Spectrometers (MX908 and related),Portable / Field-Deployable FTIR (ThreatID, VipIR, ProtectIR),Benchtop / Lab-Oriented and Components, |
| BRUKER | United States | Public Company | Portable,Field Deployable,Benchtop (mobile-capable lab use), |
| WATERS CORPORATION | United States | Public Company | Benchtop mobile/transportable MS,Portable field-deployable MS,Handheld MS and ultra-rugged units, |
| AGILENT TECHNOLOGIES, INC. | United States | Public Company | Portable (lab-oriented mobile systems),Field Deployable (outside-lab, vehicle or shelter-based),Handheld, |
| JEOL LTD. | Japan | Public Company | Benchtop (lab-focused mobile workflows),Portable,Field Deployable / Handheld, |
| PERKINELMER | United States | Public Company | Portable,Field Deployable,Benchtop, |
| ASTROTECH CORPORATION | United States | Public Company | Portable / Field Deployable (TRACER 1000, Pro-Control 1000-D2, EN-SCAN),Handheld / Point-of-Use (BreathTest-1000 and compact variants),Lab-focused benchtop and cannabis/hemp (AGLAB-1000), |
| INFICON | Switzerland | Public Company | Outside lab (Narcotics, CBRN, Military, Homeland Security),Lab (Env, food, forensics, Disaster management),Handheld, |
| MICROSAIC | United Kingdom | Public Company | Compact / Portable Mass Spectrometers (Lab & Outside Lab),Modern Water MicroTox CTM/FX/LX Toxicity Monitors,Consumables, Spare Parts, and Services, |
| LECO CORPORATION | United States | Public Company | Benchtop (lab-focused MS adjacencies, integration content),Portable,Field Deployable, |
| HTDS | United States | Public Company | Lab – Environmental & Food,Lab – Forensics & Disaster Management,Outside Lab – Narcotics & CBRN, |
THERMO FISHER SCIENTIFIC INC.
Thermo Fisher Scientific Inc. is a United States-based public company founded in 1956 that employs 125,000 people. The company operates as a major provider of scientific and laboratory solutions.
TELEDYNE TECHNOLOGIES
Teledyne Technologies is a United States-based public company founded in 1960 with 15,800 employees. The company operates across multiple technology and engineering sectors.
908 DEVICES INC.
908 Devices Inc. is a United States-based public company founded in 2012 with 172 employees. The company operates in the analytical instrumentation sector.
BRUKER
Bruker is a United States-based public company founded in 1960 with 11,085 employees. The company provides scientific instruments and analytical solutions.
WATERS CORPORATION
Waters Corporation is a United States-based public company founded in 1958 with 7,900 employees. The company specializes in laboratory analytical instruments and software.
AGILENT TECHNOLOGIES, INC.
Agilent Technologies, Inc. is a United States-based public company founded in 1999 with 18,000 employees. The company provides life sciences, diagnostics, and applied chemical markets solutions.
JEOL LTD.
JEOL Ltd. is a Japan-based public company founded in 1949 with 3,731 employees. The company manufactures electron microscopes and scientific instruments.
PERKINELMER
PerkinElmer is a United States-based public company founded in 1937 with 11,000 employees. The company provides scientific instruments, software, and services for research and diagnostics.
ASTROTECH CORPORATION
AstroTech Corporation is a United States-based public company founded in 1984 with 32 employees. The company operates in the aerospace and technology sectors.
INFICON
INFICON is a Switzerland-based public company founded in 2000 with 1,731 employees. The company provides vacuum instrumentation and leak detection solutions.
MICROSAIC
Microsaic is a United Kingdom-based public company founded in 1998 with 5 employees. The company operates in the analytical instrumentation sector.
LECO CORPORATION
LECO Corporation is a United States-based private company founded in 1895 with 12,000 employees. The company manufactures laboratory instruments and analytical equipment.
HTDS
HTDS is a United States-based public company. Limited information is available regarding the company's founding date and employee count.
Countries within Asia Pacific - compare and drill down
| Country | 2025 size (native) |
|---|---|
| China | USD 244.9 Million |
| Japan | USD 247.4 Million |
| India | USD 138.9 Million |
| Australia | USD 39.2 Million |
| South Korea | USD 46.6 Million |
| Rest Of Asia Pacific | USD 23.1 Million |
Country market size visualization
Reasons to Buy this Report
- Regional Market Sizing & Forecasts : Detailed market valuations for Asia Pacific ($119.1M in 2026, $215.5M in 2031) with country-level breakdowns for China, Japan, India, Australia, and South Korea to support strategic planning.
- Competitive Landscape Analysis : Comprehensive assessment of leading manufacturers and technology providers operating in Asia Pacific, including market share distribution and competitive positioning strategies specific to the region.
- Growth Driver Identification : In-depth analysis of Asia Pacific-specific factors driving adoption: healthcare infrastructure investments, government initiatives, regulatory environment, and clinical workflow optimization trends.
- Country-Level Opportunity Assessment : Granular insights into individual Asia Pacific markets, identifying high-growth countries and emerging opportunities for market entry, expansion, and partnership development.
- Strategic Investment Guidance : Actionable recommendations for stakeholders seeking to capitalize on Asia Pacific's 12.6% CAGR growth, including market entry strategies, product positioning, and distribution channel optimization.
Frequently asked questions
What is the projected market size for mobile mass spectrometers in Asia Pacific by 2031?
Asia Pacific's mobile mass spectrometers market is projected to reach $215.5 million by 2031, growing from $119.1 million in 2026.
What is the CAGR for mobile mass spectrometers in Asia Pacific?
Asia Pacific's mobile mass spectrometers market is expected to grow at a compound annual growth rate of 12.6% between 2026 and 2031.
Which factors are driving growth in Asia Pacific's mobile mass spectrometers market?
Key drivers in Asia Pacific include healthcare infrastructure modernization, rising chronic disease prevalence, expanding pharmaceutical research, and regulatory support for advanced diagnostic technologies.
How does Asia Pacific's growth compare to global mobile mass spectrometers market trends?
Asia Pacific's 12.6% CAGR significantly exceeds the global CAGR of 11.3%, indicating the region is a high-growth market for mobile mass spectrometry solutions.
What applications are driving mobile mass spectrometer demand in Asia Pacific?
Asia Pacific demand is driven by clinical diagnostics, pharmaceutical drug development, environmental monitoring, and point-of-care testing applications across hospitals and research laboratories.
RESEARCH METHODOLOGY
This study balanced primary and secondary research for the mobile mass spectrometers market by analyzing various market variables affecting small, medium, and large businesses. The next step involved conducting primary research with industry experts along the value chain to validate the findings, assumptions, and market sizing. Multiple methodologies, including both top-down and bottom-up approaches, were employed to estimate the overall market size.
The study encompasses market segments, evolving trends, regulatory frameworks, and competitive dynamics. It also examines leading market players and the strategies they employ in this sector. In conclusion, the total market size was estimated using a combination of top-down and bottom-up approaches, with data triangulation to finalize the market size. Primary research was conducted throughout the study to validate and test each hypothesis.
Secondary Research
During the study, secondary research was conducted using a range of sources, including directories and databases such as Bloomberg Businessweek, D&B Hoovers, and Factiva. Additional materials included white papers, annual reports, SEC filings, and investor presentations. This research approach was adopted to collect and analyze data that provides comprehensive, technical, and market-focused insights into the mobile mass spectrometers market. The findings offer insights into key players and market segmentation, informed by recent industry trends and significant developments. A database comprising leading industry figures was also created as part of this secondary research.
Primary Research
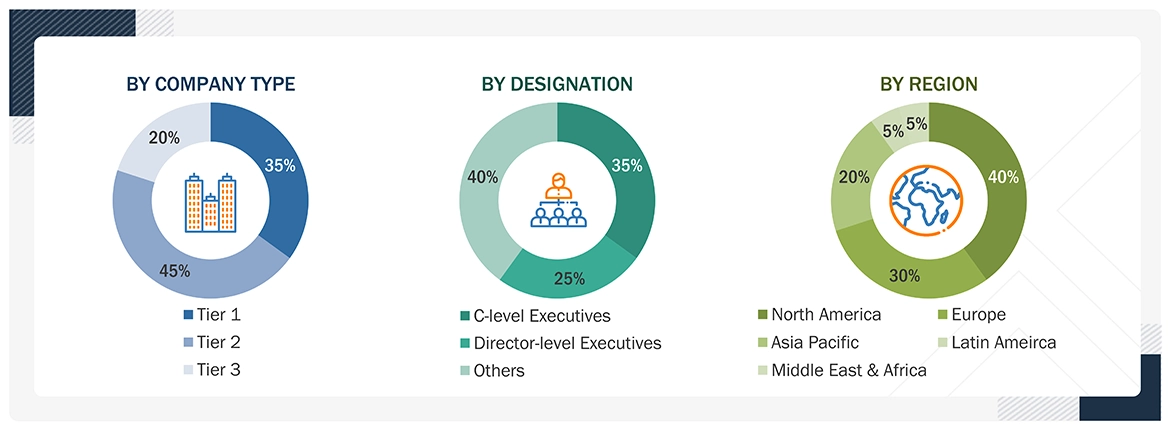
Primary research involved activities designed to gather both qualitative and quantitative data. A variety of individuals from both the supply and demand sides were interviewed during this phase. On the supply side, key figures such as CEOs, vice presidents, directors of marketing and sales, directors of technology and innovation, and other important leaders were interviewed by industry experts. On the demand side, primary sources included academic institutions and research organizations. This research aimed to validate market segmentation, identify prominent market participants, and gain insights into significant industry trends and market dynamics through a real-world primary study.
To know about the assumptions considered for the study, download the pdf brochure
Market Size Estimation
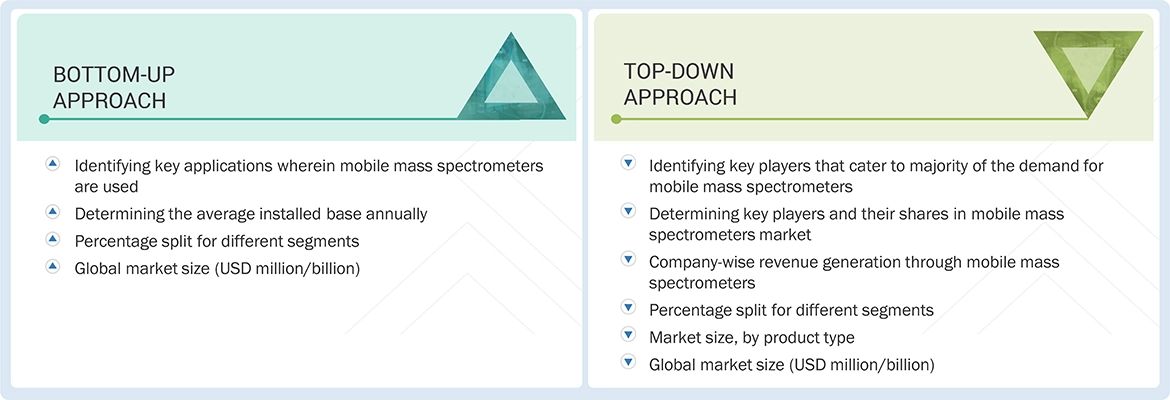
This report provides an analysis of the global mobile mass spectrometers market size by reviewing the revenue shares of prominent companies. Key players with significant market shares were identified through secondary research, and their revenue from mobile mass spectrometers sales was calculated and subsequently validated through primary research. The secondary research included an analysis of annual and financial reports from leading market participants. Meanwhile, the primary research involved in-depth interviews with key thought leaders, such as directors, CEOs, and marketing executives.
To calculate the global market value, segmental revenues were derived from revenue mappings provided by service and product providers. The process involved the following steps:
- Generating a list of key players that operate in the mobile mass spectrometers market at the regional or global levels
- Mapping the products of manufacturers of mobile mass spectrometers and related product lines at the regional level
- Mapping the revenues of listed players through the sales of mobile mass spectrometers and related products
- Mapping the revenues of major players to cover at least ~90% of the global market share as of 2024
- Extrapolating the mapped revenues of players to arrive at the global market value for the respective segment
- Summing up the market value for all segments and subsegments to achieve the actual value of the global mobile mass spectrometers market
Data Triangulation
After estimating the overall market size, the mobile mass spectrometers market was classified into subsegments. The overall market engineering process was finalized through data triangulation and market segmentation, yielding accurate statistics for all segments and subsegments. This triangulation involved analyzing various trends and factors on both the demand and supply sides. Furthermore, the mobile mass spectrometers market data was verified and validated using both top-down and bottom-up approaches.
Market Definition
A mobile mass spectrometer is a portable device that identifies chemicals on-site by measuring the mass-to-charge ratio of ions. The mobile mass spectrometers market encompasses product types, e.g., handheld and portable platforms; field-deployable, backpack-based platforms used in lab-based applications; point-of-use, lab-based applications; and handheld applications.
Key Stakeholders
- Pharmaceutical companies
- Biopharmaceutical companies
- Contract research organizations (CROs)
- Contract development and manufacturing organizations (CDMOs)
- Defense organizations
- Narcotics testing facilities
- Academic & research institutes
- Regulatory authorities and industry associations
- Venture capitalists and investment firms
- Research labs
Report Objectives
- To define, describe, and forecast the size of the mobile mass spectrometers market based on product type, application, component, and region
- To provide detailed information regarding the major factors influencing the growth potential of the global mobile mass spectrometers market (drivers, restraints, opportunities, challenges, and trends)
- To analyze the micromarkets with respect to individual growth trends, prospects, and contributions to the global mobile mass spectrometers market
- To analyze key growth opportunities in the global mobile mass spectrometers market for key stakeholders and provide details of the competitive landscape for market leaders
- To forecast the size of market segments and/or subsegments with respect to five major regions: North America (US and Canada), Europe (Germany, France, the UK, Spain, Italy, and the RoE), Asia Pacific (Japan, China, India, Australia, South Korea, and RoAPAC), Latin America (Brazil, Mexico, RoLA), and the Middle East & Africa (GCC and RoMEA)
- To profile the key players in the mobile mass spectrometers market and comprehensively analyze their market shares and core competencies
- To analyze the competitive developments undertaken in the global mobile mass spectrometers market, such as product launches, agreements, expansions, and mergers & acquisitions.
Available customizations:
With the market data provided, MarketsandMarkets offers customizations tailored to your company’s specific needs. The following customization options are available for the present global mobile mass spectrometers market report:
Product Analysis
- Product matrix, which gives a detailed comparison of the product portfolios of the top 15 companies
Company Information
- Detailed analysis and profiling of additional market players (up to 13)
Geographic Analysis
- Further breakdown of the Rest of Europe mobile mass spectrometers market into Russia, Belgium, the Netherlands, Switzerland, Austria, Finland, Sweden, Poland, and Portugal
- Further breakdown of the Rest of Asia Pacific mobile mass spectrometers market into Singapore, Taiwan, New Zealand, the Philippines, Malaysia, and other Asia Pacific countries
- Further breakdown of the Rest of Latin America mobile mass spectrometers into Argentina, Chile, Peru, and Colombia.
Get the Full Mobile Mass Spectrometers Market Report
Full forecast, segment splits, and company analysis for all Mobile Mass Spectrometers Market.
- Australia Mobile Mass Spectrometers Market
- South Korea Mobile Mass Spectrometers Market
- Brazil Mobile Mass Spectrometers Market
- Mexico Mobile Mass Spectrometers Market
- Rest Of Europe Mobile Mass Spectrometers Market
- Rest Of Asia Pacific Mobile Mass Spectrometers Market
- Rest Of Latin America Mobile Mass Spectrometers Market
- GCC Countries Mobile Mass Spectrometers Market
- US Mobile Mass Spectrometers Market
- Canada Mobile Mass Spectrometers Market
- Germany Mobile Mass Spectrometers Market
- UK Mobile Mass Spectrometers Market
- France Mobile Mass Spectrometers Market
- Italy Mobile Mass Spectrometers Market
- Spain Mobile Mass Spectrometers Market
- China Mobile Mass Spectrometers Market
- Japan Mobile Mass Spectrometers Market
- India Mobile Mass Spectrometers Market
Need a Tailored Report?
Customize this report to your needs
Get 10% FREE Customization
Customize This Report
