
Asia Pacific Model Based Enterprise Market (2024-2029)

The Asia Pacific Model Based Enterprise Market was valued at $4719.6 Million in 2024 and projected to reach to $9759.3 Million by 2029, representing a compound annual growth rate of 15.6%. Asia Pacific's Model Based Enterprise market is poised for accelerated growth through 2029, driven by semiconductor manufacturing expansion and digital transformation across the region.


| Market Size in | USD 26.32 MN |
| Market Forecast in | |
| CAGR | |
| Forecast Period | |
| Units Considered | Value (USD MN) |
Asia Pacific Model Based Enterprise Market Trends and Insights
- Asia Pacific's 15.6% compound annual growth rate outpaces global trends, driven by rapid digital transformation across semiconductor and electronics manufacturing in the region.
- The market's acceleration reflects Asia Pacific's strategic position as a global manufacturing hub and increasing adoption of model-based systems engineering practices. Asia Pacific's growth trajectory is underpinned by substantial investments in Industry 4.0 technologies and smart manufacturing initiatives across key economies.
- The region's semiconductor and electronics sector is leveraging Model Based Enterprise solutions to enhance product development efficiency, reduce time-to-market, and improve supply chain visibility.
- Between 2024 and 2029, Asia Pacific is expected to capture significant market share as enterprises increasingly recognize the competitive advantages of integrated digital product lifecycle management. Key drivers propelling Asia Pacific's market expansion include government support for advanced manufacturing, rising labor costs incentivizing automation, and the region's dominance in electronics production.
- Asia Pacific's strategic importance in global supply chains positions the region as a critical growth engine for Model Based Enterprise adoption throughout the forecast period..
Key Market Statistics
- CAGR (2024-2029) 15.6% CAGR
- Market Size, 2024 ~USD 4719.6 Million
- Forecast, 2029 ~USD 9759.3 Million
- Geography Asia Pacific
Asia Pacific Model Based Enterprise Market Overview
Regional Market Leadership :
Asia Pacific commands $4,719.6 million in 2024, with a 15.6% CAGR significantly outpacing the global 14.9% growth rate, positioning the region as a critical growth engine for Model Based Enterprise solutions.
China's Dominance :
China leads Asia Pacific with $3,164.4 million in market value, representing 67% of the regional market and driving semiconductor manufacturing innovation through digital transformation initiatives.
Emerging Growth Markets :
India ($1,195.5M) and Rest of Asia Pacific ($1,363.9M) represent high-growth opportunities, fueled by expanding electronics manufacturing ecosystems and government-backed digital initiatives.
Developed Market Strength :
Japan ($1,634.7M) and South Korea ($1,768.9M) maintain substantial market presence, leveraging advanced semiconductor capabilities and established MBE adoption in precision manufacturing.
Asia Pacific Model Based Enterprise Market Dynamics
- China's dominance, coupled with emerging opportunities in India and Southeast Asia, creates a dynamic landscape where MBE adoption becomes critical for competitive advantage.
- The region's 15.6% CAGR reflects increasing investments in Industry 4.0 technologies and smart manufacturing practices. Key growth catalysts include rising labor costs driving automation adoption, government incentives for advanced manufacturing, and supply chain resilience initiatives post-pandemic.
- Japan and South Korea's technological leadership combined with China's manufacturing scale creates a powerful ecosystem.
- By 2029, the market is projected to reach $9,759.3 million, with Asia Pacific solidifying its position as the global center for Model Based Enterprise innovation and implementation..
Market Ecosystem
Related Ecosystem
Industrial Automation
- Sensors
- Image Sensors
- Manufacturing Execution System (MES)
- Actuators
- Flow Sensors
- Siemens ag
- ABB India Limited
- Emerson Electric Co.
- HONEYWELL INTERNATIONAL INC.
- SCHNEIDER ELECTRIC SE
Automotive Advance Technologies
- Battery Electric Vehicle (BEV)
- Light Commercial Vehicles (LCVs)
- Fuel Cell Electric Vehicle (FCEV)
- Hybrid Electric Vehicle (HEV)
- Internal Combustion Engine (ICE)
- BOSCH LIMITED
- Continental ag
- Visteon Corporation
- DENSO Corporation
- ZF FRIEDRICHSHAFEN AG
Information System And Analytics
- Machine Learning
- Natural Language Processing (NLP)
- Sensors
- Software as A Service (SaaS)
- Data Loss Prevention (DLP)
- International Business Machines Corporation
- MICROSOFT CORPORATION
- Amazon.com, Inc.
- Oracle Corporation
Key Takeaways
- Asia Pacific's Model Based Enterprise Market will nearly double from $4.7B (2024) to $9.8B (2029), representing a 15.6% CAGR.
- Asia Pacific outpaces the global 14.9% CAGR, reflecting the region's accelerated digital transformation in semiconductor and electronics manufacturing.
- Asia Pacific's dominance in global electronics production and manufacturing creates substantial demand for integrated Model Based Enterprise solutions.
- Asia Pacific enterprises are increasingly adopting model-based systems engineering to enhance product development efficiency and supply chain resilience through 2029.
Model Based Enterprise Market Report Scope
| Report Metric | Details |
|---|---|
| Base Year | 2024 |
| Fastest Growing Segment | DIGITAL TWIN (Enabling Technology) |
| Forecast Period | 2024-2029 |
| Growth Rate | CAGR of 14.9% from 2024 to 2029 |
| Largest Segment | INDUSTRIAL SENSORS (Enabling Technology) |
| Market Size Base Year (Billions) | ~USD 13.53 (2024) |
| Revenue Forecast (Billions) | ~USD 27.1 (2029) |
| Segments Covered | Offering, Industry, Deployment Type, Enabling Technology, Process Industry, Discrete Industry |
Asia Pacific Model Based Enterprise Market Report Segmentation
6 segment dimensions are covered across the global market.
By Offering
- Services
- Solutions
By Industry
- Aerospace
- Automotive
- Construction
- Electronics & Telecommunications
- Food & Beverages
- Life Sciences & Healthcare
- Marine
- Oil & Gas
- Other Industries
- Power & Energy
- Retail
By Deployment Type
- Cloud-Based
- On-Premises
By Enabling Technology
- AI In Manufacturing
- Automated Guided Vehicles
- Digital Twin
- Industrial 3D Printing
- Industrial Cybersecurity
- Industrial Machine Vision
- Industrial Sensors
- Machine Condition Monitoring
- Robots
By Process Industry
- Chemicals
- Energy & Power
- Food & Beverages
- Metals & Mining
- Oil & Gas
- Other Process Industries
- Pharmaceuticals
- Pulp & Paper
By Discrete Industry
- Aerospace
- Automotive
- Machine Manufacturing
- Medical Devices
- Other Discrete Industries
- Semiconductor & Electronics
Target Audience
- Semiconductor Manufacturers : Asia Pacific semiconductor leaders need MBE market intelligence to optimize digital transformation investments, benchmark against regional competitors, and accelerate product development cycles.
- Electronics OEMs : Electronics manufacturers across Asia Pacific require market data to evaluate MBE solution adoption, assess supplier capabilities, and plan digital manufacturing roadmaps.
- MBE Solution Providers : Software and services vendors targeting Asia Pacific need regional market sizing, growth forecasts by country, and competitive positioning data to guide go-to-market strategies.
- Private Equity & Investors : Investment firms evaluating Asia Pacific semiconductor and electronics opportunities require detailed market analysis, growth trajectories, and country-level valuations for portfolio decisions.
- Government & Policy Bodies : Regional governments and industry bodies need MBE market intelligence to inform digital manufacturing policies, incentive programs, and technology adoption initiatives across Asia Pacific.
Countries within Asia Pacific - compare and drill down
| Country | 2025 size (native) |
|---|---|
| China | USD 3164.4 Million |
| Japan | USD 1634.7 Million |
| India | USD 1195.5 Million |
| South Korea | USD 1768.9 Million |
| Australia | USD 631.9 Million |
| Rest Of Asia Pacific | USD 1363.9 Million |
Country market size visualization
Reasons to Buy this Report
- Regional Market Sizing & Forecasts : Detailed market valuations for all 6 Asia Pacific countries with 2024-2029 projections, enabling precise investment planning and resource allocation across the region's diverse markets.
- Competitive Landscape Analysis : Understand market positioning across China's manufacturing dominance, Japan's technology leadership, and emerging opportunities in India and Southeast Asia to identify competitive advantages.
- Growth Driver Identification : Analyze region-specific catalysts including government digital initiatives, semiconductor supply chain strategies, and Industry 4.0 adoption rates driving the 15.6% CAGR.
- Country-Level Strategic Insights : Segment strategies by market maturity—from established players in Japan/South Korea to high-growth opportunities in India and Rest of Asia Pacific—for targeted market entry.
- Investment & Partnership Opportunities : Identify high-potential markets and growth segments within Asia Pacific to guide M&A, partnerships, and expansion decisions in the world's fastest-growing MBE region.
Frequently asked questions
What is the projected market size for Model Based Enterprise in Asia Pacific by 2029?
Asia Pacific's Model Based Enterprise Market is projected to reach $9,759.3 million by 2029, growing from $4,719.6 million in 2024.
What is the CAGR for Asia Pacific's Model Based Enterprise Market?
Asia Pacific's Model Based Enterprise Market is expected to grow at a compound annual growth rate of 15.6% between 2024 and 2029.
Why is Asia Pacific's growth rate higher than the global average?
Asia Pacific's 15.6% CAGR exceeds the global 14.9% rate due to the region's rapid digital transformation, manufacturing dominance, and increased Industry 4.0 investments in semiconductor and electronics sectors.
Which industries are driving Model Based Enterprise adoption in Asia Pacific?
The semiconductor and electronics industries are primary drivers of Model Based Enterprise adoption in Asia Pacific, leveraging these solutions for product development efficiency and supply chain optimization.
What factors are accelerating Model Based Enterprise market growth in Asia Pacific?
Key growth factors in Asia Pacific include government support for advanced manufacturing, rising labor costs driving automation, the region's global electronics production dominance, and increasing adoption of Industry 4.0 technologies.
RESEARCH METHODOLOGY
The study involved four major activities in estimating the current size of the model based enterprise market size . Exhaustive secondary research has been done to collect information on the market, peer, and parent markets. The next step has been to validate these findings, assumptions, and sizing with industry experts across the value chain through primary research. Both top-down and bottom-up approaches have been employed to estimate the total market size. After that, market breakdown and data triangulation methods were used to estimate the market size of segments and subsegments. Two sources of information-secondary and primary-have been used to identify and collect information for an extensive technical and commercial study of the model based enterprise market.
Secondary Research
Secondary sources include company websites, magazines, industry news, associations, and databases (Factiva and Bloomberg). These secondary sources include annual reports, press releases, investor presentations of companies, white papers, certified publications, articles by recognized authors, regulatory bodies, trade directories, and databases.
Primary Research
Primary sources mainly consist of several experts from the core and related industries, along with preferred model based enterprise software providers, distributors, alliances, standards, and certification organizations related to various segments of this industry’s value chain.
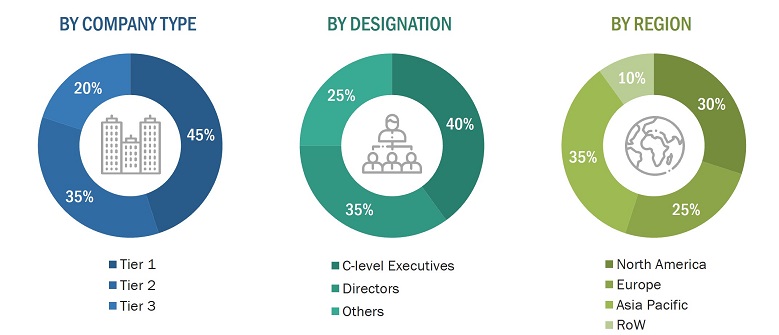
In the primary research process, various primary sources from both the supply and demand sides were interviewed to obtain qualitative and quantitative information on the market. The primary sources from the supply side included various industry experts such as Chief Experience Officers (CXOs), Vice Presidents (VPs), and Directors from business development, marketing, product development/innovation teams, and related key executives from model based enterprise software providers, such as Siemens (Germany), PTC (US), Dassault Systèmes (France), SAP (Germany), Autodesk Inc. (US), HCL Technologies Limited (India), and Oracle (US); research organizations, distributors, industry associations, and key opinion leaders. Following is the breakdown of primary respondents.
To know about the assumptions considered for the study, download the pdf brochure
Market Size Estimation
Both top-down and bottom-up approaches have been used to estimate and validate the total size of the model based enterprise market. These methods have also been used extensively to estimate the size of various subsegments in the market. The following research methodology has been used to estimate the market size:
- Major players in the industry and markets have been identified through extensive secondary research.
- The industry’s value chain and market size (in terms of value) have been determined through primary and secondary research processes.
- All percentage shares, splits, and breakdowns have been determined using secondary sources and verified through primary sources.
Top-Down Approach
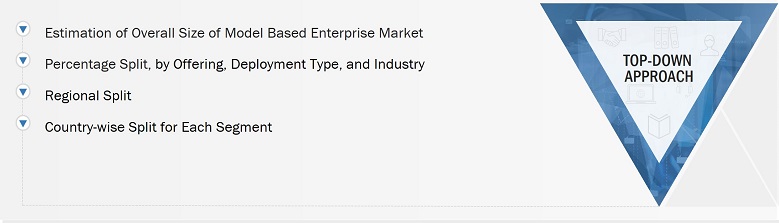
In the top-down approach, the overall market size has been used to estimate the size of the individual market segments (mentioned in market segmentation) through percentage splits from secondary and primary research. For specific market segments, the size of the most appropriate immediate parent market has been used to implement the top-down approach. The bottom-up approach has also been implemented for data obtained from secondary research to validate the market size of various segments.
Model Based Enterprise Market: Top-down Approach
Bottom-Up Approach
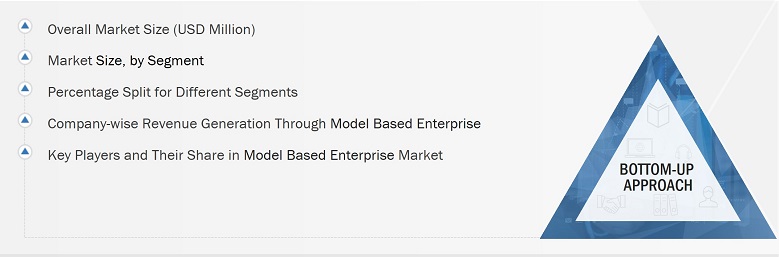
The bottom-up approach has been used to arrive at the overall size of the model based enterprise market from the revenues of the key players and their market shares. Calculations based on revenues of key companies identified in the market led to the estimation of their overall market size.
Model Based Enterprise Market: Bottom-up Approach
Data Triangulation
After arriving at the overall market size from the estimation process explained above, the overall market has been split into several segments and subsegments. The market breakdown and data triangulation procedures have been employed, wherever applicable, to complete the overall market engineering process and arrive at the exact statistics for all segments and subsegments. The data has been triangulated by studying various factors and trends from both the demand and supply sides. The market has also been validated using both top-down and bottom-up approaches.
Market Definition
Model based enterprise is a global initiative to augment 3D models with additional information to create new documentation deliverables beyond engineering. This Model Based Enterprise (MBE) initiatives are constructed on Model Based Definition (MBD) initiatives as a 3D model with embedded PMI (Product Manufacturing Information) to offer integrated and collaborative environment and to transform an enterprise’s engineering, manufacturing, and aftermarket services through product data reuse and derived context rather than interpreting inputs and recreating the models and drawings. MBE utilizes the standard CAD functionality of layers and saved views to provide the user access to just the information required.
Key Stakeholders
- Industry associations
- Associations and regulatory authorities related to 3D modeling
- Government bodies, venture capitalists, and private equity firms
- Manufacturers of model based enterprise solutions
- Maintenance personnel, developers, and suppliers of model based enterprise offerings
- Research institutes and organizations
Report Objectives
- To define and forecast the model based enterprise market size regarding offering, deployment type, and industry.
- To describe and forecast the model based enterprise market share and its value segments for four regions—North America, Europe, Asia Pacific, and the Rest of the World (RoW), along with their respective countries.
- To provide detailed information regarding the drivers, restraints, opportunities, and challenges influencing the growth of the market
- To strategically analyze micro-markets concerning individual growth trends, prospects, and contributions to the overall market
- To study the complete value chain of the model based enterprise market
- To analyze opportunities in the market for stakeholders by identifying high-growth segments of the market
- To strategically profile key players and comprehensively analyze their market position regarding ranking and core competencies, along with a detailed market competitive landscape.
- To analyze strategic approaches such as agreements, collaborations, and partnerships in the model based enterprise market
- To provide an analysis of the recession impact on the growth of the market and its segments
Available Customizations:
Based on the given market data, MarketsandMarkets offers customizations in the reports according to the client’s specific requirements. The available customization options are as follows:
Company Information
- Detailed analysis and profiling of additional market players (up to 5)
Get the Full Model Based Enterprise Market Report
Full forecast, segment splits, and company analysis for all Model Based Enterprise Market.
- US Model Based Enterprise Market
- Canada Model Based Enterprise Market
- Mexico Model Based Enterprise Market
- Germany Model Based Enterprise Market
- UK Model Based Enterprise Market
- France Model Based Enterprise Market
- Rest Of Europe Model Based Enterprise Market
- China Model Based Enterprise Market
- Japan Model Based Enterprise Market
- India Model Based Enterprise Market
- South Korea Model Based Enterprise Market
- Australia Model Based Enterprise Market
- Rest Of Asia Pacific Model Based Enterprise Market
- GCC Countries Model Based Enterprise Market
- Rest Of Middle East Model Based Enterprise Market
Need a Tailored Report?
Customize this report to your needs
Get 10% FREE Customization
Customize This Report
