
Rest Of Asia Pacific Natural Gas Power Generation Market (2025-2030)

The Rest Of Asia Pacific Natural Gas Power Generation Market was valued at $8382.1 Million in 2025 and projected to reach to $11123 Million by 2030, representing a compound annual growth rate of 5.8%. Rest Of Asia Pacific is positioned as a high-growth region for natural gas power generation, driven by the urgent need to replace aging coal infrastructure and meet stringent environmental standards.


| Market Size in | USD 26.32 MN |
| Market Forecast in | |
| CAGR | |
| Forecast Period | |
| Units Considered | Value (USD MN) |
Rest Of Asia Pacific Natural Gas Power Generation Market Trends and Insights
- Rest Of Asia Pacific is experiencing accelerating demand for cleaner energy alternatives as countries transition away from coal-dependent power systems.
- The region's natural gas infrastructure development, coupled with rising electricity consumption and supportive government policies, positions Rest Of Asia Pacific as a critical growth market for natural gas-fired generation capacity. Rest Of Asia Pacific's market expansion is driven by increasing energy security concerns, volatile fossil fuel prices, and the need for flexible baseload power to complement renewable energy integration.
- Rest Of Asia Pacific countries are investing heavily in liquefied natural gas (LNG) import terminals and pipeline infrastructure to support natural gas power generation deployment.
- Between 2025 and 2030, Rest Of Asia Pacific is expected to see significant capacity additions as utilities and independent power producers capitalize on the region's abundant natural gas resources and improving regulatory frameworks..
Key Market Statistics
- CAGR (2025-2030) 5.8% CAGR
- Market Size, 2025 ~USD 8382.1 Million
- Forecast, 2030 ~USD 11123 Million
- Country Rest Of Asia Pacific
Rest Of Asia Pacific Natural Gas Power Generation Market Overview
Market Valuation & Growth :
Rest Of Asia Pacific's natural gas power generation market is valued at USD 8,382.1 million in 2025, with a robust 5.8% CAGR projected through 2030, reaching USD 11,123.0 million. This outpaces the global growth rate of 4.8%, indicating accelerated regional adoption.
Coal-to-Gas Transition :
Countries across Rest Of Asia Pacific are actively transitioning away from coal-dependent power systems toward cleaner natural gas alternatives. This shift is driven by environmental regulations, air quality concerns, and commitments to reduce carbon emissions in the region.
Infrastructure Development :
The region is experiencing significant expansion of natural gas infrastructure, including pipeline networks, LNG terminals, and distribution facilities. These investments are critical to supporting increased natural gas power generation capacity and ensuring reliable energy supply.
Energy Security & Demand :
Rising electricity demand from rapid industrialization and urbanization across Rest Of Asia Pacific is driving investment in natural gas power plants. Natural gas offers a balanced solution for baseload power generation while supporting renewable energy integration.
Rest Of Asia Pacific Natural Gas Power Generation Market Dynamics
- Governments across the region are implementing supportive policies and regulatory frameworks that incentivize natural gas adoption as a transitional fuel toward decarbonization.
- The region's expanding middle class and industrial base continue to fuel electricity demand, making natural gas an attractive option for reliable, cleaner power generation. Investment in LNG import capacity and domestic gas infrastructure is accelerating, particularly in emerging economies within the region.
- Strategic partnerships between regional utilities and international energy companies are facilitating technology transfer and capital deployment.
- By 2030, natural gas is expected to play an increasingly pivotal role in Rest Of Asia Pacific's energy mix, supporting both economic growth and climate objectives while providing a stable bridge toward renewable energy dominance..
Market Ecosystem
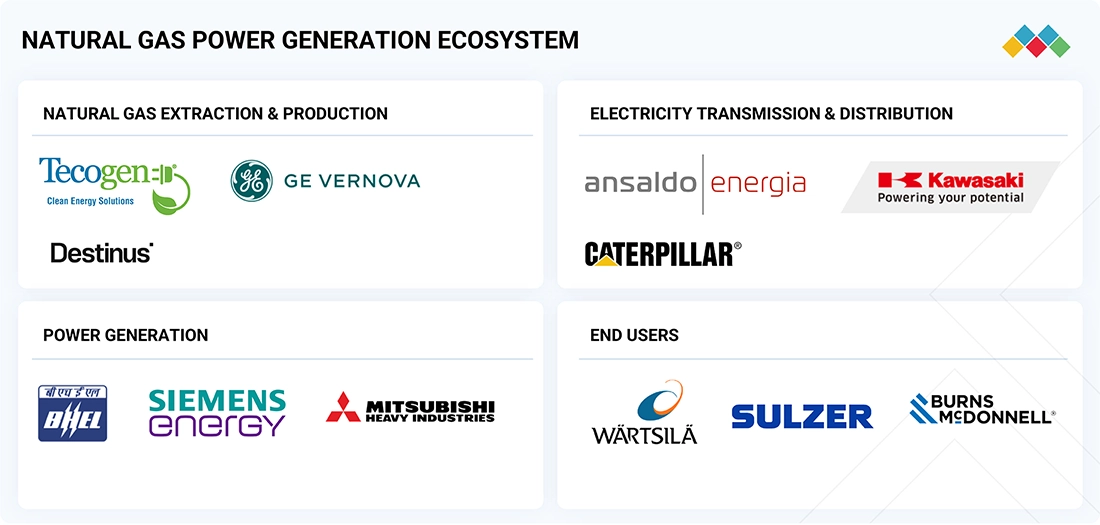
Natural Gas Power Generation Market: COMMERCIAL USE CASES ACROSS INDUSTRIES
| COMPANY | USE CASE DESCRIPTION | BENEFITS |
|---|---|---|
 |
|
|
 |
|
|
 |
|
|
Logos and trademarks shown above are the property of their respective owners. Their use here is for informational and illustrative purposes only.
Related Ecosystem
Power Infrastructure
- Geographical Information System (GIS)
- Cogeneration
- Battery Electric Vehicle (BEV)
- Cellular Network
- Fuel Cell
- Siemens ag
- ABB India Limited
- SCHNEIDER ELECTRIC SE
- General Electric Company
- Eaton Corporation plc
Key Takeaways
- Rest Of Asia Pacific's natural gas power generation market will grow from USD 8,382.1 million in 2025 to USD 11,123.0 million by 2030 at a 5.8% CAGR.
- Rest Of Asia Pacific is transitioning toward natural gas as a cleaner alternative to coal, driven by environmental regulations and energy security objectives.
- Rest Of Asia Pacific's LNG infrastructure investments and pipeline development are critical enablers for sustained market growth through 2030.
- Rest Of Asia Pacific's flexible natural gas capacity is essential for balancing intermittent renewable energy sources in the region's evolving power mix.
Natural Gas Power Generation Market Report Scope
| Report Metric | Details |
|---|---|
| Base Year | 2025 |
| Fastest Growing Segment | ABOVE 1,000 MW (Power Output) |
| Forecast Period | 2025–2030 |
| Growth Rate | CAGR of 4.8% from 2025 to 2030 |
| Largest Segment | LIQUEFIED NATURAL GAS (Fuel Source) |
| Market Size Base Year (Billions) | ~USD 96.89 (2025) |
| Revenue Forecast (Billions) | ~USD 122.49 (2030) |
| Segments Covered | Technology, Fuel Source, Power Output, End-Use Application, Type, Application |
Rest Of Asia Pacific Natural Gas Power Generation Market Report Segmentation
6 segment dimensions are covered across the global market.
By Technology
- Cogeneration
- Combined Cycle
- Open Cycle
By Fuel Source
- Liquefied Natural Gas
- Pipeline Natural Gas
By Power Output
- 201–500 Mw
- 501–1,000 Mw
- 51–200
- 51–200 Mw
- Above 1,000 Mw
- Up To 50 Mw
By End-Use Application
- Industrial
- Power Utilities
- Residential & Commercial
By Type
- 201–500 Mw
- 501–1,000 Mw
- 51–200 Mw
- Above 1,000 Mw
- Up To 50 Mw
By Application
- Liquefied Natural Gas
- Pipeline Natural Gas
Target Audience
- Energy Utility Companies : Utilities operating in Rest Of Asia Pacific need detailed market data to plan natural gas power plant investments, optimize fuel sourcing strategies, and align capacity expansion with regional demand forecasts through 2030.
- Infrastructure & Engineering Firms : Engineering and construction companies require insights into pipeline, LNG terminal, and power plant projects across Rest Of Asia Pacific to identify bidding opportunities and develop region-specific technical solutions.
- Oil & Gas Majors & Traders : International energy companies and LNG traders need comprehensive Rest Of Asia Pacific market analysis to optimize supply contracts, identify growth markets, and develop long-term commercial strategies in the region.
- Government & Policy Makers : Regional government agencies and energy ministries use market intelligence to design coal transition policies, set renewable energy targets, and allocate infrastructure investment budgets aligned with natural gas growth projections.
- Investment & Financial Analysts : Investors, private equity firms, and financial analysts require detailed Rest Of Asia Pacific market data to evaluate project returns, assess portfolio risks, and identify emerging opportunities in the region's energy transition.
Key Companies in the Rest Of Asia Pacific Natural Gas Power Generation Market
| Company | HQ | Ownership | Strongest segments |
|---|---|---|---|
| TECOGEN, INC. | United States | Public Company | Cogeneration Systems (InVerde e+, TecoPower and related CHP),Chillers and Refrigeration (Tecochill, Tecofrost and hybrid-drive solutions),Services (Operations, Maintenance, Parts, Installation), |
| FLUOR CORPORATION | United States | Public Company | Combined Cycle EPC,Open Cycle / Peaker EPC,Cogeneration / CHP EPC, |
| WORLEY | Australia | Public Company | Combined Cycle (EPC, consulting, asset performance),Open Cycle (peakers and fast-start plants),Cogeneration / CHP (industrial and district energy), |
| CATERPILLAR | United States | Public Company | Open Cycle (Gas Engines & Simple-Cycle Turbines),Cogeneration / CHP,Combined Cycle, |
| MCDERMOTT | United States | Private Company | Combined Cycle,Open Cycle,Cogeneration, |
| CALPINE | United States | Private Company | Combined Cycle Gas Power Generation,Open Cycle / Peaker Gas Generation,Cogeneration & Steam Sales, |
TECOGEN, INC.
Tecogen, Inc. is a U.S.-based public company founded in 2000 with 120 employees that develops and manufactures clean energy and power generation technologies.
FLUOR CORPORATION
Fluor Corporation is a U.S.-based public engineering and construction company founded in 1912 with approximately 23,000 employees, providing services to energy and industrial sectors.
WORLEY
Worley is an Australian-based public company founded in 1971 with over 38,000 employees, providing professional services in engineering, procurement, and project delivery.
CATERPILLAR
Caterpillar is a U.S.-based public company founded in 1925 with 118,000 employees, manufacturing heavy equipment, engines, and power generation systems.
MCDERMOTT
McDermott is a U.S.-based private company founded in 1959 with 42,600 employees, providing engineering, procurement, and construction services to the energy industry.
CALPINE
Calpine is a U.S.-based private company founded in 1984 with 2,500 employees, operating as an independent power producer generating electricity from natural gas and renewable sources.
Reasons to Buy this Report
- Regional Growth Opportunity : Capture insights into the fastest-growing regional segment with 5.8% CAGR, outpacing global averages. Identify high-potential markets within Rest Of Asia Pacific for strategic expansion and investment allocation.
- Infrastructure Investment Roadmap : Understand the scale and timeline of natural gas infrastructure development across the region. Access detailed data on pipeline projects, LNG terminals, and distribution networks to inform supply chain and partnership strategies.
- Policy & Regulatory Landscape : Gain clarity on country-specific environmental regulations, coal phase-out timelines, and natural gas incentive programs driving market growth. Navigate regulatory complexities with confidence across diverse Rest Of Asia Pacific markets.
- Competitive Positioning : Benchmark your operations against regional competitors and identify market gaps. Understand local demand patterns, utility procurement strategies, and emerging players reshaping the Rest Of Asia Pacific natural gas sector.
- Demand Forecasting & Planning : Leverage granular market projections to USD 11,123.0 million by 2030 for accurate capacity planning and revenue forecasting. Align production, distribution, and service strategies with region-specific growth trajectories.
Frequently asked questions
What is the market size of natural gas power generation in Rest Of Asia Pacific in 2025?
Rest Of Asia Pacific's natural gas power generation market is valued at USD 8,382.1 million in 2025.
What is the projected market size for Rest Of Asia Pacific by 2030?
Rest Of Asia Pacific's natural gas power generation market is forecast to reach USD 11,123.0 million by 2030.
What is the CAGR for Rest Of Asia Pacific's natural gas power generation market?
Rest Of Asia Pacific's natural gas power generation market is expected to grow at a compound annual growth rate of 5.8% from 2025 to 2030.
What are the primary drivers of growth in Rest Of Asia Pacific's natural gas market?
Rest Of Asia Pacific's growth is driven by coal-to-gas transitions, rising electricity demand, LNG infrastructure expansion, renewable energy integration needs, and supportive government policies.
Why is natural gas power generation important for Rest Of Asia Pacific?
Rest Of Asia Pacific relies on natural gas power generation for energy security, environmental compliance, flexible baseload capacity, and as a bridge fuel during the transition to renewable energy sources.
RESEARCH METHODOLOGY
This research study involved the use of extensive secondary sources such as press releases, investment reports, industry white papers, presentations, and other publicly available sources to identify and collect information useful for a technical, market-oriented, and commercial study of the natural gas power generation market. Primary sources include several industry experts from the core and related industries, preferred suppliers, manufacturers, distributors, service providers, technology developers, standards and certification organizations from companies, and organizations related to all the segments of this industry’s value chain. In-depth interviews were conducted with various primary respondents, which include key industry participants, subject-matter experts, C-level executives of key market players, and industry consultants, among other experts, to obtain and verify qualitative and quantitative information as well as assess prospects.
Secondary Research
Secondary sources referred to for this research study include annual reports, press releases, investor presentations of companies, white papers, certified publications, articles from recognized authors, and databases of various companies and associations. Secondary research has been mainly used to obtain key information about the industry’s supply chain to identify the key players offering various products and services, market classification and segmentation according to the offerings of major players, industry trends to the bottom-most level, regional markets, and key developments from market- and technology-oriented perspectives.
Primary Research
In the primary research process, various primary sources from both supply and demand sides were interviewed to obtain qualitative and quantitative information for this report. Primary sources from the supply side include industry experts such as chief executive officers (CEO), vice presidents, marketing directors, technology and innovation directors, and related key executives from various companies and organizations operating in the natural gas power generation market.
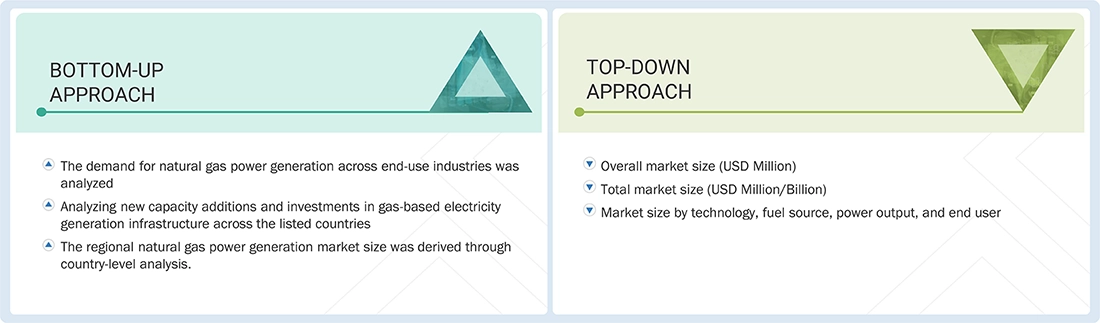
In the complete market engineering process, both top-down and bottom-up approaches were extensively used, along with several data triangulation methods, to perform the market size estimations and forecasts for all segments and subsegments listed in this report. Extensive qualitative and quantitative analyses were conducted to complete the market engineering process to list key information/insights throughout the report.
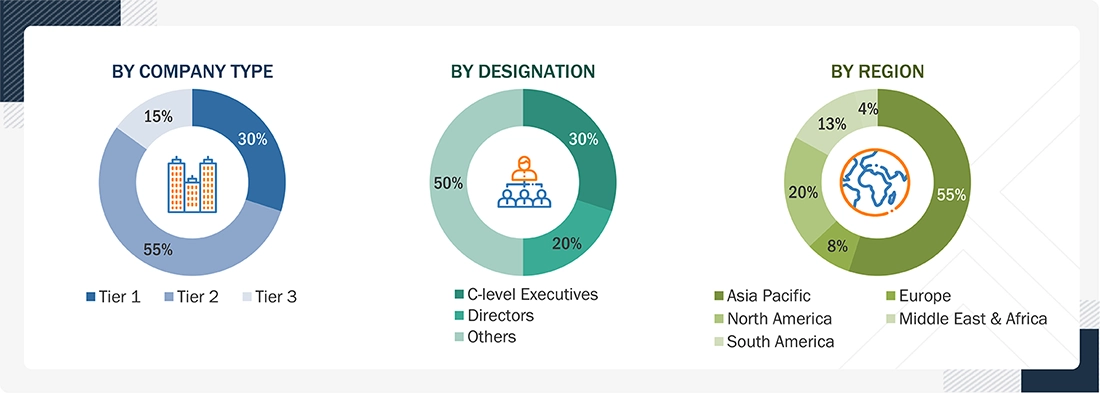
To know about the assumptions considered for the study, download the pdf brochure
Market Size Estimation
Both top-down and bottom-up approaches were used to estimate and validate the size of the global Natural gas power generation market and its dependent submarkets. The key players in the market were identified through secondary research, and their market shares in the respective regions were determined through both primary and secondary research. The research methodology included in the study is from the annual and financial reports of the top market players, and from interviews with industry experts, such as CEOs, VPs, directors, sales managers, and marketing executives, for key insights, both quantitative and qualitative, into the market. The following segments provide details about the overall market size estimation process employed in this study.
Natural Gas Power Generation Market : Top-Down and Bottom-Up Approach
Data Triangulation
After arriving at the overall market size from the estimation process explained below, the total market was split into several segments and subsegments. The data triangulation and market breakdown procedures were employed, wherever applicable, to complete the overall market engineering process and arrive at the exact statistics for all the segments and subsegments. The data was triangulated by studying various factors and trends from both the demand and supply sides. Along with this, the market was validated using both the top-down and bottom-up approaches.
Market Definition
According to IEA, the natural gas power generation market encompasses the production of electricity through the combustion of natural gas, primarily methane (CH4), which is the largest component of natural gas. Natural gas is a fossil fuel energy source consisting of various hydrocarbons, with methane being the most prevalent. It is easily stored and can be delivered through pipelines or liquefied and transported by ship. Gas-fired power plants are valued for their ability to turn on and off quickly, making them a convenient way to respond to both seasonal and short-term demand fluctuations. Natural gas accounts for about a quarter of global electricity generation and plays a significant role in providing a reliable and flexible power supply.
Stakeholders
- Natural Gas Suppliers & Producers
- Power Generation Companies / Utilities
- Engineering, Procurement, and Construction (EPC) Contractors
- Turbine & Equipment Manufacturers
- Operation & Maintenance (O&M) Service Providers
- Consulting Companies
- Energy Regulators & Authorities
- Government and Research Organizations
- Industry Associations & Power/Utility Forums
- Standards & Certification Bodies
- Technology & Innovation Partners
Report Objectives
- To define, describe, segment, and forecast the size of the natural gas power generation market, by technology, fuel source, power output, end user, and region, in terms of value
- To segment and forecast the size of the natural gas power generation market by region, in terms of volume
- To forecast the market sizes for five key regions, namely North America, Europe, Asia Pacific, Middle East & Africa, and South America
- To provide detailed information regarding key drivers, restraints, opportunities, and challenges influencing the growth of the natural gas power generation market
- To offer the supply chain analysis, trends/disruptions impacting customer business, ecosystem analysis, regulatory landscape, patent analysis, case study analysis, technology analysis, key conferences & events, the impact of AI/Gen AI, macroeconomic outlook, pricing analysis, Porter’s five forces analysis, and regulatory analysis, the impact of the 2025 US tariff on the market
- To analyze opportunities for stakeholders in the natural gas power generation market and draw a competitive landscape of the market
- To benchmark market players using the company evaluation matrix, which analyzes market players on broad categories of business and product strategies adopted by them
- To compare key market players for the market share, product specifications, and end uses
- To strategically profile key players and comprehensively analyze their market ranking and core competencies
- To analyze competitive developments, such as contracts, agreements, partnerships, and joint ventures, in the natural gas power generation market
Available Customizations
MarketsandMarkets offers customizations according to the specific needs of the companies with the given market data.
The following customization options are available for the report:
Product Analysis
- Product matrix, which gives a detailed comparison of the product portfolio of each company
Geographic Analysis as per Feasibility
- Further breakdown of the natural gas power generation market, by North America, Europe, Asia Pacific, Middle East & Africa, and South America.
Company Information
- Detailed analysis and profiling of additional market players (up to five)
Get the Full Natural Gas Power Generation Market Report
Full forecast, segment splits, and company analysis for all Natural Gas Power Generation Market.
- China Natural Gas Power Generation Market
- Indonesia Natural Gas Power Generation Market
- South Korea Natural Gas Power Generation Market
- Thailand Natural Gas Power Generation Market
- Japan Natural Gas Power Generation Market
- Canada Natural Gas Power Generation Market
- Mexico Natural Gas Power Generation Market
- US Natural Gas Power Generation Market
- Brazil Natural Gas Power Generation Market
- Argentina Natural Gas Power Generation Market
- Russia Natural Gas Power Generation Market
- UK Natural Gas Power Generation Market
- Germany Natural Gas Power Generation Market
- Italy Natural Gas Power Generation Market
- France Natural Gas Power Generation Market
- Saudi Arabia Natural Gas Power Generation Market
- UAE Natural Gas Power Generation Market
- Iran Natural Gas Power Generation Market
- Nigeria Natural Gas Power Generation Market
- Rest Of Europe Natural Gas Power Generation Market
- Algeria Natural Gas Power Generation Market
- GCC Natural Gas Power Generation Market
- Rest Of South America Natural Gas Power Generation Market
- Rest Of GCC Natural Gas Power Generation Market
Need a Tailored Report?
Customize this report to your needs
Get 10% FREE Customization
Customize This Report
