
US Network Emulator Market (2025-2030)

The US Network Emulator Market was valued at $75 Million in 2025 and projected to reach to $99.5 Million by 2030, representing a compound annual growth rate of 5.8%. The US network emulator market is positioned for sustained growth as enterprises increasingly recognize the value of comprehensive network testing before production deployment.


| Market Size in | USD 26.32 MN |
| Market Forecast in | |
| CAGR | |
| Forecast Period | |
| Units Considered | Value (USD MN) |
US Network Emulator Market Trends and Insights
- The US market is driven by increasing demand for network testing and simulation solutions across telecommunications, cloud computing, and enterprise IT sectors.
- In the US, organizations are investing heavily in network emulation technologies to optimize performance, reduce latency, and ensure reliability before deploying critical infrastructure. The US network emulator market benefits from the country's advanced technological infrastructure and the presence of major technology companies and service providers.
- Throughout the forecast period from 2025 to 2030, the US is expected to maintain its position as a key market for network emulation solutions, supported by growing adoption of 5G networks, edge computing, and software-defined networking (SDN).
- The US market's growth trajectory reflects the region's commitment to digital transformation and network optimization across multiple industries..
Key Market Statistics
- CAGR (2025-2030) 5.8% CAGR
- Market Size, 2025 ~USD 75 Million
- Forecast, 2030 ~USD 99.5 Million
- Country US
US Network Emulator Market Overview
Market Size & Growth :
The US network emulator market is valued at $75.0 million in 2025, with a projected CAGR of 5.8% through 2030, reaching $99.5 million. This steady growth reflects increasing adoption of network testing solutions across American enterprises.
Key Driving Sectors :
Telecommunications, cloud computing, and enterprise IT sectors are primary growth drivers in the US market. Organizations are prioritizing network emulation to optimize performance, reduce latency, and ensure service reliability across distributed infrastructure.
Technology Investment Trends :
US companies are significantly increasing capital allocation toward network simulation and emulation technologies. This investment surge is driven by the need for comprehensive testing environments before deploying critical network changes and new services.
Competitive Landscape :
The US market features a mix of established vendors and emerging solution providers offering specialized network emulation platforms. Competition is intensifying around advanced features, ease of integration, and cost-effectiveness for mid-market and enterprise customers.
US Network Emulator Market Dynamics
- The shift toward cloud-native architectures, 5G infrastructure expansion, and hybrid IT environments is accelerating demand for sophisticated emulation solutions.
- Organizations across telecommunications, financial services, and technology sectors are investing in these tools to minimize downtime, optimize network performance, and reduce operational risks. Looking ahead to 2030, the US market will benefit from growing complexity in network environments, increased regulatory compliance requirements, and the need for continuous testing in DevOps workflows.
- As network infrastructure becomes more critical to business operations, investment in emulation technologies will remain a priority for IT decision-makers seeking to validate network changes and ensure service quality..
Market Ecosystem
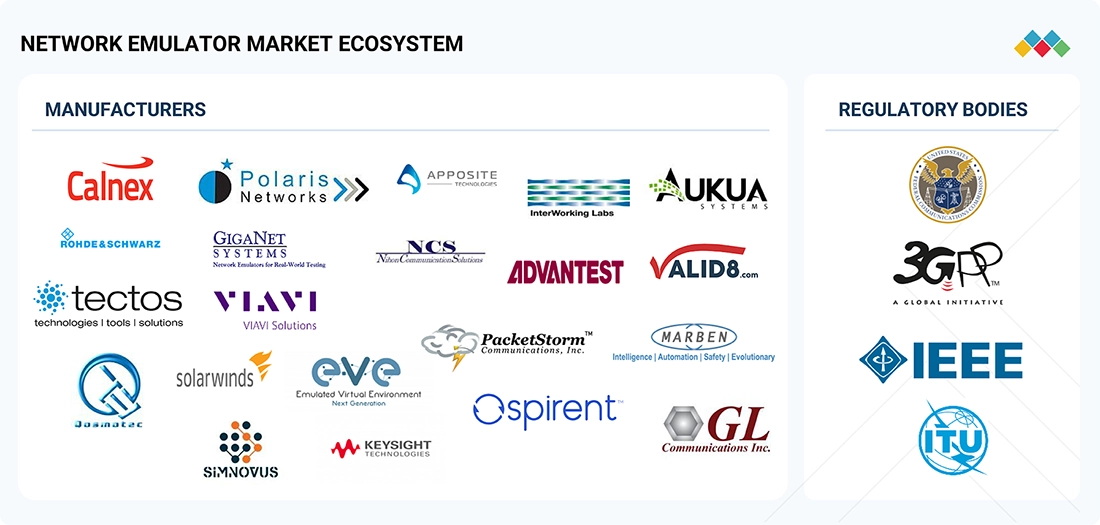
Network Emulator Market: COMMERCIAL USE CASES ACROSS INDUSTRIES
| COMPANY | USE CASE DESCRIPTION | BENEFITS |
|---|---|---|
 |
Nuasis Corporation provides an IP-based contact center solution. The IP-based multimedia offering provides Nuasis Corporation’s customers with a highly reliable and scalable architecture to manage multiple sites as if they were one large call center. Voice communication over the packet data network has unique requirements and needs improvements. | PacketStorm Communication provided its network emulation test tools to ensure the quality of its products. Voice, file transfers, and web interaction, all these functions were tested to improve the Quality of Service (QoS). Nuasis Corporation was able to emulate the queuing algorithms and traffic prioritization that routers execute to deal with different types of traffic issues simultaneously. |
 |
VeriSign operates systems that manage .COM and .NET, handling as many as 21 billion web and email lookups every day. VeriSign also provides managed security services , security consulting, strong authentication solutions, anti-phishing services, and commercial security services to organizations throughout the world. It needs to test SIP solutions developed on a virtual network. | The company chose Spirent Communication’s TTCN-3 Tools, which provides robustness, flexibility, extensibility, and support for the protocols VeriSign desired immediately. It also provides the capability to integrate other protocols with minimal effort in the future. The tool is used to test the company’s home-grown SIP stack with a focus on testing SIP Proxy and Redirect server functionality. |
 |
One of the largest banks in the US was embracing a network transformation project of its WAN from Multi-Protocol Label Switching (MPLS) to SD-WAN. The company worked with its system vendor to add SD-WAN capability to its existing switches and infrastructure but ran into significant issues with the integration of the new features. | Calnex’s network emulator was used by the bank to emulate the complex mesh networks and test the SD-WAN updates on the switches in a test lab. The updates were done one at a time, and the services were tested accordingly until the causes of the issues were identified and resolved. |
Logos and trademarks shown above are the property of their respective owners. Their use here is for informational and illustrative purposes only.
Related Ecosystem
Data Centre And Networking
- Software-Defined Networking (SDN)
- Mid-Sized Data Centers
- Small Data Centers
- Remote Monitoring
- Smart Healthcare
- Cisco Systems, Inc.
- HUAWEI TECHNOLOGIES CO LTD
- Hewlett Packard Enterprise Company
- MITSUBISHI ELECTRIC INFORMATION SYSTEMS CORPORATION
- MITSUBISHI ELECTRIC INFORMATION NETWORK CORPORATION
Key Takeaways
- The US network emulator market is valued at $75.0 million in 2025 and is forecast to reach $99.5 million by 2030, representing a 5.8% CAGR.
- The US market is driven by enterprise demand for network testing, 5G deployment validation, and cloud infrastructure optimization.
- The US benefits from a mature technology ecosystem with significant investments in telecommunications and digital infrastructure.
- The US network emulator market is expected to see increased adoption across financial services, healthcare, and government sectors through 2030.
Network Emulator Market Report Scope
| Report Metric | Details |
|---|---|
| Base Year | 2025 |
| Fastest Growing Segment | SDN MONITORING (Solution) |
| Forecast Period | 2025–2030 |
| Growth Rate | CAGR of 7.4% from 2025 to 2030 |
| Largest Segment | VERTICALS (End User) |
| Market Size Base Year (Billions) | ~USD 0.25 (2025) |
| Revenue Forecast (Billions) | ~USD 0.36 (2030) |
| Segments Covered | Offering, Application Type, Vertical, Component, Solution, End User, Type |
US Network Emulator Market Report Segmentation
7 segment dimensions are covered across the global market.
By Offering
- Hardware
- Software
By Application Type
- Cloud
- IoT
- Other Application Types
- Sd-Wan
By Vertical
- Bfsi
- Government
- Government & Defense
- Government And Utilities
- Healthcare
- It & Telecom
- Manufacturing
- Media And Entertainment
- Other Verticals
- Others*
- Retail
- Telecommunications
- Transportation & Logistics
By Component
- Platforms
- Professional Services
- Services
- Solutions
By Solution
- Cloud Monitoring
- Log & Event Management
- Network Configuration
- Network Performance & Monitoring
- Other Solutions
- Sdn Monitoring
- Virtual Monitoring
By End User
- Enterprises
- Service Providers
- Verticals
By Type
- Internet Service Providers And Cable Operators
- Managed Service Providers
- Telecom Operators
US: NETWORK EMULATOR MARKET, BY APPLICATION TYPE, 2025–2030
| Segment | 2025 | 2026 | 2027 | 2028 | 2029 | 2030 | CAGR (%) |
|---|---|---|---|---|---|---|---|
| CLOUD | 21.3 | 22.6 | 23.9 | 25.3 | 26.6 | 27.9 | 5.6 |
| IOT | 16.1 | 17.3 | 18.4 | 19.6 | 20.9 | 22.1 | 6.5 |
| OTHER APPLICATION TYPES | 11.6 | 12.3 | 12.9 | 13.6 | 14.2 | 14.9 | 5 |
| SD-WAN | 26 | 27.7 | 29.4 | 31.2 | 32.9 | 34.7 | 5.9 |
| TOTAL | 75 | 79.9 | 84.7 | 89.7 | 94.6 | 99.5 | 5.8 |
Target Audience
- Network Equipment Vendors : Understand US market demand for emulation capabilities to integrate into networking products. Identify customer pain points and feature requirements to enhance competitive positioning in the American enterprise market.
- Software & SaaS Providers : Evaluate the US network emulator market opportunity for new product launches or acquisitions. Assess market readiness, customer willingness to adopt cloud-based solutions, and pricing strategies for American organizations.
- IT Consulting & Systems Integrators : Gain insights into US customer demand for network testing services and emulation solutions. Identify opportunities to bundle emulation tools with consulting services and expand service offerings to enterprise clients.
- Enterprise IT Decision-Makers : Understand market trends, vendor options, and best practices for network emulation in the US. Make informed procurement decisions and validate technology investments aligned with industry standards and peer adoption.
- Investment & Private Equity Firms : Evaluate investment opportunities in US network emulation companies. Assess market growth potential, competitive dynamics, and exit opportunities within the expanding American ICT infrastructure testing sector.
Key Companies in the US Network Emulator Market
| Company | HQ | Ownership | Strongest segments |
|---|---|---|---|
| SPIRENT COMMUNICATIONS | United Kingdom | ||
| KEYSIGHT TECHNOLOGIES | United States | ||
| CALNEX SOLUTIONS | United Kingdom | Public Company | Hardware synchronization and performance test platforms (Paragon family, Attero, Sentinel, Sentry, Rb/GPS, converters),Software-centric network emulation (Calnex SNE, SNE-X, SNE Ignite, NE-ONE Enterprise/Professional, analysis tools),Services, support, and specialized software options (Paragon-ONE profiles, protocol field verifier, customization), |
| VIAVI SOLUTIONS | United States | ||
| SOLARWINDS | United States | Private Company | Software-based performance testing and network emulation (NTA, SAM, VMAN, IPAM-linked),Application testing and observability (observability suites, Squadcast by SolarWinds),Hardware-linked and appliance-adjacent use cases, |
SPIRENT COMMUNICATIONS
Spirent Communications is a United Kingdom-based company providing testing, assurance, and analytics solutions for communications technology and networks.
KEYSIGHT TECHNOLOGIES
Keysight Technologies is a United States-based company specializing in electronic measurement and testing solutions for communications, aerospace, and industrial markets.
CALNEX SOLUTIONS
Calnex Solutions is a United Kingdom-based public company founded in 2006 with 163 employees, specializing in network testing and assurance solutions.
VIAVI SOLUTIONS
Viavi Solutions is a United States-based company offering network testing, software, and analytics solutions for telecommunications and broadband networks.
SOLARWINDS
SolarWinds is a United States-based private company founded in 1999 with 2,107 employees, specializing in IT management and network monitoring software.
Reasons to Buy this Report
- Market Size & Valuation Data : Access precise US market valuation ($75.0M in 2025) and 5-year forecast projections through 2030. Make informed investment and expansion decisions based on accurate market sizing specific to the American network emulator sector.
- Sector-Specific Insights : Understand which US industries—telecommunications, cloud computing, and enterprise IT—are driving adoption and where growth opportunities exist. Identify high-potential customer segments and tailor your go-to-market strategy accordingly.
- Competitive Intelligence : Benchmark your position against competitors in the US market. Understand market dynamics, vendor strategies, and differentiation opportunities to strengthen your competitive advantage and market share.
- Growth Trajectory Analysis : Leverage the 5.8% CAGR data to forecast revenue potential, plan resource allocation, and set realistic growth targets. Compare US market performance against global trends (7.4% CAGR) to identify relative opportunities.
- Strategic Planning & Investment : Use comprehensive US market intelligence to support business case development, funding proposals, and strategic roadmap planning. Make data-driven decisions on product development, partnerships, and market entry strategies.
Frequently asked questions
What is the current size of the US network emulator market?
The US network emulator market is valued at $75.0 million in 2025 and is expected to grow to $99.5 million by 2030.
What is the growth rate of the US network emulator market?
The US network emulator market is projected to grow at a compound annual growth rate (CAGR) of 5.8% from 2025 to 2030.
What are the primary drivers of growth in the US network emulator market?
The US market is driven by increasing 5G deployments, cloud computing expansion, enterprise digital transformation initiatives, and the need for comprehensive network testing solutions.
Which industries in the US are adopting network emulation solutions?
The US network emulator market serves telecommunications, financial services, healthcare, government, cloud service providers, and large enterprises requiring network optimization and testing.
What is the forecast for the US network emulator market by 2030?
The US network emulator market is forecast to reach $99.5 million by 2030, growing from $75.0 million in 2025 at a 5.8% CAGR.
RESEARCH METHODOLOGY
This research study on the network emulator market involved extensive secondary sources, directories, and several journals and databases, such as D&B Hoovers, Bloomberg Businessweek, and Factiva, to identify and collect information useful for this technical, market-oriented, and commercial study of the network emulator market. Primary sources were industry experts from core and related industries, preferred system developers, service providers, resellers, partners, and organizations related to the various segments of the industry’s value chain. In-depth interviews were conducted with different primary respondents, including key industry participants and subject-matter experts, to obtain and verify critical qualitative and quantitative information, as well as to assess the market’s prospects. These included key industry participants, subject-matter experts, C-level executives of key companies, and industry consultants. Primary sources were mainly industry experts from the core and related industries, preferred network emulator providers, third-party service providers, consulting service providers, end users, and other commercial enterprises. In-depth interviews were conducted with various primary respondents, including key industry participants and subject matter experts, to obtain and verify critical qualitative and quantitative information and assess growth prospects. The following figure highlights the market research methodology applied to make the network emulator market report.
Secondary Research
The market size of companies offering network emulator hardware and software was determined based on secondary data available through paid and unpaid sources. It was also arrived at by analyzing the product portfolios of major companies and rating the companies based on their performance and quality.
In the secondary research process, various sources were referred to to identify and collect information for this study. Secondary sources included annual reports, press releases, and investor presentations of companies; white papers, journals, and certified publications; and articles from recognized authors, directories, and databases. The data was also collected from other secondary sources, such as journals and related magazines. Network emulator spending of various countries was extracted from the respective sources. Secondary research was mainly used to obtain the key information related to the industry’s value chain and supply chain to identify key players, market classification, and segmentation according to offerings of major players; industry trends related to the offering, application type, test type, vertical, and regions; and key developments from both market and technology-oriented perspectives.
Primary Research
In the primary research process, various primary sources from both the supply and demand sides were interviewed to obtain qualitative and quantitative information for the report. The primary sources from the supply side included industry experts, such as Chief Executive Officers (CEOs), Vice Presidents (VPs), marketing directors, technology and innovation directors, and related key executives from various key companies and organizations providing network emulator solutions and services. The primary sources from the demand side included end users, such as Chief Information Officers (CIOs), consultants, service professionals, technicians and technologists, and managers at public and investor-owned utilities.
In the market engineering process, top-down and bottom-up approaches were extensively used, along with several data triangulation methods, to perform market estimation and market forecasting for the overall market segments and subsegments listed in the report. Extensive qualitative and quantitative analyses were performed on the complete market engineering process to list key information/insights throughout the report.
After the complete market engineering (including calculations for market statistics, market breakup, market size estimations, market forecasting, and data triangulation), extensive primary research was conducted to gather information. Primary research was conducted to identify the segmentation, industry trends, key players, competitive landscape, and key market dynamics, such as drivers, restraints, opportunities, challenges, industry trends, and key strategies.
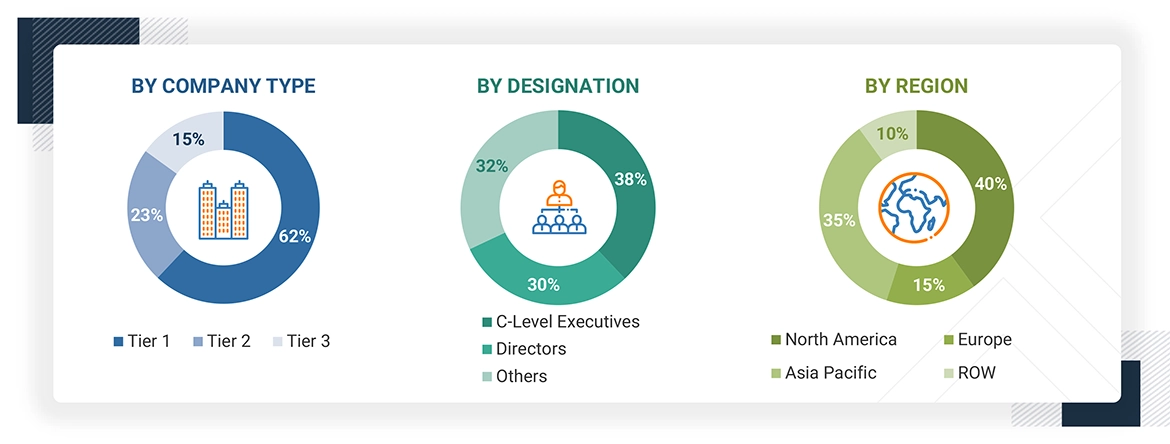
Note: Tier 1 companies have revenues greater than USD 10 billion; tier 2 companies' revenues range between USD 1 and 10 billion; and tier 3 companies' revenues range between USD 500 million and 1 billion. Other designations include sales, marketing, and product managers.
Source: Secondary Research, Interviews with Experts, and MarketsandMarkets Analysis
To know about the assumptions considered for the study, download the pdf brochure
Market Size Estimation
Multiple approaches were adopted to estimate and forecast the network emulator market. The first approach involved estimating the market size by the summation of the companies’ revenue generated through the sale of services.
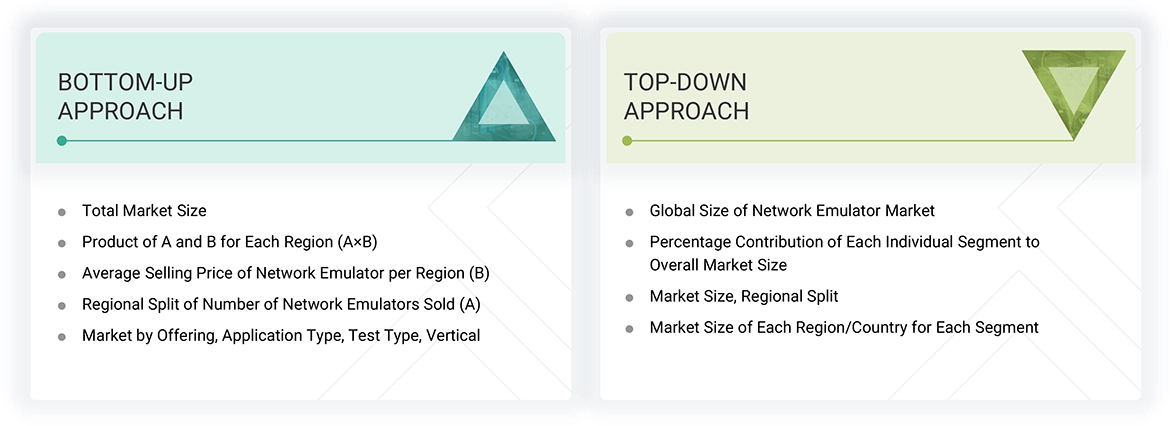
Top-down and Bottom-up Approaches
The research methodology used to estimate the market size included the following:
- Primary and secondary research was used to determine the revenue contributions of the major market participants in each country after secondary research helped identify them.
- Throughout the process, critical insights were obtained by conducting in-depth interviews with industry professionals, including directors, CEOs, VPs, and marketing executives, and by reading the annual and financial reports of the top firms in the market.
- Primary sources were used to verify all percentage splits and breakups, which were calculated using secondary sources.
Network Emulator Market : Top-Down and Bottom-Up Approach
Data Triangulation
Once the overall market size was determined, the market was divided into segments and subsegments using the previously described market size estimation procedures. When required, market breakdown and data triangulation procedures were employed to complete the market engineering process and specify the exact figures for every market segment and subsegment. The data was triangulated by examining several variables and patterns from the government entities' supply and demand sides.
Market Definition
Network emulators are products that replicate real-time network performance, enable manipulation of bandwidth constraints, and apply network impairments, such as packet loss, delay, and jitter, to accurately gauge applications’ responsiveness and throughput and the quality of end-user experience, to provide quality assurance, proof of concept, and troubleshooting.
Network emulators can duplicate various network circumstances, encompassing constraints on bandwidth, latency, packet loss, jitter, and an assortment of network topologies. This capability empowers developers, network administrators, and researchers to evaluate the performance of their applications or systems across diverse network conditions, enabling them to proactively pinpoint potential problems before they manifest in an actual operational environment.
Stakeholders
- Network Emulator Vendors
- Network and System Integrators (SIs)
- Managed Service Providers (MSPs)
- Cloud Service Providers
- Internet Service Providers (ISPs)
- Fixed and Mobile Broadband Network Providers
- Communication Service Providers (CSPs)
- Content Delivery Network (CDN) Providers
- Independent Software Vendors (ISVs)
Report Objectives
- To define, describe, and forecast the network emulator market in terms of value
- To provide detailed information regarding drivers, restraints, opportunities, and challenges influencing the growth of the market
- To forecast the market based on offering (hardware, software), application type, test type, vertical, and region
- To forecast the market size of segments for five main regions: North America, Europe, Asia Pacific, the Middle East & Africa, and Latin America
- To analyze opportunities in the market and provide details of the competitive landscape for stakeholders and market leaders
- To profile the key market players, including top vendors and startups; provide a comparative analysis based on business overviews, regional presence, product offerings, business strategies, and key financials; and provide a detailed competitive landscape of the market
- To analyze competitive developments, such as mergers & acquisitions (M&A), product launches/enhancements, agreements, partnerships, collaborations, expansions, and R&D activities, in the market
Customization Options
MarketsandMarkets provides customizations based on the company's unique requirements using market data. The following customization options are available for the report:
Product analysis
- The product matrix provides a detailed comparison of each company's portfolio.
Geographic analysis
- Further breakup of the network emulator market
Company Information
- Detailed analysis and profiling of five additional market players
Get the Full Network Emulator Market Report
Full forecast, segment splits, and company analysis for all Network Emulator Market.
- UK Network Emulator Market
- Italy Network Emulator Market
- Canada Network Emulator Market
- France Network Emulator Market
- Germany Network Emulator Market
- Nordics Network Emulator Market
- Rest Of Europe Network Emulator Market
- Spain Network Emulator Market
- Anz Network Emulator Market
- China Network Emulator Market
- India Network Emulator Market
- Japan Network Emulator Market
- Rest Of Apac Network Emulator Market
- Sea Network Emulator Market
- Brazil Network Emulator Market
- Mexico Network Emulator Market
- Rest Of Latin America Network Emulator Market
- Ksa Network Emulator Market
- South Africa Network Emulator Market
- UAE Network Emulator Market
Need a Tailored Report?
Customize this report to your needs
Get 10% FREE Customization
Customize This Report
