
Australia Particle Counters Market (2024-2029)

The Australia Particle Counters Market was valued at $5.5 Million in 2024 and projected to reach to $8.3 Million by 2029, representing a compound annual growth rate of 8.8%. Australia's particle counters market is poised for steady expansion, driven by heightened regulatory requirements and the pharmaceutical industry's focus on product quality and safety.


| Market Size in | USD 26.32 MN |
| Market Forecast in | |
| CAGR | |
| Forecast Period | |
| Units Considered | Value (USD MN) |
Australia Particle Counters Market Trends and Insights
- Valued at USD 5.5 million in 2024, Australia's market is projected to expand to USD 8.3 million by 2029, driven by increasing demand for contamination control in pharmaceutical and medical device manufacturing.
- Australia's healthcare infrastructure and stringent regulatory standards are propelling adoption of advanced particle counting technologies across cleanroom environments and quality assurance operations. The Australian particle counters market benefits from the country's robust pharmaceutical manufacturing base and growing emphasis on product quality and safety compliance.
- Between 2024 and 2029, Australia is expected to see accelerated investment in particle counting solutions as healthcare facilities and manufacturers upgrade their monitoring capabilities.
- Australia's position as a regional healthcare hub supports sustained market expansion, with local manufacturers and international suppliers competing to meet the nation's evolving contamination detection requirements..
Key Market Statistics
- CAGR (2024-2029) 8.8% CAGR
- Market Size, 2024 ~USD 5.5 Million
- Forecast, 2029 ~USD 8.3 Million
- Country Australia
Australia Particle Counters Market Overview
Market Valuation :
Australia's particle counters market is valued at USD 5.5 million in 2024, with projected growth to USD 8.3 million by 2029, representing a robust 8.8% CAGR.
Regulatory Compliance Driver :
Australia's stringent TGA (Therapeutic Goods Administration) and NATA standards are compelling pharmaceutical and medical device manufacturers to invest in advanced particle counting solutions for contamination control.
Pharmaceutical Manufacturing Growth :
Increasing demand for contamination control in Australian pharmaceutical and medical device manufacturing facilities is accelerating adoption of particle counter technologies across cleanroom environments.
Healthcare Infrastructure Investment :
Australia's advanced healthcare infrastructure and commitment to quality assurance in manufacturing are positioning the country as a key market for particle counting instrumentation in the Asia Pacific region.
Australia Particle Counters Market Dynamics
- The market's 8.8% CAGR reflects growing investments in cleanroom technology and contamination monitoring across manufacturing facilities.
- Increasing awareness of air quality standards and compliance with international pharmaceutical guidelines are key growth catalysts.
- The Australian healthcare sector's emphasis on maintaining world-class manufacturing standards ensures sustained demand for particle counting solutions through 2029..
Market Ecosystem
Related Ecosystem
Analytical And Scientific Instrumentation
- Environmental Testing
- Gas Chromatography
- Polymerase Chain Reaction (PCR)
- Automated Liquid Handling Systems
- Flow Cytometry
- Thermo Fisher Scientific Inc.
- Danaher Corporation
- Agilent Technologies, Inc.
- Shimadzu Corporation
- Merck KGaA
Key Takeaways
- Australia's particle counters market is valued at USD 5.5 million in 2024 and is forecast to reach USD 8.3 million by 2029.
- Australia is experiencing an 8.8% compound annual growth rate, reflecting strong demand for contamination control solutions in healthcare.
- Australia's stringent regulatory environment and pharmaceutical manufacturing sector are primary drivers of particle counter adoption.
- Australia's market growth is supported by increasing investment in cleanroom technology and quality assurance infrastructure across the healthcare industry.
Particle Counters Market Report Scope
| Report Metric | Details |
|---|---|
| Base Year | 2024 |
| Fastest Growing Segment | PHARMACEUTICAL AND MEDICAL DEVICE INDUSTRY (End User) |
| Forecast Period | 2024-2029 |
| Growth Rate | CAGR of 9.5% from 2024 to 2029 |
| Largest Segment | AIR PARTICLE COUNTERS (Type) |
| Market Size Base Year (Billions) | ~USD 0.63 (2024) |
| Revenue Forecast (Billions) | ~USD 0.99 (2029) |
| Segments Covered | Type, Application, End User |
Australia Particle Counters Market Report Segmentation
3 segment dimensions are covered across the global market.
By Type
- Air Particle Counters
- Benchtop Particle Counters
- Liquid Particle Counters
- Offline Particle Counters
- Online Particle Counters
- Other Liquid Particle Counter
- Other Liquid Particle Counters
- Other Particle Counters
- Portable Particle Counters
- Remote Particle Counters
By Application
- Aerosol Monitoring & Research
- Aerosol Monitoring And Research
- Chemical Contamination Monitoring
- Cleanroom Monitoring
- Contamination Monitoring Of Liquids
- Drinking Water Contamination Monitoring
- Indoor Air Quality Monitoring
- Liquid Contamination Monitoring
- Other Applications
By End User
- Aerospace Industry
- Automotive Industry
- Chemical & Petrochemical Industry
- Chemical Petrochemical Industry
- Food & Beverage Industry
- Life Sciences & Medical Device Industry
- Pharmaceutical & Medical Device Industry
- Pharmaceutical And Medical Device Industry
- Research Institutes & Laboratories
- Semiconductor & Electronics Industry
- Semiconductor Industry
AUSTRALIA: PARTICLE COUNTERS MARKET, BY END USER, 2022–2029
| Segment | 2022 | 2023 | 2024 | 2025 | 2026 | 2027 | 2028 | 2029 | CAGR (%) |
|---|---|---|---|---|---|---|---|---|---|
| AEROSPACE INDUSTRY | 0.55 | 0.55 | 0.56 | 0.57 | 0.59 | 0.61 | 0.65 | 0.69 | 4.1 |
| AUTOMOTIVE INDUSTRY | 0.9 | 0.92 | 0.94 | 0.98 | 1.02 | 1.08 | 1.15 | 1.25 | 5.8 |
| CHEMICAL PETROCHEMICAL INDUSTRY | 0.48 | 0.49 | 0.51 | 0.53 | 0.56 | 0.59 | 0.64 | 0.69 | 6.5 |
| FOOD & BEVERAGE INDUSTRY | 0.52 | 0.52 | 0.52 | 0.53 | 0.54 | 0.56 | 0.58 | 0.61 | 3.2 |
| PHARMACEUTICAL & MEDICAL DEVICE INDUSTRY | 3.48 | 3.65 | 3.89 | 4.17 | 4.52 | 4.95 | 5.47 | 6.14 | 9.6 |
| RESEARCH INSTITUTES & LABORATORIES | 0.32 | 0.32 | 0.32 | 0.33 | 0.34 | 0.35 | 0.37 | 0.39 | 4 |
| SEMICONDUCTOR & ELECTRONICS INDUSTRY | 1.7 | 1.75 | 1.83 | 1.93 | 2.06 | 2.22 | 2.41 | 2.67 | 7.8 |
| TOTAL | 7.95 | 8.2 | 8.58 | 9.04 | 9.62 | 10.36 | 11.27 | 12.44 | 7.7 |
Target Audience
- Pharmaceutical Manufacturers : Australian pharma companies need particle counter market insights to ensure cleanroom compliance, optimize contamination control investments, and meet TGA regulatory requirements.
- Medical Device Manufacturers : Device manufacturers operating in Australia require market data to understand contamination control standards, benchmark against competitors, and plan capital expenditures for quality assurance.
- Equipment Suppliers & Distributors : Particle counter manufacturers and distributors targeting Australia need localized market intelligence to identify growth opportunities, assess demand trends, and develop region-specific sales strategies.
- Healthcare Facility Managers : Hospital and laboratory managers in Australia need market insights to evaluate particle counting solutions, understand technology trends, and justify investments in contamination monitoring systems.
- Regulatory & Compliance Consultants : Consultants advising Australian healthcare organizations require market data to guide clients on compliance strategies, technology selection, and best practices for particle counting implementation.
Reasons to Buy this Report
- Market-Specific Growth Data : Access detailed insights into Australia's 8.8% CAGR trajectory and USD 5.5M-to-USD 8.3M market expansion, enabling accurate forecasting for regional business planning.
- Regulatory Landscape Intelligence : Understand how Australian TGA standards and NATA requirements are shaping particle counter adoption, helping manufacturers align products with local compliance mandates.
- Competitive Positioning : Identify market opportunities specific to Australia's pharmaceutical and medical device sectors, allowing suppliers to tailor strategies for this high-regulation market.
- Investment Decision Support : Make informed decisions about facility expansion, technology upgrades, and market entry strategies based on Australia-specific demand drivers and growth projections.
- Supply Chain Optimization : Leverage Australia-focused market data to optimize distribution networks, identify key manufacturing hubs, and prioritize resource allocation for regional growth.
Frequently asked questions
What is the current size of Australia's particle counters market?
Australia's particle counters market was valued at USD 5.5 million in 2024 and is projected to grow to USD 8.3 million by 2029.
What is the growth rate of Australia's particle counters market?
Australia's particle counters market is growing at a compound annual growth rate of 8.8% from 2024 to 2029.
What factors are driving growth in Australia's particle counters market?
Australia's market growth is driven by stringent regulatory standards, expanding pharmaceutical manufacturing, increased cleanroom adoption, and heightened focus on product quality and contamination control in healthcare facilities.
Which industries in Australia are the primary users of particle counters?
Australia's primary users include pharmaceutical manufacturers, medical device producers, healthcare facilities, biotechnology companies, and quality assurance laboratories requiring contamination monitoring.
How does Australia's particle counters market compare to the Asia Pacific region?
Australia's 8.8% CAGR aligns with strong regional growth trends, positioning Australia as a significant market within Asia Pacific's broader particle counters sector driven by healthcare advancement and manufacturing excellence.
RESEARCH METHODOLOGY
To make a balance between primary and secondary research for the particle counters market, different market variables for small and medium-sized businesses and major businesses were analyzed as part of this study. The next step involved primary research with industry experts along the value chain to validate these findings, assumptions, and market sizing. Many different methodologies were used for estimating the overall market size, involving the top-down and bottom-up approaches. The study consists of significant market segments, evolving patterns, regulatory frameworks, and competitive environments. This study also considers leading market players and the strategies they deploy in this market. In conclusion, the total market size was estimated through top-down and bottom-up approaches along with data triangulation to reach the number for the final market size. Primary research was conducted throughout the study to validate and test each hypothesis.
Secondary Research
During the study, secondary research employed a variety of sources, including directories and databases such as Bloomberg Businessweek, D&B Hoovers, and Factiva. Additional materials included white papers, annual reports, SEC filings, and investor presentations. This research approach was used to collect and generate data that offers comprehensive, technical, and market-focused insights into the particle counters market. The data provides insights into key players and market segmentation based on recent industry trends, as well as significant developments in the market. A database comprising leading industry figures was also created through this secondary research.
Primary Research
Primary research involved activities aimed at obtaining qualitative and quantitative data. A range of personalities from both supply and demand sides were questioned during this phase. For the supply side, folks from key designations like CEOs, vice presidents, directors of marketing and sales, directors of technology and innovation, and other important leaders were interviewed by key players. Among the demand-side primary sources were academic institutions, and research organizations. To validate market segmentation, identify prominent market participants, and gain insights into significant industry trends and market dynamics of the real-world primary study was carried out.
A breakdown of the primary respondents is provided below:
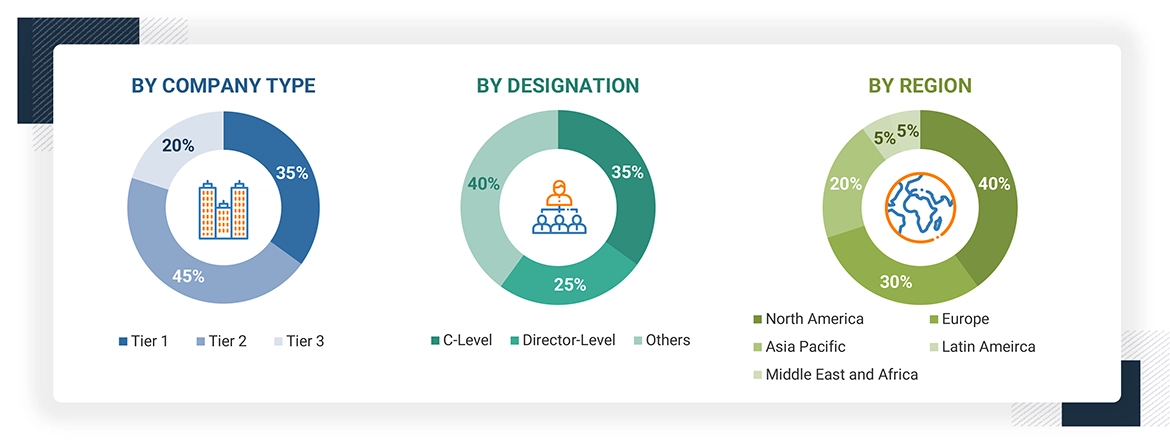
*Others include distributors, suppliers, product managers, business development managers, marketing managers and sales managers.
Note: Companies are categorized into tiers based on their total revenue. As of 2023, Tier 1 = >USD 1,000 million, Tier 2 = USD 500–1,000 million, and Tier 3 = < USD 500 million.
To know about the assumptions considered for the study, download the pdf brochure
Market Size Estimation
As per the review of prominent companies and their revenue shares, market size of the global particle counters market was calculated in this report. Key players with significant share in the market were identified as part of secondary research and their particle counters business revenue was calculated, the same was validated by primaries. Analyzing the annual and financial reports of the leading market participants was one aspect of secondary research. On the other hand, in-depth interviews with important thought leaders, including directors, CEOs, and marketing executives, were a part of the primary study.
For calculation of global market value, segmental revenue was calculated in the basis of revenue mapping of service/product providers. Process involved below mentioned steps:
- List of key players that operate in the particle counters market on regional or on country level.
- Formation of product mapping of manufacturers of particle counters and related product lines at regional and country level
- Revenue mapping for listed players from particle counters and related product and services.
- Revenue mapping of major players to cover at least ~70% of the global market share as of 2023. Revenue mapping for major players that cover nearly 70% of the global market share for year 2023.
- Revenue mapping extrapolation for players will drive the global market value for the respective segment.
- Summation for market value for all segment and subsegment to achieve actual value of the global value of particle counters market.
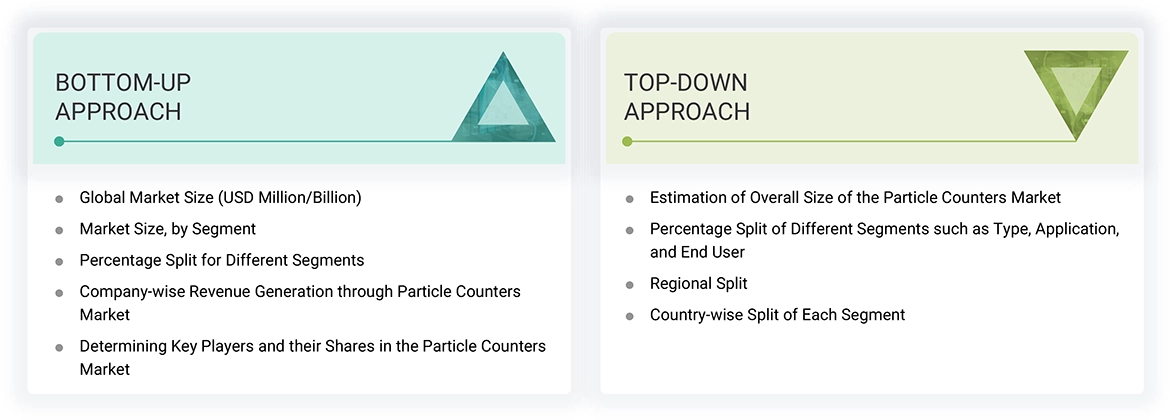
Data Triangulation
After getting the overall market size from the market size estimation process mentioned above, the Particle counters market was split into segments and subsegments. Data triangulation and market segmentation procedures were used to complete the overall market engineering process and arrive at the exact statistics for all segments and subsegments. The data was triangulated by studying and analyzing various factors and trends from both the demand and supply sides. Additionally, the Particle counters market was verified and validated using both top-down and bottom-up approaches.
Market Definition
Particle counters are monitoring instruments that work on light scattering or light obscuration and measure the particle size and concentration in air or liquid medium samples or environments. Particle counters are an indispensable Quality Assurance (QA) and Quality Control (QC) tool for pharmaceutical and biotechnology product testing, semiconductor testing, medical device testing, and food & beverage testing, among other applications. The market consists of particle counters that are used for environmental monitoring, process control, and quality assurance by various end–users.
Stakeholders
- Pharmaceutical Industry
- Medical Device Industry
- Manufacturers and suppliers of particle counters.
- Product suppliers, distributors, and channel partners
- Semiconductor & Electronics Industry
- Food & beverage industry
- Chemical Industry
- Academic & research institutes
- Community centers and hospitals
- Regulatory authorities and industry associations
- Venture capitalists and investment firms
Report Objectives
- To define, describe, and forecast the market for particle counters based on the types of samples they can detect particles.
- To give detailed information regarding factors influencing the growth potential of the particle counters market (drivers, restraints, opportunities, challenges, and trends)
- To study the micro markets by considering individual growth trends, future prospects, and contributions to the particle counters market
- To study and analyze crucial growth opportunities in the particle counters market for prominent stakeholders and to give insights into the competitive landscape for market leaders.
- To forecast the size of market segments and/or subsegments with respect to five major regions, namely, North America (US and Canada), Europe (Germany, France, the UK, Italy, Spain, and the RoE), Asia Pacific (Japan, China, India, and the RoAPAC), Latin America (Brazil, Mexico, and RoLATAM), and the Middle East & Africa
- To profile the key players in the global particle counters market and deeply analyze their market shares and core capabilities.
- To study, track, and analyze the competitive developments undertaken in the global particle counters market, such as product launches; agreements; expansions; and mergers & acquisitions.
Get the Full Particle Counters Market Report
Full forecast, segment splits, and company analysis for all Particle Counters Market.
- Canada Particle Counters Market
- US Particle Counters Market
- Germany Particle Counters Market
- UK Particle Counters Market
- France Particle Counters Market
- Italy Particle Counters Market
- Spain Particle Counters Market
- Japan Particle Counters Market
- China Particle Counters Market
- India Particle Counters Market
- South Korea Particle Counters Market
- Brazil Particle Counters Market
- Mexico Particle Counters Market
- Rest Of Europe Particle Counters Market
- Rest Of Asia Pacific Particle Counters Market
- Rest Of Latin America Particle Counters Market
- GCC Region Particle Counters Market
- Rest Of Mea Particle Counters Market
Need a Tailored Report?
Customize this report to your needs
Get 10% FREE Customization
Customize This Report
