
UAE Patient Experience Technology Market (2025-2030)

The UAE Patient Experience Technology Market was valued at $6.25 Million in 2025 and projected to reach to $11.26 Million by 2030, representing a compound annual growth rate of 12.5%. The UAE Patient Experience Technology Market is poised for sustained expansion driven by government digitalization mandates and increasing patient expectations for seamless healthcare interactions.


| Market Size in | USD 26.32 MN |
| Market Forecast in | |
| CAGR | |
| Forecast Period | |
| Units Considered | Value (USD MN) |
UAE Patient Experience Technology Market Trends and Insights
- The UAE's advanced healthcare infrastructure and government initiatives to digitalize patient care are driving adoption of innovative experience technologies across hospitals and clinics.
- The UAE's strategic investments in healthcare IT and emphasis on patient-centric care models are positioning the nation as a regional leader in healthcare technology adoption. The UAE Patient Experience Technology Market is benefiting from increasing smartphone penetration, rising healthcare spending, and regulatory support for digital health solutions.
- By 2030, the UAE is expected to see widespread implementation of patient portals, telemedicine platforms, and AI-driven feedback systems.
- The UAE's competitive healthcare landscape and focus on medical tourism are accelerating demand for technologies that enhance patient satisfaction and operational efficiency..
Key Market Statistics
- CAGR (2025-2030) 12.5% CAGR
- Market Size, 2025 ~USD 6.25 Million
- Forecast, 2030 ~USD 11.26 Million
- Country UAE
UAE Patient Experience Technology Market Overview
Market Valuation Growth :
UAE Patient Experience Technology Market valued at $6.25 million in 2025, expanding at 12.5% CAGR to reach $11.26 million by 2030, outpacing global growth rate of 11.8%.
Government Digital Health Initiatives :
UAE government's strategic push to digitalize patient care through national health IT programs and regulatory frameworks is accelerating adoption of experience technologies across healthcare facilities.
Advanced Healthcare Infrastructure :
UAE's world-class hospital networks and private healthcare sector investments create a fertile environment for deploying cutting-edge patient experience solutions and digital health platforms.
Regional Healthcare Innovation Hub :
Dubai and Abu Dhabi's positioning as regional healthcare centers attract international healthcare providers and technology vendors, driving competitive adoption of patient experience technologies.
UAE Patient Experience Technology Market Dynamics
- Healthcare providers across Dubai, Abu Dhabi, and other emirates are investing heavily in patient portals, telemedicine platforms, and AI-powered engagement tools to enhance care delivery and operational efficiency. The market's growth trajectory reflects UAE's commitment to becoming a global healthcare destination.
- Strategic partnerships between local healthcare institutions and international technology vendors, combined with rising healthcare spending and digital literacy, will continue to propel adoption of innovative patient experience solutions through 2030..
Market Ecosystem
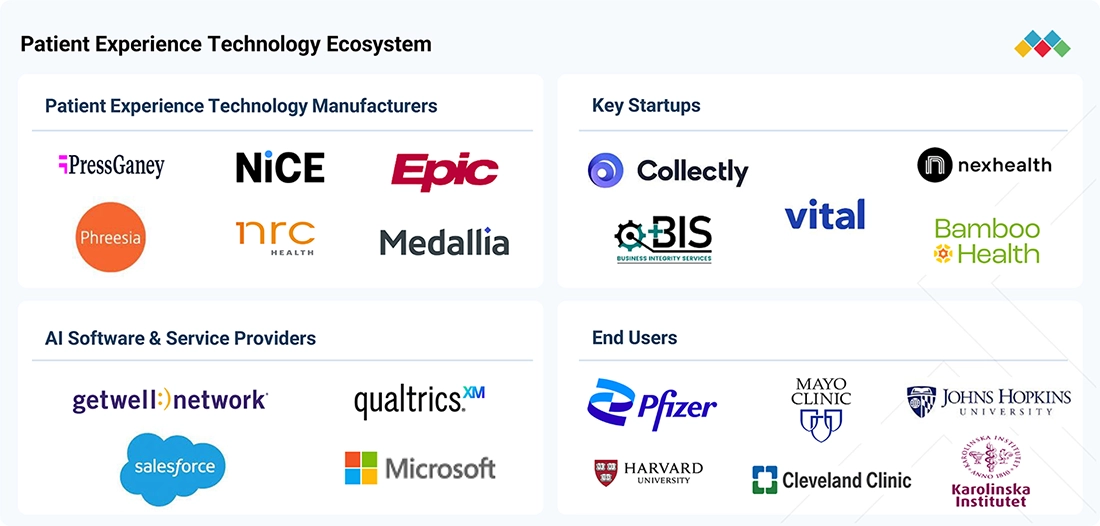
PATIENT EXPERIENCE TECHNOLOGY MARKET: COMMERCIAL USE CASES ACROSS INDUSTRIES
| COMPANY | USE CASE DESCRIPTION | BENEFITS |
|---|---|---|
 |
Integrated patient portals, MyChart apps, telehealth, and scheduling tools that connect with EHRs to support appointment booking, visit summaries, and secure messaging | Streamlined access, better care coordination, higher patient satisfaction |
 |
Track satisfaction across inpatient, outpatient, and digital touchpoints for quality improvement in hospitals. It also supports post-discharge feedback, physician performance tracking, and experience optimization across telehealth and mobile platforms. | Enables healthcare providers to capture real-time patient feedback and uncover actionable insights using AI and NLP analytics. It helps improve service quality, personalize care experiences, and automate issue resolution across the patient journey. |
 |
Patient experience measurement platforms providing real-time feedback, healthcare consumer insights, and loyalty analytics to help hospitals and health systems understand community needs and patient expectations | Deeper patient insights, stronger loyalty, community trust, and improved care personalization. |
 |
Real-time patient feedback, satisfaction surveys, and reputation management platforms integrated with care delivery systems | Continuous quality improvement, stronger loyalty, reputation enhancement |
 |
Experience management (XM) platforms offering patient and caregiver surveys, sentiment analysis, and AI-powered dashboards that integrate with EHR and CRM systems for actionable insights across the care journey | Actionable experience insights, improved satisfaction, better decision-making, and higher care quality |
Logos and trademarks shown above are the property of their respective owners. Their use here is for informational and illustrative purposes only.
Related Ecosystem
Healthcare It
Key Takeaways
- The UAE Patient Experience Technology Market is valued at $6.25 million in 2025 and will reach $11.26 million by 2030, representing a 12.5% CAGR.
- The UAE's government-backed digital health initiatives and advanced healthcare infrastructure are primary catalysts for market expansion.
- The UAE's focus on medical tourism and patient satisfaction is driving adoption of AI-powered feedback and engagement platforms.
- The UAE's competitive healthcare sector and regulatory support for digital solutions position it as a regional innovation hub for patient experience technologies.
Patient Experience Technology Market Report Scope
| Report Metric | Details |
|---|---|
| Base Year | 2025 |
| Fastest Growing Segment | CLOUD-BASED SOFTWARE (Type) |
| Forecast Period | 2025–2030 |
| Growth Rate | CAGR of 11.8% from 2025 to 2030 |
| Largest Segment | SOFTWARE (Offering) |
| Market Size Base Year (Billions) | ~USD 0.66 (2025) |
| Revenue Forecast (Billions) | ~USD 1.16 (2030) |
| Segments Covered | Offering, Type, Service, Function, End User |
UAE Patient Experience Technology Market Report Segmentation
5 segment dimensions are covered across the global market.
By Offering
- Services
- Software
By Type
- Cloud-Based Software
- Hospitals & Health Systems
- Hybrid Software
- Long-Term Care & Post-Acute Care Facilities
- Managed Services
- On-Premise Software
- Other Healthcare Providers
- Outpatient & Ambulatory Care Centers
- Physicians & Group Practices
- Professional Services
By Service
- Managed Services
- Professional Services
By Function
- Appointment Scheduling
- Billing
- Feedback Management
- Other Functions
- Patient Communication
- Patient Engagement
- Patient Registration
- Virtual Care
By End User
- Healthcare Payers
- Healthcare Provider
- Healthcare Providers
- Other End Users
- Pharma & Biotech Companies
UAE: PATIENT EXPERIENCE TECHNOLOGY MARKET, BY END USER, 2023–2030
| Segment | 2023 | 2024 | 2025 | 2026 | 2027 | 2028 | 2029 | 2030 | CAGR (%) |
|---|---|---|---|---|---|---|---|---|---|
| HEALTHCARE PAYERS | 0.72 | 0.81 | 0.91 | 1.03 | 1.16 | 1.31 | 1.48 | 1.66 | 12.8 |
| HEALTHCARE PROVIDERS | 5.03 | 5.62 | 6.3 | 7.06 | 7.91 | 8.87 | 9.93 | 11.11 | 12 |
| OTHER END USERS | 0.85 | 0.93 | 1.02 | 1.11 | 1.21 | 1.32 | 1.44 | 1.57 | 9.1 |
| PHARMA & BIOTECH COMPANIES | 0.69 | 0.77 | 0.86 | 0.97 | 1.08 | 1.22 | 1.36 | 1.53 | 12.2 |
| TOTAL | 7.29 | 8.13 | 9.09 | 10.17 | 11.37 | 12.71 | 14.21 | 15.87 | 11.8 |
Target Audience
- Healthcare IT Vendors : Technology providers need UAE market insights to develop localized patient experience solutions, navigate regulatory requirements, and identify hospital partnerships for market penetration.
- Hospital & Clinic Operators : UAE healthcare facilities require market intelligence to benchmark digital maturity, evaluate technology investments, and align patient experience strategies with government initiatives.
- Private Equity & Investors : Investment firms targeting UAE healthcare need market sizing, growth projections, and competitive analysis to evaluate acquisition targets and portfolio company expansion opportunities.
- Healthcare Consultants : Management consultants advising UAE healthcare organizations need market data and trend analysis to develop digital transformation roadmaps and technology adoption strategies.
- Government & Policy Makers : UAE health authorities and policy bodies require market insights to assess digital health program effectiveness, identify gaps, and guide future healthcare IT investment priorities.
Key Companies in the UAE Patient Experience Technology Market
| Company | HQ | Ownership | Strongest segments |
|---|---|---|---|
| PRESS GANEY | United States | Private Company | Patient Experience Measurement & Analytics,Caregiver Engagement & Alignment,Clinical & Quality Solutions (Nursing Indicators, PROMs, Core Measures), |
| NATIONAL RESEARCH CORPORATION | United States | Public Company | Patient Experience Solutions,Market Experience and Brand Solutions,Employee Experience Solutions, |
| MEDALLIA INC. | United States | Private Company | Customer Experience (CX) Platform & Subscriptions,Employee, Citizen, and Patient Experience,Professional Services (Design, Implementation, Enhancements), |
| PHREESIA | United States | Public Company | Digital intake and clinical data capture (including PhreesiaPads and Arrivals Kiosks),Integrated payment and financing solutions,Patient engagement, activation, and communications (including AI-based smart answering), |
| NICE | Israel | Public Company | Customer Engagement (CXone Mpower and related CX/analytics),Financial Crime and Compliance (Actimize, X-Sight, Xceed),Digital Evidence and Investigations (Evidencentral, intelligent investigations), |
| R1 | United States | Private Company | Enterprise solutions (full-service RCM outsourcing),Revenue recovery,Revenue optimization, |
| IQVIA | United States | Public Company | Technology & Analytics Solutions,Research & Development Solutions,Contract Sales & Medical Solutions, |
| QUALTRICS | United States | Private Company | CustomerXM (customer experience),EmployeeXM (employee experience),DesignXM & research services, |
PRESS GANEY
Press Ganey is a private healthcare company founded in 1985 with 1,058 employees in the United States. The company specializes in patient experience and healthcare quality solutions.
NATIONAL RESEARCH CORPORATION
National Research Corporation is a publicly traded U.S. company founded in 1981 with 357 employees. It provides healthcare market research and patient experience measurement services.
MEDALLIA INC.
Medallia Inc. is a private company founded in 2001 with 2,037 employees based in the United States. The company offers customer experience management and feedback solutions across multiple industries.
PHREESIA
Phreesia is a publicly traded U.S. company founded in 2005 with 1,789 employees. It provides cloud-based patient intake and engagement solutions for healthcare providers.
NICE
NICE is a publicly traded Israeli company founded in 1986 with 9,626 employees. The company develops customer engagement software and analytics solutions for enterprises globally.
R1
R1 is a private U.S. company founded in 2003 with 29,650 employees. It provides healthcare revenue cycle management and business process outsourcing services.
IQVIA
IQVIA is a publicly traded U.S. company with 93,000 employees. It provides clinical research, data analytics, and healthcare consulting services to the pharmaceutical and life sciences industries.
QUALTRICS
Qualtrics is a private U.S. company founded in 2002 with 5,300 employees. The company offers experience management software and survey platforms for organizations across various sectors.
Reasons to Buy this Report
- Market-Specific Growth Data : Access precise UAE market sizing ($6.25M in 2025) and 5-year forecasts with 12.5% CAGR, enabling accurate investment planning and resource allocation for UAE healthcare operations.
- Competitive Landscape Intelligence : Understand UAE-specific vendor positioning, market consolidation trends, and competitive dynamics across Dubai, Abu Dhabi, and other emirates to identify partnership and expansion opportunities.
- Regulatory & Policy Insights : Gain detailed analysis of UAE government digital health initiatives, healthcare IT regulations, and compliance requirements shaping technology adoption across public and private healthcare sectors.
- Customer Segmentation Analysis : Identify high-growth hospital segments, private clinic adoption patterns, and patient demographics in UAE to tailor product offerings and go-to-market strategies effectively.
- Investment Decision Support : Make informed decisions on market entry, expansion, or M&A activities in UAE healthcare with comprehensive market data, growth drivers, and risk assessments specific to the region.
Frequently asked questions
What is the current size of the UAE Patient Experience Technology Market?
The UAE Patient Experience Technology Market is valued at $6.25 million in 2025 and is projected to grow to $11.26 million by 2030.
What is the expected growth rate for the UAE Patient Experience Technology Market?
The UAE Patient Experience Technology Market is expected to grow at a compound annual growth rate (CAGR) of 12.5% from 2025 to 2030.
What are the main drivers of growth in the UAE Patient Experience Technology Market?
Key drivers include the UAE's advanced healthcare infrastructure, government digital health initiatives, high smartphone penetration, rising healthcare spending, and focus on medical tourism and patient satisfaction.
Which technologies are most in demand in the UAE Patient Experience Technology Market?
Patient portals, telemedicine platforms, AI-driven feedback systems, and mobile health applications are among the most sought-after technologies in the UAE market.
How is the UAE positioned compared to other Middle East markets for patient experience technology?
The UAE is positioned as a regional leader due to its advanced healthcare infrastructure, strong regulatory support for digital health, competitive healthcare sector, and strategic investments in healthcare IT innovation.
RESEARCH METHODOLOGY
The study involved significant work to estimate the current size of the patient experience technology market. Exhaustive secondary research was done to collect information on the patient experience technology market. The next step was to validate these findings, assumptions, and sizing with industry experts across the value chain using primary research. Different approaches, such as top-down and bottom-up, were employed to estimate the total market size. After that, the market breakup and data triangulation procedures were used to estimate the market size of the segments and subsegments of the patient experience technology market.
Secondary Research
This research study relied heavily on secondary sources, including directories and databases such as Dun & Bradstreet, Bloomberg Businessweek, and Factiva; white papers, annual reports, and company house documents; investor presentations; and SEC filings. The market for companies offering patient experience technology solutions was determined using secondary data from paid and unpaid sources, analyzing the product portfolios of major companies in the ecosystem, and rating companies by performance and quality. Various sources were referred to in the secondary research process to identify and collect information for this study. Secondary sources included annual reports, press releases, company investor presentations, white papers, journals, certified publications, and articles from recognized authors, directories, and databases.
Various secondary sources were referred to in the secondary research process to identify and collect information related to the study. These sources included annual reports, press releases, investor presentations of patient experience technology vendors, forums, certified publications, and whitepapers. Secondary research was used to obtain critical information on the industry’s value chain, the total pool of key players, market classification, and segmentation from market- and technology-oriented perspectives.
Primary Research
In the primary research process, various sources from both the supply and demand sides were interviewed to obtain qualitative and quantitative information for this report. Primary sources mainly included industry experts from core and related industries, as well as preferred suppliers, manufacturers, distributors, technology developers, researchers, and organizations across all segments of this industry’s value chain. In-depth interviews were conducted with primary respondents, including key industry participants, subject-matter experts (SMEs), C-level executives of key market players, and industry consultants, among other experts, to obtain and verify critical qualitative and quantitative information and assess prospects.
Primary research was conducted to identify segmentation types, industry trends, key players, and key market dynamics such as drivers, restraints, opportunities, challenges, and strategies adopted by key players.
After completing market engineering (calculations for market statistics, market breakdown, market size estimations, market forecasting, and data triangulation), we conducted extensive primary research to gather information and verify and validate the critical numbers.
In the complete market engineering process, the top-down and bottom-up approaches and several data triangulation methods were extensively used to perform the market estimation and market forecasting for the overall market segments and subsegments listed in this report. Extensive qualitative and quantitative analysis was performed on the complete market engineering process to list the key information/insights throughout the report.
Breakdown of the Primary Respondents:
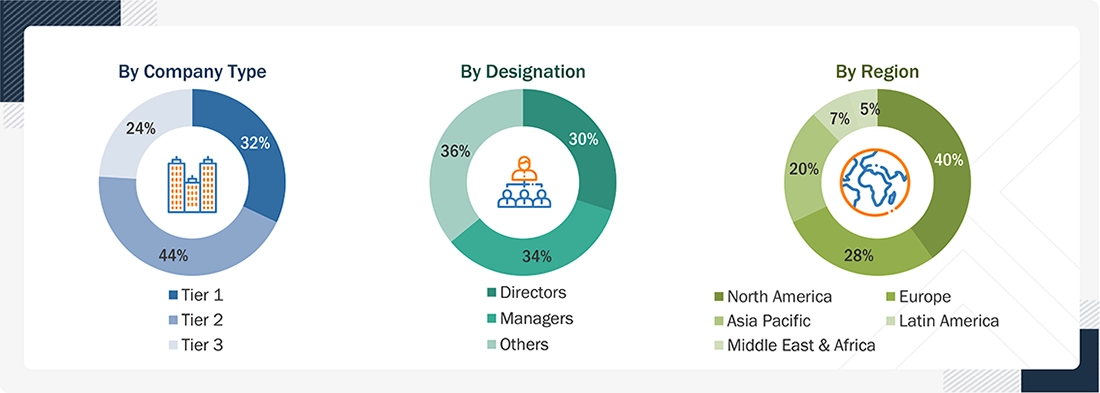
Note: Other designations include sales managers, marketing managers, and product managers.
Note: Tiers are defined based on a company’s total revenue as of 2025: Tier 1 = >USD 1 billion, Tier 2 = USD 500 million to USD 1 billion, and Tier 3 = <USD 500 million.
To know about the assumptions considered for the study, download the pdf brochure
Market Size Estimation
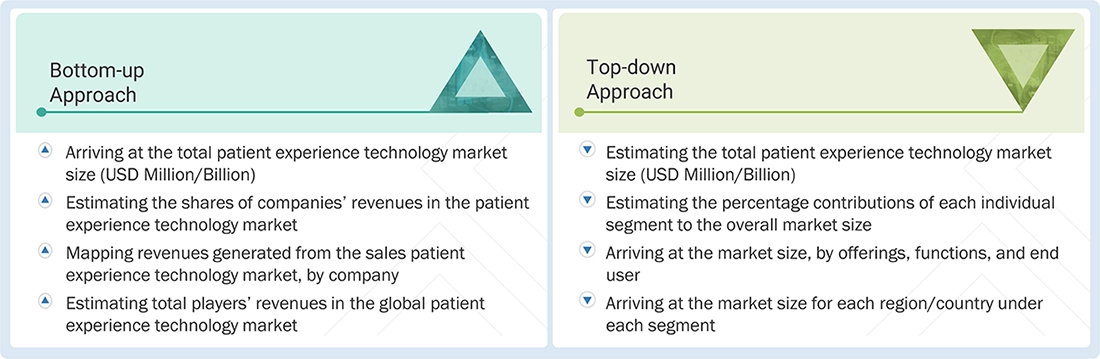
The market size estimates and forecasts in this study are derived through a mix of the bottom-up approach (revenue share analysis of leading players) and the top-down approach (assessment of utilization/adoption/penetration trends by offerings, functions, end user, and region).
Patient Experience Technology Market: Bottom-Up Approach
Data Triangulation
After arriving at the overall market size using the market size estimation processes, the market was split into several segments and subsegments. To complete the overall market engineering process and arrive at the exact statistics of each market segment and sub-segment, the data triangulation and market breakdown procedures were employed, wherever applicable. The data were triangulated by studying various factors and trends on both the demand and supply sides of the patient experience technology market.
Market Definition
The patient experience technology market refers to the range of digital solutions and platforms designed to enhance every interaction a patient has with a care provider across the patient journey. It focuses on improving convenience, transparency, and satisfaction through tools such as appointment scheduling, digital check-ins, wayfinding, real-time updates during care, billing transparency, and post-care feedback management.
By integrating real-time data, analytics, and interoperability with electronic health records, these technologies create seamless care journeys and informed decision-making. They empower patients and providers alike, fostering collaboration, transparency, and better adherence to treatment plans across the continuum of care.
Key Stakeholders
- Healthcare Providers
- Patient Experience Technology Vendors
- Government Bodies & Regulators
- Healthcare IT & EHR Vendors
- Patients and Caregivers
- Startups & Innovators
- Healthcare Associations/Institutes
- Payers & Insurance Companies
- Venture Capitalists & Private Equity
- System Integrators & Service Providers
- Distributors & Channel Partners
- Advocacy Groups & Patient Rights Organizations
- Investors and Financial Institutions
- Industry Associations & Trade Groups
Report Objectives
- To define, describe, and forecast the global patient experience technology market based on offerings, function, end user, and region.
- To provide detailed information regarding the factors influencing the growth of the market (such as the drivers, restraints, opportunities, and challenges)
- To strategically analyze micromarkets with respect to individual growth trends, prospects, and contributions to the overall patient experience technology market
- To analyze market opportunities for stakeholders and provide details of the competitive landscape for market leaders
- To forecast the size of the patient experience technology market in five main regions (along with their respective key countries): North America, Europe, the Asia Pacific, Latin America, and the Middle East & Africa
- To profile key players and comprehensively analyze their product portfolios, market positions, and core competencies in the market
- To track and analyze competitive developments such as product & service launches; expansions; partnerships, agreements, and collaborations; and acquisitions in the patient experience technology market
- To benchmark players within the patient experience technology market using the Company Evaluation Matrix framework, which analyzes market players on various parameters within the broad categories of business strategy, market share, and product offering
Available customizations:
With the provided market data, MarketsandMarkets offers customizations to meet your company’s specific needs. The following customization options are available for the report:
Company Information
- Detailed analysis and profiling of additional market players (up to 5)
Geographic Analysis
- Further breakdown of the Rest of Europe’s patient experience technology market into Denmark, Norway, and others
- Further breakdown of the Rest of Asia Pacific patient experience technology market into Vietnam, New Zealand, Australia, South Korea, and others
Get the Full Patient Experience Technology Market Report
Full forecast, segment splits, and company analysis for all Patient Experience Technology Market.
- US Patient Experience Technology Market
- Canada Patient Experience Technology Market
- UK Patient Experience Technology Market
- Germany Patient Experience Technology Market
- France Patient Experience Technology Market
- Italy Patient Experience Technology Market
- Spain Patient Experience Technology Market
- Japan Patient Experience Technology Market
- China Patient Experience Technology Market
- India Patient Experience Technology Market
- South Korea Patient Experience Technology Market
- Australia Patient Experience Technology Market
- Brazil Patient Experience Technology Market
- Mexico Patient Experience Technology Market
- Saudi Arabia Patient Experience Technology Market
- South Africa Patient Experience Technology Market
- Rest Of Europe Patient Experience Technology Market
- Rest Of Asia Pacific Patient Experience Technology Market
- Rest Of Latin America Patient Experience Technology Market
- GCC Countries Patient Experience Technology Market
Need a Tailored Report?
Customize this report to your needs
Get 10% FREE Customization
Customize This Report
